
The July 2021 update of the C++ extension for Visual Studio Code is here, bringing you brand new features— such as a Disassembly View while debugging, inline macro expansions, and debug support for Windows ARM64 architecture—along with a bunch of enhancements and bug fixes. To find out more about all the enhancements, check out our release notes on GitHub.
Disassembly View
We’re excited to announce that Disassembly View— our #1 upvoted GitHub issue (#206)— is publicly available in VS Code Insiders! Disassembly View allows you to debug assembly code corresponding to the instructions created by your compiler. It’ll be available in the 1.59 release of Visual Studio Code in August, but in the meantime you can download VS Code Insiders and try it out!
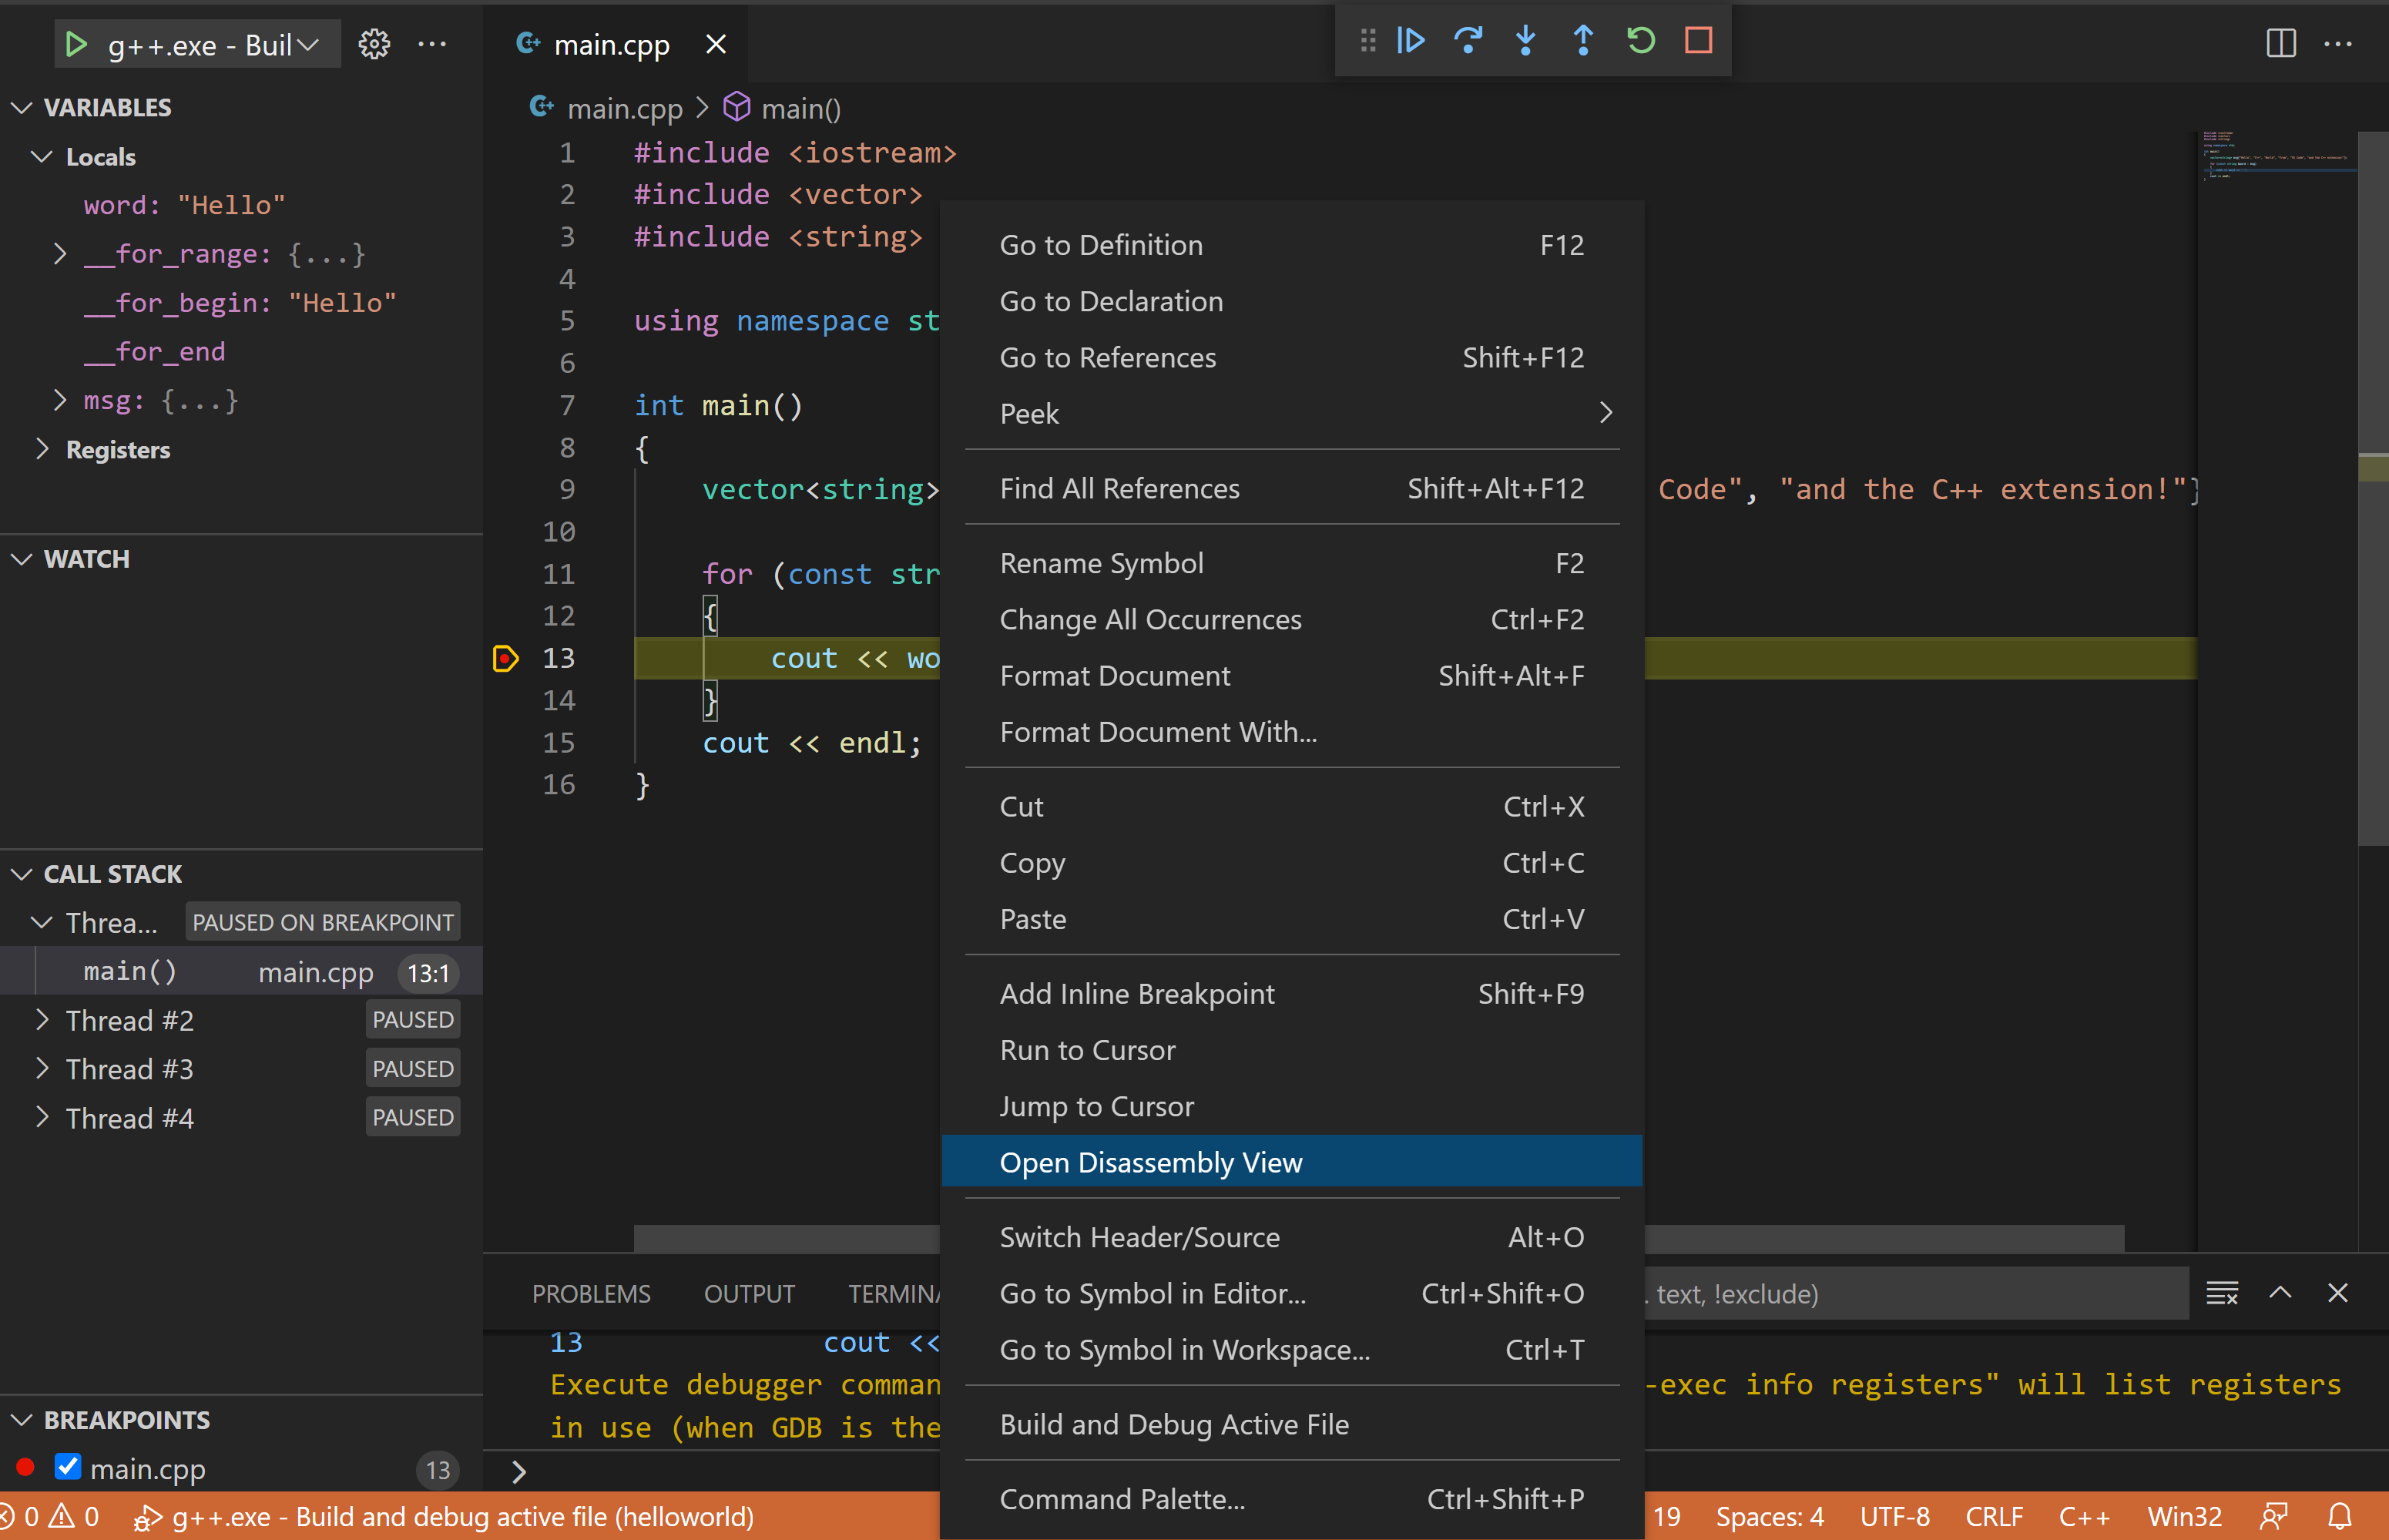
To open Disassembly View while debugging, right click your source code and select Open Disassembly View.
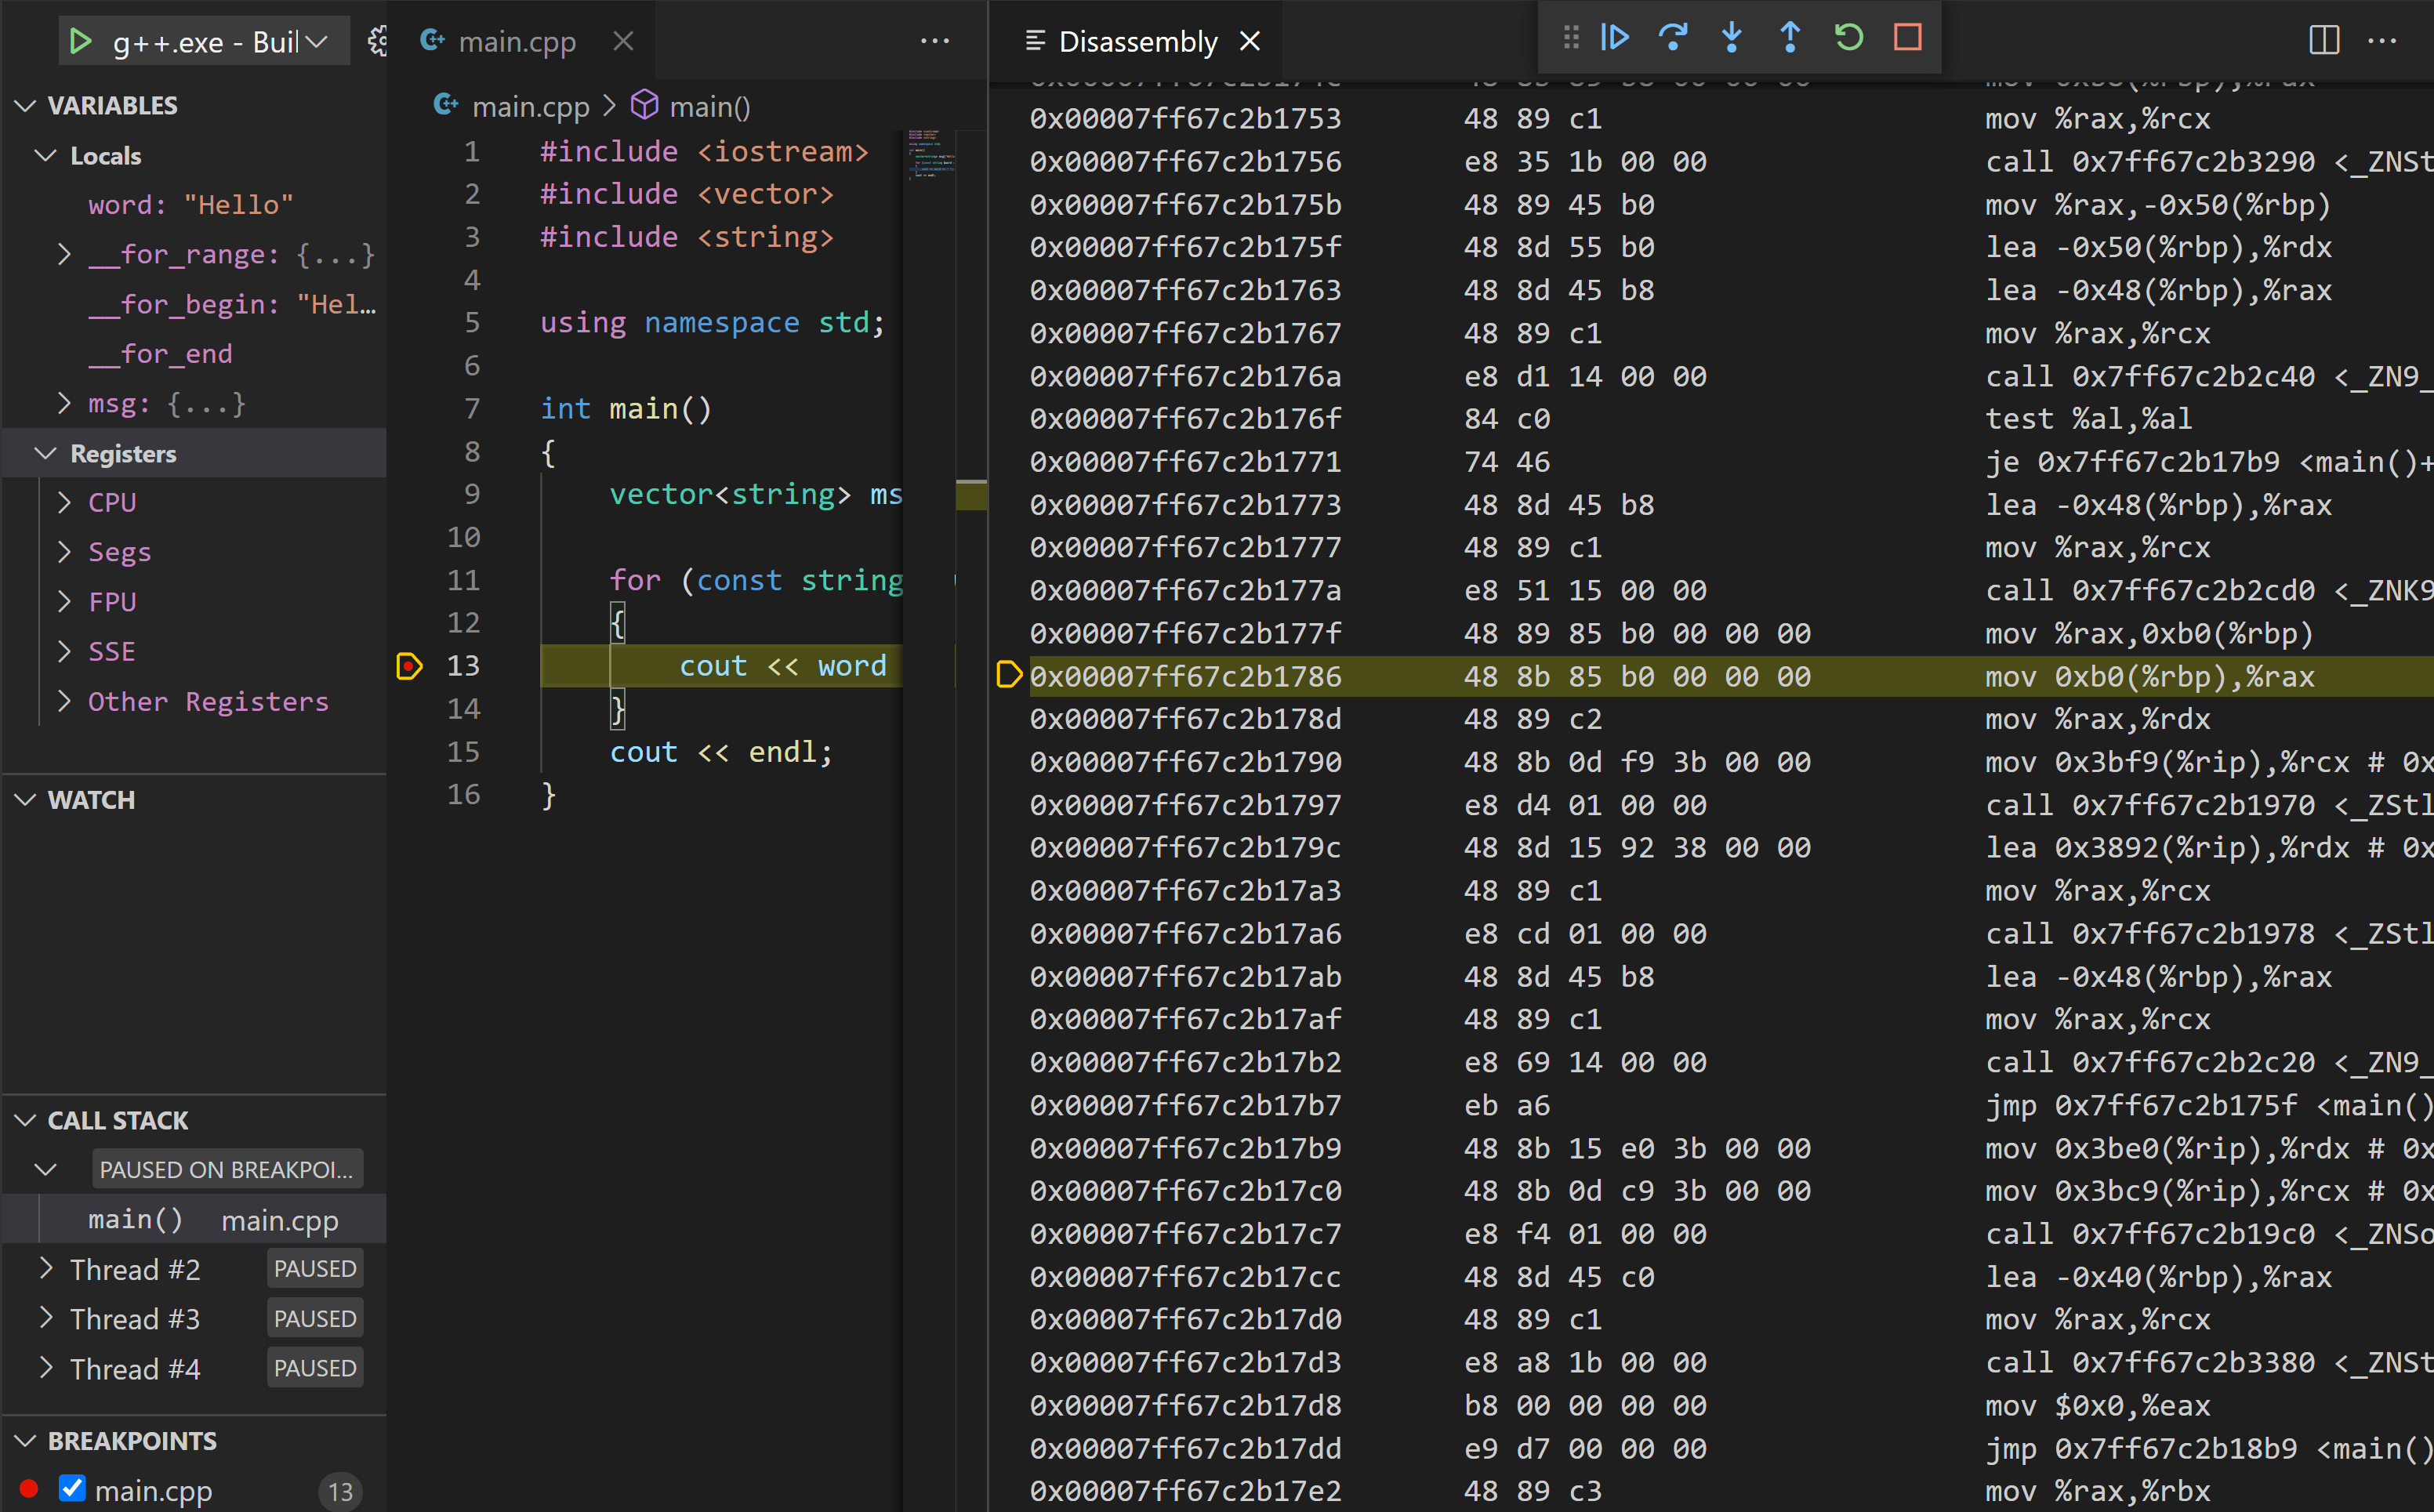
In the Disassembly View, the yellow hollow marker represents the current instruction. For each instruction, you’ll see the memory address (left column) and the machine language instructions displayed as hex (middle column) and as assembly language (right column). You can navigate between instructions, step over (F10) and step in to (F11) instructions.
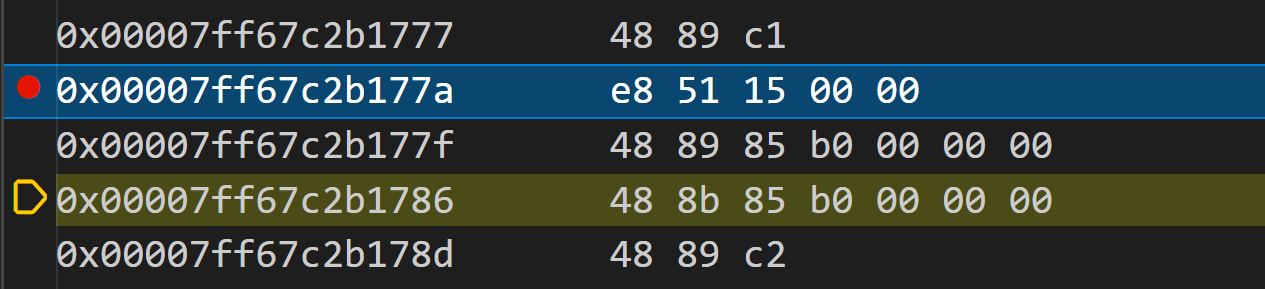
To set a breakpoint in the Disassembly View, hover over the instruction and click the red filled circle that appears to the left of the memory address.
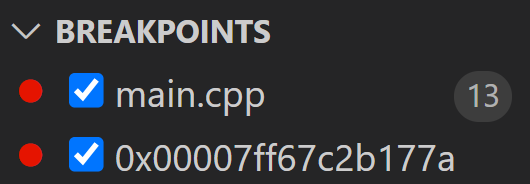
Unset the breakpoint by clicking the red dot again, or by unchecking the box in the Breakpoints section of the Debug pane.
Check out this GIF to see Disassembly View in action:
Macro Expansion
With this latest release of the C++ extension, you can expand macros inline (GitHub issue #4183), making it easier to read and understand your code. To expand a macro inline, click on it, select the lightbulb, and then click Inline macro.
Windows ARM64 Debugging
Last year, we announced support for running the C++ extension on Windows ARM64 architecture, giving Surface Pro X users access to C++ IntelliSense, code navigation, and build support. With the July 2021 update of the C++ extension, you can debug projects on Windows ARM64, completing the end-to-end Surface Pro X C++ development experience in VS Code.
What do you think?
Download the C++ extension for Visual Studio Code today, give it a try, and let us know what you think. If you run into any issues, or have any suggestions, please report them in the Issues section of our GitHub repository. You can also join our Insiders program and get access to early builds of our release by going to File > Preferences > Settings and under Extensions > C/C++, change the “C_Cpp: Update Channel” to “Insiders.” Then under Features > Extensions, enable “Extensions: Auto Update.”
We can be reached via the comments below or in email at visualcpp@microsoft.com. You can also find our team on Twitter at @VisualC.
could this extension have at least a memory address searcher on it, hard to use for this moment.
Thank you Julia for your great effort in Makefile Tool and Disassembly View. Now vscode is a full-fledged IDE that can be used in system programming. I have been searching for this kind of tool for long time, and finally I got this, thank you!
When I click open Disassembly view during debugging a simple C program, the Disassembly view is empty. I guess I missed something in my gcc compiling command, Can you provide your compiling command?
It should be working for C programs… are you building/debugging with Makefile Tools or with the C++ extension?
I am using Makefile Tools and C++ extension. I use gcc in the Makefile to compile program like this “gcc -g -o hello hello.c”.
A stable simple working feature is better thing that boat of features that you can't rely on.
When we talking about debugging linux code in VS code, facililated through above extension, basic debugging have to work first reliably.
took me whole day today, to find out that i could not debug my C Code using Linux GDB, because of VSCode / Extension for C/C++.
Eventually i had to use another IDE to debug, but i found out that gdb was itself working fine, its just hat VSCode was'nt able to consume GDB properly.
Logged an issue on VSCode repo on github as well. https://github.com/microsoft/vscode-cpptools/issues/7905
Hi Shahid – Thanks for logging an issue. Happy to see that your problem was resolved!