
You can now use Attach to Process to remote debug processes with GDB or LLDB in Visual Studio. The ability to attach to a process running on a remote system with GDB was added in Visual Studio 2019. The ability to attach to a process with LLDB is new in Visual Studio 2022 Preview 3.
Remote debugging in Visual Studio is especially valuable for teams who write cross-platform C++ code that runs on Windows and Linux or macOS. For example, if you use Windows + Visual Studio as your primary development environment, then you may need to occasionally debug code running on Linux or macOS. Rather than switching platforms and using GDB or LLDB from the command line, you can use Visual Studio to remote debug processes running on Linux and macOS. Visual Studio’s remote C++ support assumes that your source code is located in the Windows file system.
While a native, command driven workflow may be the best choice for your team, we know that some teams:
- Are unfamiliar with platform specific tools, especially if they use Windows + the Visual Studio debugger as their primary development environment.
- Prefer Visual Studio’s graphical interface and feature set over a command line interface.
- Find it unproductive to switch between platforms for native debugging.
- Rely on a subset of developers who are comfortable with command line tools to debug all non-Windows errors and are looking to democratize that process.
Follow the steps below to get started debugging a remote process with LLDB and Visual Studio 2022.
Getting started instructions
1. On Windows, Install Visual Studio 2022 Preview 3 or later.
2. On your remote system, acquire LLDB and LLDB-mi. On macOS you can install LLDB with XCode or the XCode Command Line Tools. You can install a build of LLDB-mi maintained by the C/C++ Extension for VS Code.
We don’t currently maintain a LLDB-mi binary for Linux. You can install LLDB and LLDB-mi with the instructions in this comment from iamWing in the C/C++ Extension for VS Code repository.
3. On your remote system, start SSH (instructions) and the process that you want to debug.
4. On Windows, open Visual Studio 2022 and select Debug > Attach to Process…
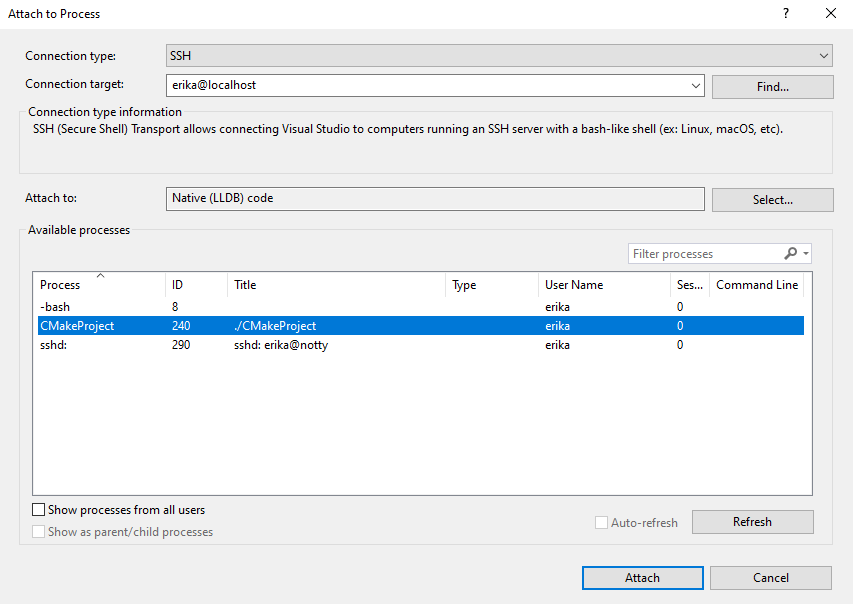
- Set the Connection type to SSH.
- Set the Connection target. You can select any system that you have added to the Visual Studio Connection Manager, or you can provide a new address with the format user@host (e.g., demo@121.121.2.11). You can also add new connections to the Visual Studio Connection Manager with our command line tool.
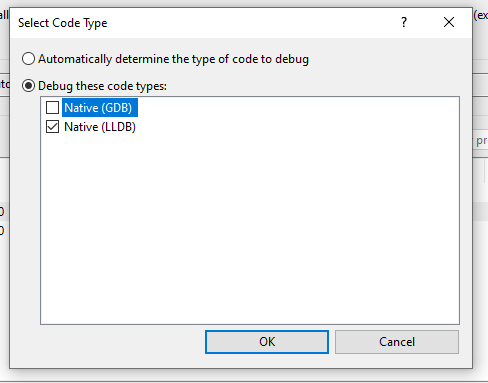
- Set the code type to Native (LLDB). If you are remote debugging with GDB, then set the code type to Native (GDB).
- The list of available processes will list all processes running on your remote system by process name and ID. Select the process that you want to remote debug and press “Attach” to launch the debugger.
5. Visual Studio will attach LLDB to the selected process and start a debugging session. You can pause the debugger to see the current execution point. All the debug windows support by Visual Studio will be populated with data from the remote process.
Talk to us!
Attach to Process is the first remote debugging scenario supported by LLDB in Visual Studio. Try it out and give us your feedback, or let us know if there are other remote debugging features that you want to see. The best way to file a bug or suggest a feature is with the Send Feedback button in the upper right-hand corner of the IDE. See Visual Studio feedback options for more information.
We’d love to learn how your team is adopting our support for LLDB. If you have feedback or a success story to share, you can contact us at vcpplinux-support@microsoft.com. You can also reach us on Twitter (@VisualC).
Can I choose LLDB as the default debugger in Visual Studio 2022? I met some issue using VS debugger to debug clang-cl built binaries. hard to explain what happened, but a simple instruction like “movsxd” loaded the wrong value during step-by-step. “fffffe95” was expected, but i got “fffffeCC” instead in the target register. So I want to try LLDB.