
C++ Team Blog
The latest in C++, Visual Studio, VS Code, and vcpkg from the MSFT C++ team
Latest posts

GitHub Copilot modernization for C++ is out of preview

GitHub Copilot modernization for C++ is out of preview as of Visual Studio 2026, helping you upgrade your MSVC Build Tools with an AI-guided workflow.
MSVC Build Tools Preview updates – June 2026

Try the latest updates to MSVC Build Tools Preview

What’s New in vcpkg (May 2026)

This release includes major library updates for Boost 1.91, Qt 6.11, and OpenCASCADE 8.0, along with 27 new ports and over 500 port updates.
What’s New for C++ Developers in Visual Studio 2026 (18.1 – 18.6)
Visual Studio 2026 versions 18.1 through 18.6 deliver a wave of improvements for C++ developers. For MSVC Build Tools, the v14.51 release is now generally available with runtime performance gains and improved C++23 conformance. We also introduced Sample Profile Guided Optimization to help you improve the runtime performance of your C/C++ programs. In the IDE, we made significant investments in AI-powered experiences to optimize your builds, modernize your code, debug and profile, and more. We enhanced Copilot Chat to make it easy to incorporate skills, custom agents, and MCP servers into your workflow. We also ad...
Introducing Sample Profile Guided Optimization in MSVC

Profile Guided Optimization (PGO) has long been one of the most powerful tools in the MSVC compiler's arsenal for improving the runtime performance of C and C++ applications. By using execution profile data collected from representative workloads, PGO enables the compiler to make smarter decisions about inlining, code layout, and hot/cold code separation - decisions that are impossible to make from static analysis alone. In practice, PGO can deliver large performance improvements for C/C++ code. Today, we're introducing Sample Profile Guided Optimization (SPGO), a new approach to profile-guided optimization th...

NuGet PackageReference for C++ Projects in Visual Studio
Native C++ projects (.vcxproj) now support NuGet PackageReference, the same modern package management experience .NET developers have used for years. Available as an experimental feature in Visual Studio 2026 version 18.7.
Segment Heap support for C++ projects in Visual Studio

Learn how Visual Studio enables Segment Heap by default for new C++ projects and how to adopt and verify it in existing builds.
MSVC Build Tools Preview updates – May 2026
Try the latest updates to MSVC Build Tools Preview
MSVC Build Tools version 14.51 (GA) now available
MSVC Build Tools v14.51 GA available in Visual Studio 2026 18.6
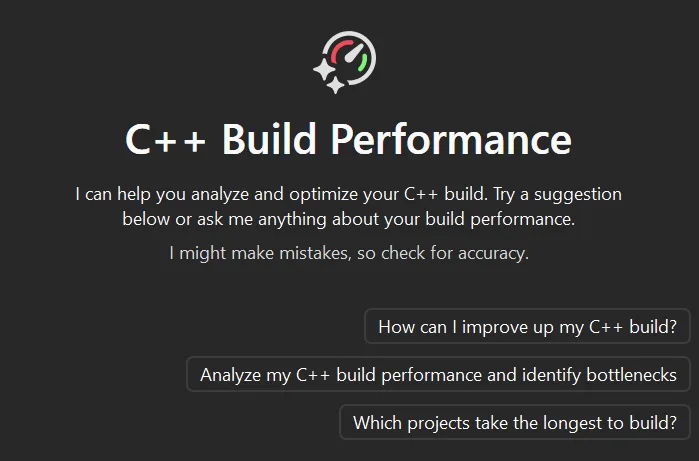
Project-Specific Build Optimizations with GitHub Copilot

We are excited to announce that GitHub Copilot build performance for Windows now supports project-specific builds! Available in the latest Visual Studio Insiders, you can target a single MSBuild project or CMake target instead of analyzing your entire solution. For game developers and teams working with large codebases, this eliminates the need to wait for a full-solution build when you only want to optimize one project. Since launching GitHub Copilot build performance for Windows in Public Preview, we have received a lot of feedback from game studios working on large engines and enterprise monorepos. Rebuildi...
What’s New in vcpkg (Apr 2026)
These updates include improved locking for parallel builds, cross-platform PE dependency analysis, manifest support for the depend-info command, and other improvements and bug fixes.
Giving Copilot more C++ context using custom instructions in VS Code

In February, we announced how GitHub Copilot can now use C++ symbol context and CMake build configuration awareness to deliver smarter suggestions in Visual Studio Code. Today, we're excited to share new ways to further enhance your C++ development experience with Copilot and get the most out of the language-aware agentic responses, by leveraging custom instructions designed specifically for C++ language tools. Enabling Custom Instructions You can access these custom instructions in the awesome-copilot repo, a community-driven collection of instructions, prompts, and configurations to help users get the most o...
Take the 2026 ISO C++ Developer Survey!
The 2026 ISO C++ developer survey is now open: 2026 Annual C++ Developer Survey "Lite" : Standard C++ It takes about 10 minutes and directly informs the standardization committee and tooling vendors so the C++ ecosystem can continue evolving the right way. Please share your feedback and share with your colleagues!
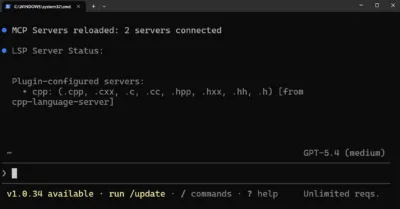
C++ Code Intelligence for GitHub Copilot CLI (Preview)

We recently brought C++ code understanding tools to GitHub Copilot in Visual Studio and VS Code. These tools provide precise, semantic understanding of your C++ code to GitHub Copilot using the same IntelliSense engine that powers code navigation in the IDE. Until now, these capabilities have been tied to GitHub Copilot in Visual Studio and VS Code. Today, we’re bringing this same intelligence to the CLI with the release of the Microsoft C++ Language Server for GitHub Copilot CLI, now available in Preview. Why this matters C++ is difficult for tools to reason about: complex include hierarchies, macros, template...
MSVC Build Tools Version 14.51 Release Candidate Now Available
Try out the final preview of MSVC Build Tools v14.51
C++23 Support in MSVC Build Tools 14.51

We’re pleased to provide an update on C++23 support in the Microsoft C++ (MSVC) Build Tools. This blog post will cover the feature additions in MSVC Build Tools version 14.51, including C++23 language features, libraries, and ISO C++ Core Working Group (CWG) and Library Working Group (LWG) Issue resolutions. We’ll also discuss the plans for completion of C++23 support in the MSVC compiler and how to make use of these latest feature updates. C++23 Language Features The following C++23 language features are now available under and in the MSVC Build Tools 14.51 Preview. An update of the documentation on learn.mi...
What’s New in vcpkg (Feb 2026 – Mar 2026): Parallel file installation and more!
These updates include a security fix for OpenSSL packaging on Windows, parallel file installation for improved performance, and other improvements and bug fixes.
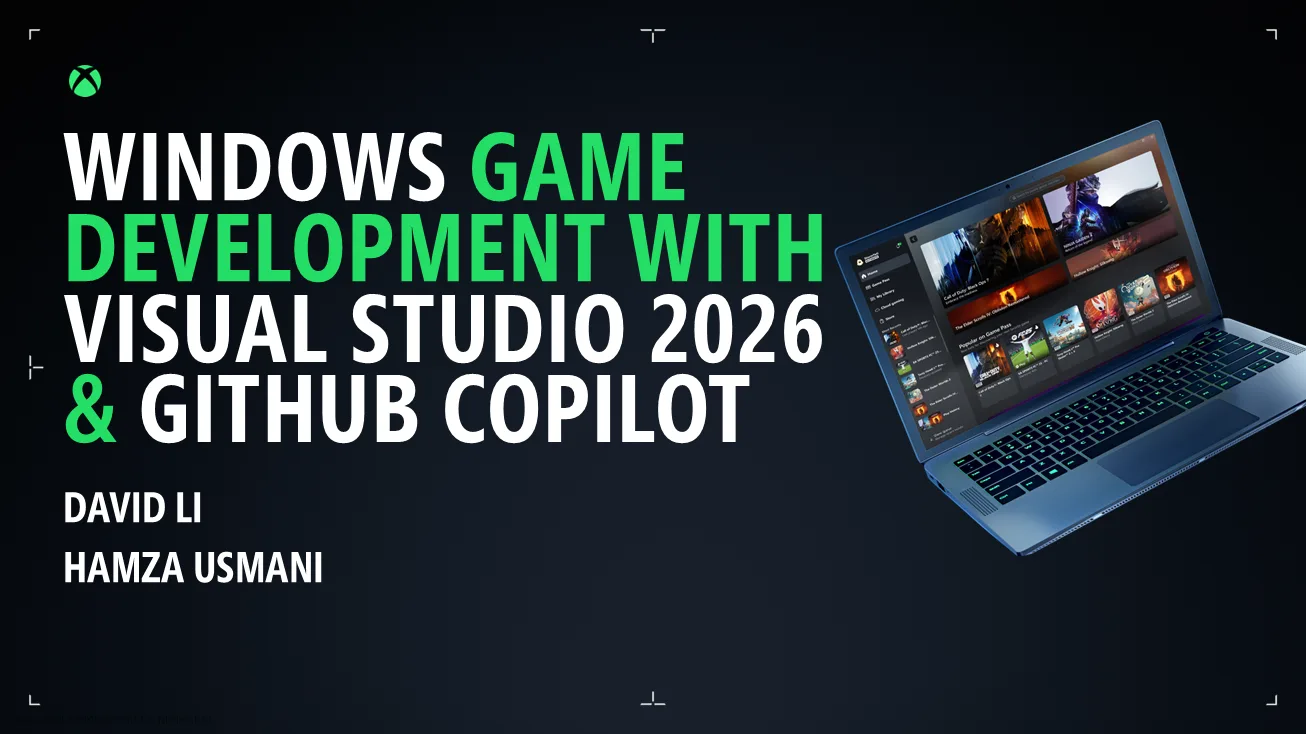
Visual Studio at GDC Festival of Gaming 2026
Join us at GDC Festival of Gaming 2026 for a deep dive into Visual Studio, GitHub Copilot, PowerToys, and the Windows tools that speed up your daily dev workflow. We'll show how these tools work together to boost productivity and cut friction across your entire inner loop. Session Title: Windows Game Development with Visual Studio 2026 and GitHub Copilot Session Info: Thursday, March 12, 10:10 am - 11:10 am Pacific Time | Room 2009, West Hall Abstract: Developing games on Windows is faster when your tools work together. This session walks through an end-to-end game development workflow, from setting ...
C++ Performance Improvements in MSVC Build Tools v14.51

MSVC Build Tools v14.51 improves performance through a wide range of new optimizations.
C++ symbol context and CMake build configuration awareness for GitHub Copilot in VS Code
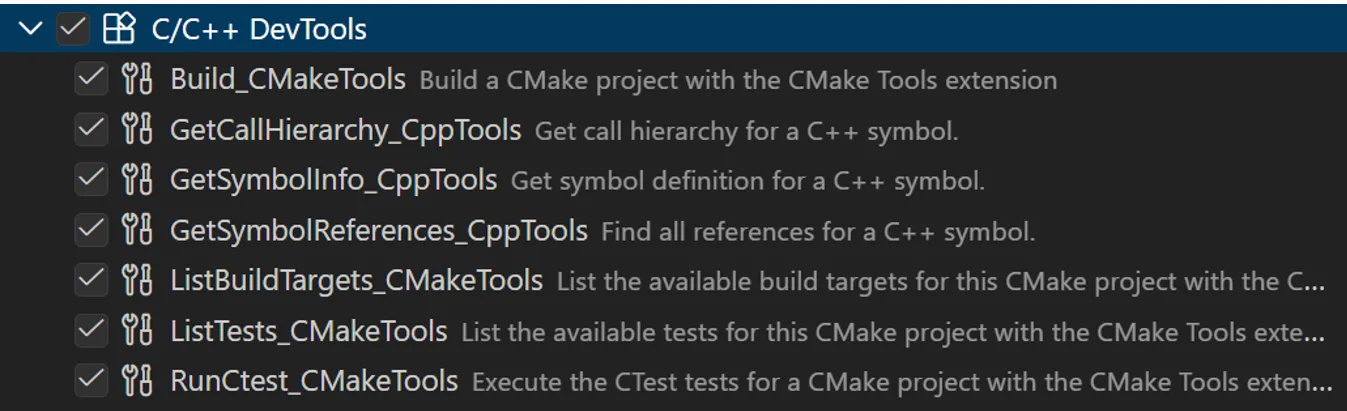
C++ code navigation and build system tooling play an important role in the developer inner-loop. Code navigation tooling provides a precise, semantic understanding of your codebase, while build system tooling helps you express build configurations and variants for reproducible builds. In the VS Code ecosystem, these powerful capabilities are available through our C/C++ and CMake Tools extensions. With the latest updates to GitHub Copilot in VS Code, we're bringing the same C++-specific intelligence directly into agent mode by surfacing key language and build system capabilities as tools the agent can invoke. T...
Microsoft C++ (MSVC) Build Tools v14.51 Preview Released: How to Opt In
Today we are releasing the first preview of the Microsoft C++ (MSVC) Build Tools version 14.51. This update, shipping in the latest Visual Studio 2026 version 18.4 Insiders release, introduces many C++23 conformance changes, bug fixes, and runtime performance improvements. Check out the release notes for an in-progress list of what’s new. Conformance improvements and bug fixes will be detailed in an upcoming blog post and Insiders release notes in the near future. We plan to ship more frequent, incremental MSVC Build Tools previews, just as we are shipping more frequent IDE updates. As a result, we have adjust...
What’s New in vcpkg (Nov 2025 – Jan 2026)
This blog post summarizes changes to the vcpkg package manager as part of the 2025.12.12 and 2026.01.16 registry releases and the 2025-11-13, 2025-11-18, 2025-11-19, 2025-12-05, and 2025-12-16 tool releases. These updates include support for targeting the Xbox GDK October 2025 update, removing a misleading and outdated output message, and other minor improvements and bug fixes. Some stats for this period: vcpkg changelog (2025.12.12, 2026.01.16 releases) Total ports available for tested triplets While vcpkg supports a much larger variety of target platforms ...
MSVC Build Tools Versions 14.30 – 14.43 Now Available in Visual Studio 2026
When Visual Studio 2026 reached General Availability in November, it included several versions of the Microsoft C++ (MSVC) Build Tools: To make it easier to bring your Visual Studio 2022 projects to Visual Studio 2026, we are now including all the versions of MSVC that shipped in Visual Studio 2022 version 17.0 and later to the Visual Studio 2026 installer. This includes MSVC versions 14.30 – 14.43 and x64/x86 and ARM64/ARM64EC build targets. This change also addresses a request from our users on Visual Studio Developer Community. With these new options in the installer, you can tr...
GitHub Copilot app modernization for C++ is now in Public Preview
With the launch of Visual Studio 2026, we announced a Private Preview of GitHub Copilot app modernization for C++, which reduces the cost of adopting the latest version of the MSVC Build Tools. We used the feedback we received from our many Private Preview participants to make improvements that benefit all our users. After receiving feedback, we added support for CMake projects, reduced hallucinations, removed several critical failures, improved Copilot’s behavior when encountering an internal compiler error, and reinforced Copilot’s understanding of when project files need to be modified to do the upgrade. He...
Visual Studio Code CMake Tools 1.22: Target bookmarks and better CTest output
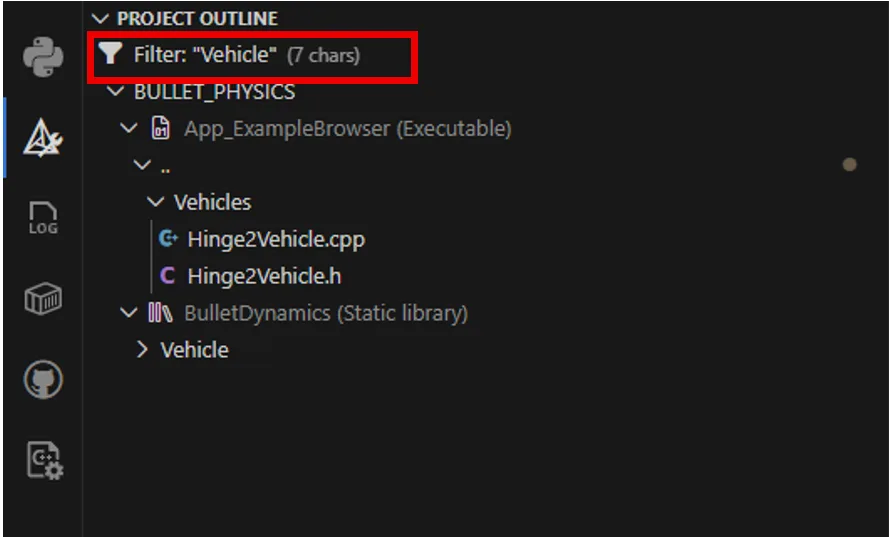
We're excited to announce the latest 1.22 release of the CMake Tools extension for Visual Studio Code. This update brings a host of new additions, including project outline updates for filtering and bookmarking CMake targets in large CMake projects and expanded CTest support to customize this output. To view the full list of updates with this release, please look at our CHANGELOG. This release features the following contributions from our open-source community. Thank you for your continued support! Project Outline view updates: Filter and bookmark your CMake Targets Naviga...
Now in Public Preview: GitHub Copilot build performance for Windows
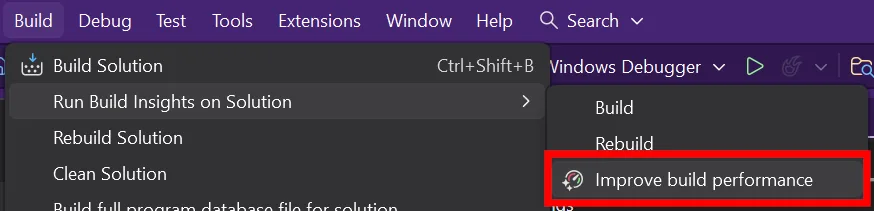
Last year, we launched our new GitHub Copilot build performance capabilities in Private Preview. With help from our fantastic C++ community, we gathered insights and addressed key feedback. We’re happy to share that GitHub Copilot build performance for Windows is now in Public Preview. Today, all C++ developers can try out the new capabilities in the latest Visual Studio 2026 Insiders. “I've tried the feature for a few hours and I'm happily impressed. The agent provided accurate suggestions, implemented them, and managed to reduce my build time by about 20%." - Alessandro Vergani, ARGO Vision Optimizing Bui...

C++ code editing tools for GitHub Copilot: now in Public Preview
In November, we introduced C++ code editing tools for GitHub Copilot as a Private Preview, focusing on partnering with customers to tackle one of the common, taxing challenges for C++ development: refactoring at scale. Since then, we've listened to feedback and refined our tooling to make wide-sweeping C++ edits easier. "With C++ code editing tools for GitHub Copilot in Visual Studio, we've seen noticeably better overall results, with fewer errors and faster processing on large projects." - Software engineer (from our Private Preview) We're excited to announce that C++ code editing tools for GitHub Copilot are ...
New release cadence and support lifecycle for Microsoft C++ Build Tools

Starting with Visual Studio 2026, we are introducing a new support lifecycle for the Microsoft C++ (MSVC) Build Tools. We are also updating the MSVC release cadence. As Visual Studio moves to a Modern Lifecycle with monthly feature updates and an annual new version, decoupling the compiler from the IDE offers you the best of both worlds – rapid iteration in the IDE and predictable, long-term stability for the build tools. This approach brings you the latest C++ advancements across both IDE and build tools while helping you maintain secure and compliant build environments, with enterprise-grade support, and fle...
Introducing MSVC AddressSanitizer for ARM64 targets

We are pleased to announce AddressSanitizer (ASan) support for the Microsoft C++ (MSVC) Build Tools for ARM64 targets. ASan is a runtime memory error detector that identifies difficult-to-find bugs with zero false positives and improves memory safety. More technical information on ASan can be found at aka.ms/asan. ASan has long supported the x64 and x86 architectures. With the release of Visual Studio 2026 for production use, this support now extends to ARM64. The feature is currently in preview, so there may be build, runtime, or IDE integration issues. Cross-compiling for ARM64 targets from x86 or x64 hosts...
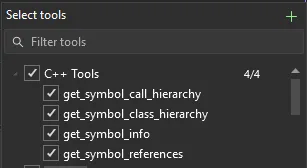
Perform wide-sweeping refactors using C++ code editing tools for GitHub Copilot
Refactoring a C++ codebase can often require tracking updates across various sections of multiple files to ensure accuracy and relevancy. Historically, developers have relied on manual searches across a codebase and refactoring tools to perform these types of edits. However, with GitHub Copilot agents, developers can now delegate these complex editing tasks to the agent, which understands your intent and can carry out codebase-wide edits, reducing the manual effort required to perform these refactors. To make this experience even more powerful for C++ developers, we’re introducing C++ Code Editing Tools f...
Optimize Your C++ Build Times with GitHub Copilot
Long build times are one of the top pain points for C++ projects. If you’ve ever waited too long for a C++ build to finish, you know how much it can slow down your productivity. In past years, we introduced C++ Build Insights to help you analyze traces and find bottlenecks. However, we know that embarking on these investigations manually can still take time and effort. To make this experience easier for C++ developers, we’re excited to announce that GitHub Copilot build performance for Windows is now available in Private Preview with the latest version of Visual Studio 2026 Insiders. New GitHub Copilot Ca...
Fix build issues using GitHub Copilot after upgrading MSVC Build Tools
A few problems have reared their heads at every company where I’ve worked on C++ as a Software Engineer over the past 20 years. For the most part, those problems have nothing to do with the language and how it is used, but instead all the “other” stuff, like dealing with long build times, getting consistent build environments, and managing the technical debt of an evolving tooling landscape. When the tools we use to build our applications and systems have new releases, we must make hard decisions. Do we adopt the latest and greatest and turn potential technical debt into realized technical debt, or do we e...
What’s New for C++ Developers in Visual Studio 2026 version 18.0
Get ready to level up your C++ productivity, because Visual Studio 2026 version 18.0 is now generally available! You can take advantage of the new features, bug fixes, and performance improvements in your production environment. This post describes what’s new for C++ developers, including new features or improvements in these areas: You can also read the broader announcement on the Visual Studio Blog for more details on changes that are non-C++-specific. Let’s dive in! Your feedback matters to us You can always give us feedback abo...
Inside Visual Studio: Improving Open-Source Workflows with vcpkg

vcpkg, an open-source C/C++ package manager maintained by Microsoft, is increasingly recognized as a leading dependency management solution. As an enterprise-grade tool, it enables organizations to streamline library imports, reduce duplication, and support flexible, reproducible builds across a wide array of environments. This need for streamlined dependency management is especially relevant in the build system for the Visual Studio repository. This system not only supports the development of Visual Studio itself but also integrates decades of legacy infrastructure, specialized tools, and complex architecture...
What’s New in vcpkg (October 2025)
This blog post summarizes changes to the vcpkg package manager as part of the 2025.10.17 registry release, the 2025-10-10 and 2025-10-16 tool releases, as well as changes to vcpkg documentation throughout October. This month’s updates includes partial support for Visual Studio 2026 and platform toolset v145, NetBSD platform support, and minor improvements and bug fixes. Some stats for this period: vcpkg changelog (2025.10.17 release) Documentation changes Over the past month we had minor documentation improvements. If you have any suggestions for our documentation, pl...

Microsoft C++ Team at CppCon 2025: Trip Report
Another year and another CppCon is all wrapped up! Microsoft was pleased to once again be an exhibitor and to have several of our employees present sessions at the conference. Here are my major takeaways from the keynotes, sessions, conversations, and the general vibe. The week before CppCon, we announced Visual Studio 2026 and Microsoft C++ (MSVC) Build Tools v14.50, and the conference gave us a great opportunity to let you know what you can expect in the new release and for you to give us your feedback. We highly encourage you to try out the Insiders release and let us know what your experience...
Upgrading C++ Projects to Visual Studio 2026
With Visual Studio 2026 version 18.0 getting closer to General Availability (GA), we want to share with you how you can upgrade your projects from your current versions of Visual Studio and the Microsoft C++ (MSVC) Build Tools to the latest versions. The new IDE ships with the v145 platform toolset for MSBuild C++ projects and MSVC Build Tools version 14.50. In this post, I will walk you through the process step-by-step, while explaining some of the features available to you to make the transition as painless as possible. Overall, our goal is to help you get current and stay current. You can also review the updat...
New GitHub Copilot capabilities for C++ developers: Upgrade MSVC, improve build performance, and refactor C++ code
Yesterday at GitHub Universe, GitHub announced support for custom agents. Custom agents are specialized configurations with custom prompts and context that focus Copilot on specific development tasks. On the C++ team, we have a similar goal: Provide differentiated capabilities that optimize GitHub Copilot for C++ development tasks. As a first step towards this goal, we’re announcing new capabilities for GitHub Copilot that support C++ developers in three development tasks: These experiences will be available soon as a Private Preview in Visual Studio 2026. Join the waitlist for Private Pr...
What’s New in vcpkg (September 2025)
This blog post summarizes changes to the vcpkg package manager as part of the 2025.09.17 registry release, the 2025-08-29 and 2025-09-03 tool releases, as well as changes to vcpkg documentation throughout September. This month’s updates includes new binary caching sources and , support for tvOS and watchOS target platforms, and minor improvements and bug fixes. Some stats for this period: vcpkg changelog (2025.09.17 release) Documentation changes If you have any suggestions for our documentation, please submit an is...
Fixing Overload Resolution For Parameter Arrays in C++/CLI

Fix a problem in C++/CLI parameter array overload resolution which affects newer .NET versions.
Microsoft C++ Team at CppCon 2025
It's that time of year again! We are excited to see you all at CppCon this year, where we'll once again be delivering a variety of presentations, from the latest advancements in debugging technology to extensibility frameworks for AI agents. See the end of this post for a listing of all of the sessions involving Microsoft staff. And yes, there'll be plenty of information on the freshly announced Visual Studio 2026. We'll also have a booth through the first four days of the conference. Come on by and let us know what matters to you or ask any burning questions you may have regarding C++ at Microso...
C++ Language Updates in MSVC Build Tools v14.50

C++ Language Updates in MSVC Build Tools v14.50 It has been some time since we have provided an update on MSVC progress, and this one comes with the latest major update to our IDE: Visual Studio 2026 version 18.0. This version of Visual Studio ships with the MSVC Build Tools version 14.50, which includes version 19.50 of the MSVC compiler. You can try out the improvements by downloading the Insiders release. Also, if you want to track updates in the Standard Library, check out the STL Changelog, which is regularly updated. Let’s jump right into the updates! C++23 Features As C++ standards progress in MSVC, you...
Visual Studio 2026 Insiders is here!
Get ready –the first Insiders release of Visual Studio 2026 has arrived! In this new evolution of Visual Studio, we’re continuing our commitment to building the best integrated developer environment for C++ developers on Windows. Visual Studio 2026 features a fresh UI, faster performance, and improved developer productivity with advanced AI integration. For more details on what’s new, check out the official announcement on the Visual Studio Blog! We would love your feedback – try out our Insiders release of Visual Studio 2026 today! If you run into any issues, you can report them to Visual Studio Dev...
What’s New in vcpkg (August 2025)
This blog post summarizes changes to the vcpkg package manager as part of the 2025.08.27 registry release as well as changes to vcpkg documentation throughout August. There were no tool changes as of the date of the registry release in August, though more changes will be listed in the next release in September. Some stats for this period: GitHub Dependabot support for vcpkg Earlier this month, we announced GitHub Dependabot support for vcpkg. This allows GitHub users to receive automated PRs to upgrade their vcpkg versioning baselines. Since that announcement, the automated PRs have b...
Announcing Proxy 4: The Next Leap in C++ Polymorphism

Version 4 of Microsoft's Proxy library brings feature improvements, better diagnostics, better code generation, modern compiler/debugger support.
Dependabot support for vcpkg

We are excited to announce that GitHub’s Dependabot now brings automated dependency updates to C++ projects using vcpkg. This support is available for projects using vcpkg manifest files, empowering teams to keep their library dependencies current and secure with minimal effort. With Dependabot, your repo can receive automatic pull requests to upgrade your libraries to the latest available versions. What does this mean for your projects? For C++ developers managing dependencies through vcpkg, this integration eliminates a critical gap in the DevSecOps pipeline. Dependabot will automatically scan your manifests...
What’s New in vcpkg (July 2025)
This blog post summarizes changes to the vcpkg package manager as part of the 2025.07.25 registry release, 2025-06-20, 2025-07-16, and 2025-07-21 tool releases, as well as changes to vcpkg documentation throughout July. This release includes a new command for printing package SPDX licenses, binary caching optimizations, and support for visionOS, Solaris, and illumos systems. Some stats for this period: vcpkg changelog (2025.07.25 release) The following notable changes were made in this release: Documentation changes If you have any suggestions for...
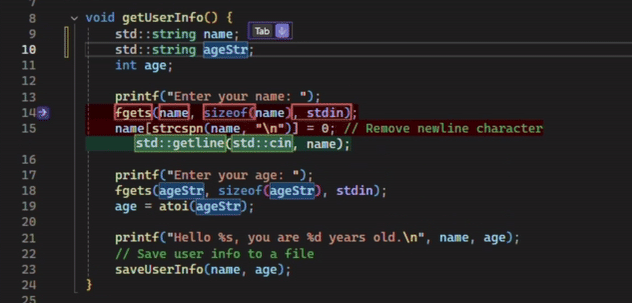
Dynamically Update C++ syntax using Next Edit Suggestions
When working in a C++ repo, you often are maintaining and updating existing code just as often as you are writing new code. However, updating code in C++ can often require navigating to several different locations in a file to ensure consistency, which can disrupt your logical workflow. For example, changing a data member’s access level typically involves several steps: moving the member between the and sections of the class, adding getter/setter methods, and updating all references to respect this new access level. GitHub Copilot now supports Next Edit Suggestions (or NES for short) to predict the next edit...
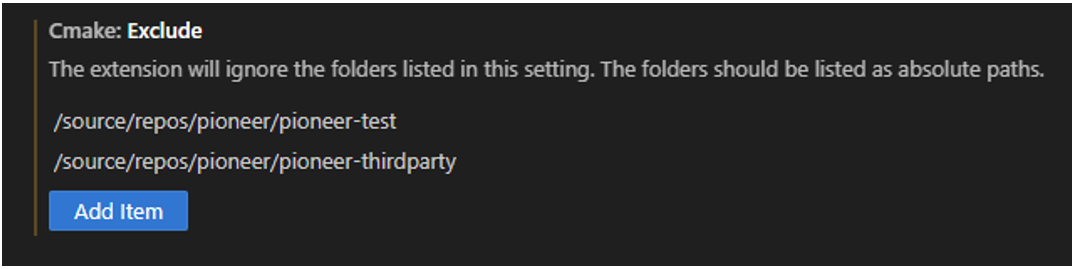
Visual Studio Code CMake Tools Extension 1.21 Release: Multi-root improvements, CMake Presets v10, and more…
We’re excited to announce the latest 1.21 release of the CMake Tools extension for Visual Studio Code. This update brings a host of new updates, including addressing one of our top-voted issues for multi-root improvements and adding CMake presets version 10 support. To view the full list of updates with this release, please look at our CHANGELOG. This release features the following ten contributions from our open-source community. Thank you for your continued support! Multi-root improvements We addressed one of our top-voted customer feedback issues to improve mult...
Updates to Warning Suppressions in Microsoft C++ Code Analysis

Improvements to \#pragma warning and gsl::suppress in Microsoft C++ Code Analysis.
Smarter, workspace-aware code completions for C++ in VS Code
C++ code understanding Developing C++ code can be complex. C++ project structure, style, and convention can vary widely from repository to repository, and critical context for a given task often spans multiple files. This can require C++ developers to open and navigate across several files to fully understand a given project and author new code. The GitHub Copilot team has focused on two areas to improve the C++ developer experience for code completions: These improvements are designed to help the autocomplete-style inline GitHub Copilot code completions be even more productive with C++ coding, m...
What’s New in vcpkg (June 2025)
This blog post summarizes changes to the vcpkg package manager as part of the 2025.06.13 registry release, 2025-04-16, 2025-05-19, and 2025-06-02 tool releases, as well as changes to vcpkg documentation throughout May and June. This release includes bug fixes, several documentation changes, and the removal of the binary caching provider for GitHub (alternatives are described below). Some stats for this period: vcpkg changelog (2025.06.13 release) The following notable changes were made in this release: Documentation changes ...

How Electronic Arts standardized C++ builds across Windows and Linux with Visual Studio Build Tools
At Electronic Arts (EA), the Frostbite Enginering Workflows team has thousands of developers who work on powerful game engines behind popular games. EA has relied on Visual Studio for years due to several features such as IntelliSense, Build Insights, and the overall debugging experience and eagerly use newer integrations such as GitHub Copilot. They also use Visual Studio capabilities for their cross-platform development needs. We're proud to partner with EA to shape cross-platform development capabilities in Visual Studio. Read more in the full story about how we worked with EA to enable them to customize ...
Address Sanitizer Updates for Visual Studio 2022 Version 17.14

Introduction It has been an exciting few months for the Address Sanitizer (ASan) since our last update. In addition to our continuous focus on quality and correctness, our internal “dogfooding” (i.e. internal adoption) effort has reached several important milestones. In this update, I want to go over some of the quality improvements since Visual Studio 2022 version 17.13, and to give a peek into how ASan is now protecting our C++ toolset against memory safety errors during development. Some improvements in Visual Studio 2022 version 17.14 This release also contains several other impr...
What’s New for C++ Developers in Visual Studio 2022 17.14

Visual Studio 2022 version 17.14 is now generally available! This post summarizes the new features you can find in this release for C++. You can download Visual Studio 2022 from the Visual Studio downloads page or upgrade your existing installation by following the Update Visual Studio Learn page. Standard Library and Compiler We’ve made a myriad of fixes and improvements to the MSVC compiler and standard library. See C++ Language Updates in MSVC in Visual Studio 2022 17.14 for a full list of changes on the compiler side, and the STL Changelog for all the standard library updates. Compiler We’ve added support...
Introducing the /forceInterlockedFunctions switch for ARM64

In Visual Studio 2022 17.14, we are introducing the switch, which generates and links with out-of-line atomics that select Armv8.1+ Large System Extension (LSE) atomic instructions based on CPU support. This switch is on by default for Armv8.0 and off for Armv8.1+. Outlining is necessary in Armv8.0 because this version's interlocked intrinsics use exclusive instructions—/—that do not guarantee forward progress. This can cause performance issues due to intermittent livelocks. See Arm Architecture Reference Manual for A-profile architecture, section "B2.17.5 Load-Exclusive and Store-Exclusive instruction usage ...
C++ Language Updates in MSVC in Visual Studio 2022 17.14
Introduction In this update, we continue the tradition of bucketing bugs into helpful categories for you all to filter through along with even more notes from the compiler team as to what, exactly, was fixed. This blog is also complemented by the recent Pure Virtual C++ pre-conference talk by RanDair Porter; so please check out RanDair's talk, "MSVC C++23 Conformance", if you have not already to get a better view of MSVC's conformance status for Visual Studio 2022 overall. 17.13 notes for reference. C++23 Features Note: C++23 features can be used by either adding or to the command line. In addition, feat...
What’s New in vcpkg (April 2025)
This blog post summarizes changes to the vcpkg package manager as part of the 2025.04.09 registry release, 2025-03-22, 2025-04-01, and 2025-04-07 tool releases, as well as changes to vcpkg documentation throughout April. This release contains bug fixes, a new documentation article on offline usage of vcpkg, and other minor improvements. Arm64 Linux users of vcpkg also no longer have to build the vcpkg tool from source when they install vcpkg. Some stats for this period: vcpkg changelog (2025.04.09 release) The following notable changes were made in April: ...

There’s a Linux File Explorer built into Visual Studio!?!
The Remote File Explorer in Visual Studio provides developers with a convenient way to browse, view, and edit files on remote machines—directly from within the IDE. It's a powerful tool for managing remote environments without leaving your development workflow. Scott Hanselman published a new YouTube video to his channel, taking us on the journey of discovering and using the Remote File Explorer to interact with his personal PiDP-11 through shell scripts stored on the minicomputer. Check out Scott’s video and his thoughts about using the Remote File Explorer below: Using the Remote File Explorer and re...
VS Code C++ Extension 1.25 Release: Explain C++ symbols using Copilot & Customize recursive include paths

The 1.25 release of the C++ extension in Visual Studio Code introduces a new way to understand your code faster with GitHub Copilot-powered symbol summaries, as well as new customization options for recursive #include path processing. With these enhancements, you gain AI-powered insights into unfamiliar or undocumented code and can optimize IntelliSense performance based on your preferences. Experience these new features for yourself by updating to version 1.25. Copilot Hover Want to understand your unfamiliar codebases like undocumented library code quicker without having to navigate around files and re...
Pure Virtual C++ 2025 is Tomorrow
Pure Virtual C++ is our free, one-day, virtual conference for the whole C++ community. It's running live tomorrow, 30th April, from 14:00 to 16:30 UTC. The talks are: We also have a host of pre-conference content available on YouTube. We look forward to seeing you there!
Pure Virtual C++ 2025: Pre-Conference Videos
Pure Virtual C++ is our free, one-day, virtual conference for the whole C++ community. It is running on 30th April. The first half of our pre-conference videos is now available on YouTube. The videos are: We look forward to seeing you at Pure Virtual C++!
Pure Virtual C++ 2025: Full Schedule
Pure Virtual C++ is our free, one-day, virtual conference for the whole C++ community. This year, it is running on the 30th April. We're pleased to announce the schedule of live talks: You can find abstracts for all the talks and register for the conference with the button below. Keep an eye out for on-demand pre-conference content coming soon on YouTube.
What’s New in vcpkg (March 2025)
This blog post summarizes changes to the vcpkg package manager as part of the 2025.03.19 registry release, 2025-03-13 tool release, as well as changes to vcpkg documentation throughout March. This release includes two new commands for our continuous integration system PR reviews, minor bugfixes, a new documentation article on authenticating to NuGet feeds, and a few other minor documentation fixes. Some stats for this period: vcpkg changelog (2025.03.19 release) The following notable changes were made in March: Documentation changes ...

Pure Virtual C++ 2025 Talks Announced
Pure Virtual C++ is our free, one-day, virtual conference for the whole C++ community. This year, it is running on the 30th April. We're pleased to announce four of our five live sessions for the day: You can find abstracts for all the talks and register for the conference with the button below.
Automatically generate any doc comment for C++ functions in Visual Studio
Have a difficult time documenting your C++ code? Spending too much time thinking of what a function and its parameters accomplish when generating documentation? Copilot is now integrated into C++ doc comments to automatically provide documentation suggestions based on the function’s contents in Visual Studio 2022 17.14 Preview 2. To learn more about this feature, please check out the original announcement on the Visual Studio blog. What do you think? Try out the latest Copilot features for your C++ workflows today. To access these updates to Copilot, you’ll need an active GitHub Copilot subscription a...
VS Code C++ Extension Updates: 4x Faster Colorization & 3.5x Faster Project Startup
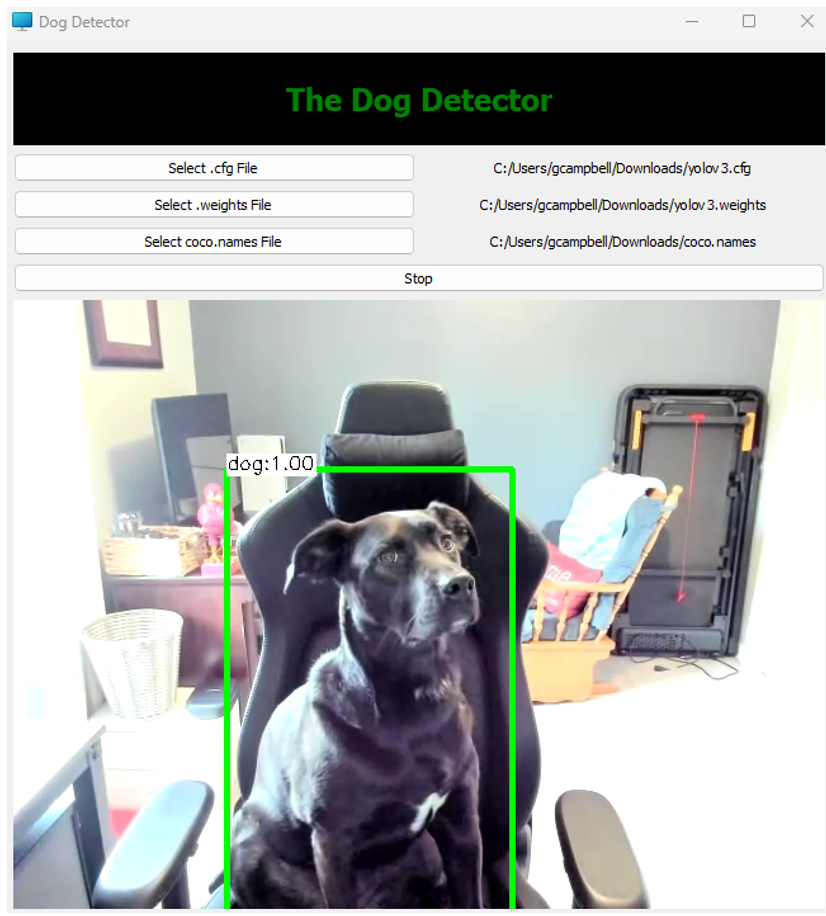
In the latest releases of the C++ Extension in Visual Studio Code, we have focused on performance improvements and stability. A fast, responsive, and reliable development environment is essential for maintaining productivity, especially in large and complex C++ projects. These updates include many incremental optimizations that collectively speed up the time from opening a C++ project to writing code with the full suite of C++ features available at your fingertips. Experience these new features for yourself by updating to the newest version of the C++ Extension. Faster Project Startup and Time to Colorization ...
Boost Your CMake Development with Copilot Custom Instructions

Introduction Creating a new CMake project that uses unfamiliar libraries can be daunting and time-consuming. This blog post takes you along on my journey using Copilot to make this easier, and leveraging Custom Instructions to tailor Copilot responses. For a sneak peek, see the outcome of this journey in this repository. Background As C++ developers who use Copilot every day, we’ve experienced how it can improve our day-to-day productivity. Copilot really shines in scenarios like new codebases or unfamiliar topics, significantly reducing ramp-up. There are multiple ways to engage with it in Visual Studio, incl...
Sign Up for the free Pure Virtual C++ 2025 Conference
Every year we run Pure Virtual C++: a free one-day virtual conference for the whole C++ community. Next month we’re doing it again! Sign-up for free to get access to our five live sessions and a host of pre-conference content. The live event will start at April 30th 14:00 UTC. Videos will be available to stream for free on YouTube after the conference. The speakers and topics will be announced soon. Hope to see you there!

C++ Dynamic Debugging: Full Debuggability for Optimized Builds
Over the past 5 years, we’ve had many incredible opportunities to engage with game developers. From AAA studios to indie developers, the passion for slashing iteration times is significant. Amidst all the fantastic feedback we've received for Visual Studio, one sentiment has rung loud and clear: a desire to debug optimized C++ code without sacrificing performance. Although game developers have voiced this need the loudest, we know that solving this issue will benefit many other C++ workflows. While we've consistently rolled out many productivity and performance enhancements over the years, debugging optimized cod...

Optimizing Build Times with Build Insights: How Activision Cut Call of Duty’s Build Time by 50%

Slow build times are a major headache for developers, especially in large, complex C++ codebases like game engines. Every minute spent waiting on a build is time that could be used to refine features, resolve issues, or push development forward. Activision faced this challenge with Call of Duty: Modern Warfare II, where prolonged build times were slowing down iteration and impeding workflows. By leveraging Build Insights, they identified key inefficiencies, optimized bottlenecks, and successfully reduced build times from 27:49 minutes to just 14:25 minutes—cutting them in half. Read more about their journey in ou...
Visual Studio at GDC 2025
Join us in-person at Game Developers Conference 2025 with an in-depth look at how Visual Studio and GitHub Copilot can streamline your iteration workflow. Don’t miss the unveiling of our biggest C++ debugger update yet. Session Title: Accelerating Your Inner Loop with Visual Studio and GitHub Copilot Session Info: March 19th, 2025, 12:30 PM-1:30 PM Pacific Time | GDC Industry Stage, Expo Floor, South Hall Abstract: Get ready to supercharge your development process with the newest features in Visual Studio! This year, we're thrilled to unveil our most powerful C++ debugger upgrade yet, designed to sla...
Announcing Guidelines Support Library v4.2.0
Version 4.2.0 of Microsoft's Guidelines Support Library brings performance improvements, safety features, modern compiler support.
What’s New in vcpkg (February 2025): Package installation performance, new tested triplet, and more
This blog post summarizes changes to the vcpkg package manager as part of the 2025.02.14 registry release, 2025-02-11, 2025-01-29, 2025-01-24, and 2025-01-20 tool releases, as well as changes to vcpkg documentation throughout February. This release includes significant performance improvements when installing packages, a new tested triplet (x64-windows-release), an overhaul of how vcpkg handles some downloads and console output, and bug fixes. In terms of documentation, there are improvements to our maintainer guide, registries articles, and versioning articles, among others. Some stats for this period: ...
std::generator: Standard Library Coroutine Support
is a C++23 feature that enables you to write concise, straightforward functions that generate sequences of values on-demand without manually managing state. It builds upon C++20’s coroutines, providing some standard library support for this powerful, but complex, language feature. As of Visual Studio 2022 version 17.13, we ship an implementation of in our standard library. This blog post will walk through an example of how to use the feature, compare it to implementing custom ranges, consider some of the design decisions made, and briefly look at the performance implications. Motivating Example Here’s a sh...
MSVC Address Sanitizer updates in Visual Studio 2022 version 17.13
We have been investing in the quality of MSVC Address Sanitizer (ASan) in several key areas over the past year, including working with LLVM upstream to stay coordinated with their changes, adding coverage for internal tools and libraries, and hardening APIs and runtime modes. Upstreaming to LLVM MSVC ASan is derived from a fork of the LLVM repository. Prior to Visual Studio 2022 version 17.12, MSVC ASan was based on outdated versions of LLVM’s compiler-rt (where the ASan source code lives), and we could not incorporate changes from newer versions of LLVM without significant delay. We have recently comple...
Visual Studio Code CMake Tools Extension 1.20 Release: Introducing Built-In CMake Language Services
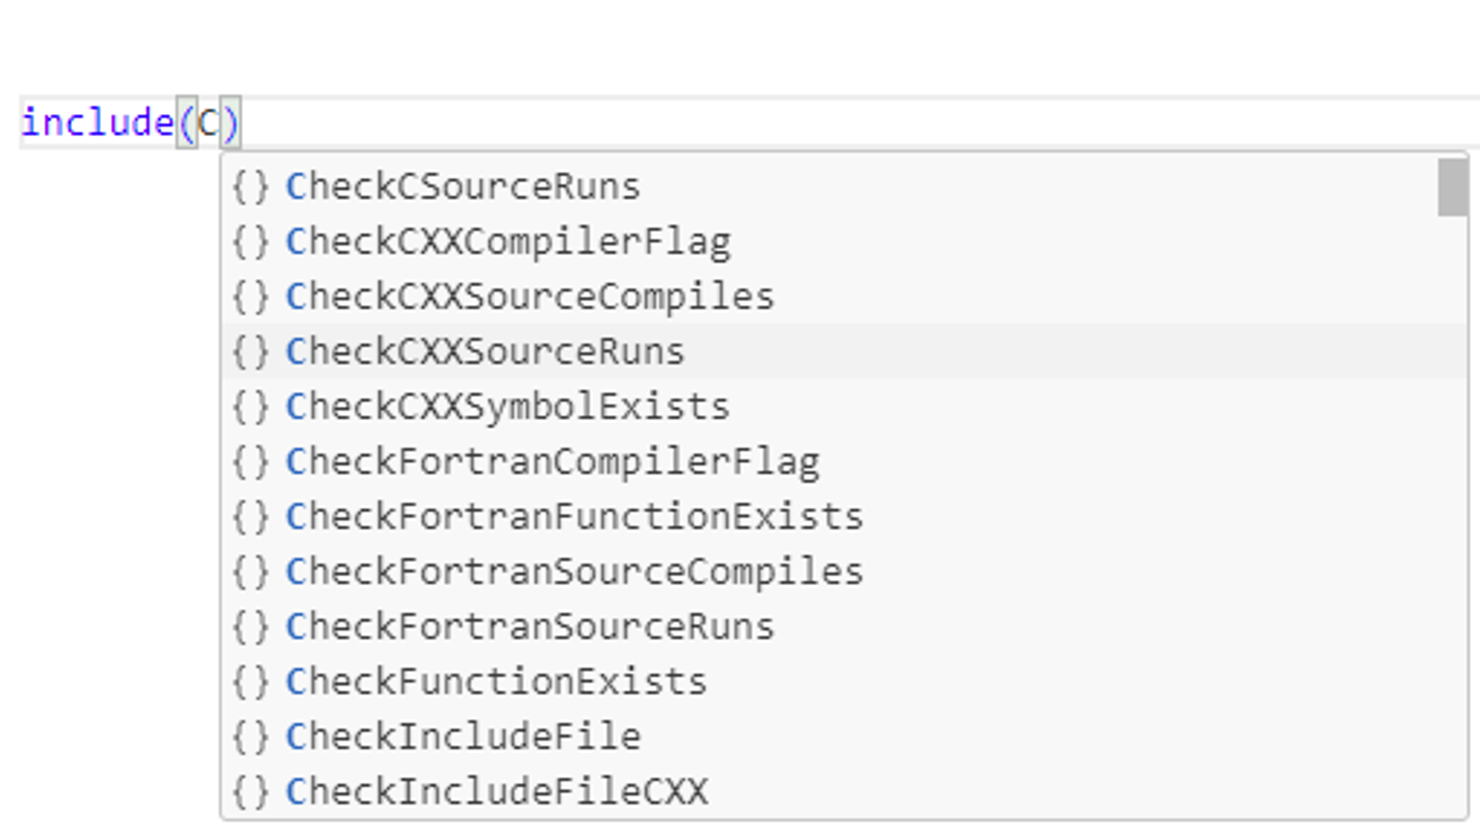
The February release of CMake Tools in VS Code is now available. With this release, we have some new updates to the extension to improve CMake integrations with the extension’s support. Some updates include the built-in support for CMake Language services, addressing our most highly-upvoted issues in the CMake Tools extension, and CMake presets v9 support. To view the full list of updates with this release, please look at our CHANGELOG. This release features the following nine contributions from our open-source community. Thank you for your continued support! Built-i...
MSVC C++ Code Analysis: Updates in Visual Studio 2022 version 17.13
This post details the latest updates in Visual Studio 2022 version 17.13 for MSVC C++ Code Analysis. Driven by internal team insights and developer community feedback, these improvements significantly reduce false positives and strengthen production code security.
C++ Language Updates in MSVC in Visual Studio 2022 17.13
Introduction For this update, we have changed things up a little bit. We now have more distinct buckets of fixes/implemented features. This is to help guide readers who care about specific features to more easily see how the compiler front-end team is making progress on the things you care about. 17.12 notes for reference. C++23 Features As part of our continuing ramp-up on C++23 conformance, the team has implemented the following features. In future releases customers can expect to see continued acceleration towards C++23 conformance. Note: C++23 features can be used by either adding or to the command...
What’s New for C++ Developers in Visual Studio 2022 17.13
We are happy to announce that Visual Studio 2022 version 17.13 is now generally available! This post summarizes the new features you can find in this release for C++. You can download Visual Studio 2022 from the Visual Studio downloads page or upgrade your existing installation by following the Update Visual Studio Learn page. Standard Library and Compiler On the compiler side, we’ve implemented C++23’s literal suffix. The suffix or (or any permutation of these) will help you avoid sneaky truncations or signed comparison mismatches, especially when writing loops. For example: Note that, while this feature...

Document build instructions and more with enhanced C++ awareness from Copilot Chat in Visual Studio
C++ development often involves nuances beyond the file you’re developing in. This can leave developers with many mental tabs open, balancing all the relevant context for their project to develop their C++ code properly. Copilot Chat in Visual Studio can already utilize context provided by specified files and invoked agents such as @workspace to generate suggestions. However, to improve the relevance of Copilot suggestions, we must provide tailored context to Copilot with considerations specific to the C++ language for developers to achieve better results. That way, developers can focus less on providing all th...
What’s New in vcpkg (January 2025)
This blog post summarizes changes to the vcpkg package manager as part of the 2025.01.13 registry release, 2025-01-11 tool release, as well as changes to vcpkg documentation throughout January. This release includes minor improvements and bug fixes. Some stats for this period: vcpkg changelog (2025.01.13 release) The following notable changes were made in January: Documentation changes There are no changes to vcpkg documentation this month. If you have any suggestions for our documentation, please submit an issue in our GitHub repo or see the box at the bottom of ...
What’s New in vcpkg (December 2024)
This blog post summarizes changes to the vcpkg package manager as part of the 2024.12.16 registry release, 2024-12-09 tool release, as well as changes to vcpkg documentation throughout December. This release includes a command line option to force vcpkg to use classic mode even if a manifest file is found along with bug fixes. Some stats for this period: vcpkg changelog (2024.12.16 release) The following notable changes were made in December: Documentation changes If you have any suggestions for our documentation, please submit an issue in our GitHub repo or ...
MSVC Compiler Language Updates in Visual Studio 2022 version 17.12
Introduction In alignment with the Visual Studio 2022 version 17.12 release, and based upon feedback received from the community, the MSVC compiler team would like to provide greater visibility into the C++ language-level fixes for customer-reported issues that made it into the release. This is similar to how the standard library team publishes regular changelogs (see VS 2022 17.12 for reference). The focus for Visual Studio 2022 version 17.12 is primarily to address bugs reported through Developer Community. C++23 Features: While our overall focus has been on fixing bugs reported via Developer Community, we i...
What’s New in vcpkg (November 2024)
This blog post summarizes changes to the vcpkg package manager as part of the 2024.11.16 registry release, 2024-11-12 tool release, as well as changes to vcpkg documentation throughout November. This release includes a command line option to force vcpkg to use classic mode even if a manifest file is found along with bug fixes. Some stats for this period: vcpkg changelog (2024.11.16 release) The following changes were made in November: Documentation changes If you have any suggestions for our documentation, please submit an issue in our GitHub repo or ...
Siemens Healthineers manages C++ libraries with vcpkg in an offline build environment
vcpkg is a free and open-source C/C++ package manager maintained by Microsoft and the C++ community that runs on Windows, macOS, and Linux. Over the years we have heard from companies using vcpkg to manage dependencies at enterprise-scale. For this blog post, I spoke to Shrey Chauhan, a Senior DevOps Engineer with Siemens Healthineers. Siemens Healthineers adopted vcpkg in late 2023 after a successful proof of concept. Their main motivation was to improve their versioning and overall dependency management for C++ libraries in their offline, air-gapped build environment. They also like vcpkg’s integration with ...
What’s New for C++ Developers in Visual Studio 2022 17.12
We are happy to announce that Visual Studio 2022 version 17.12 is now generally available! This post summarizes the new features you can find in this release for C++. You can download Visual Studio 2022 from the Visual Studio downloads page or upgrade your existing installation by following the Update Visual Studio Learn page. Standard Library and MSVC Compiler As always, you can find all the details about our STL work in the changelog on GitHub. Thanks to everyone who contributed changes for this release! On the conformance side, we have finished the implementation of C++23’s P2286R8 Formatting Ranges by im...
What’s New in vcpkg (October 2024)
This blog post summarizes changes to the vcpkg package manager as part of the 2024.10.21 registry release, 2024-10-18 tool release, as well as changes to vcpkg documentation throughout October. This release adds support for Azure universal packages as a binary caching provider and other minor improvements. CppCon Talk on Managing C++ Dependencies I also gave a talk at CppCon about 10 Problems Large Companies Have with Managing C++ Dependencies and How to Solve Them. Here is a video recording of the talk: In particular, I talked about several vcpkg features that can help: Some stats f...
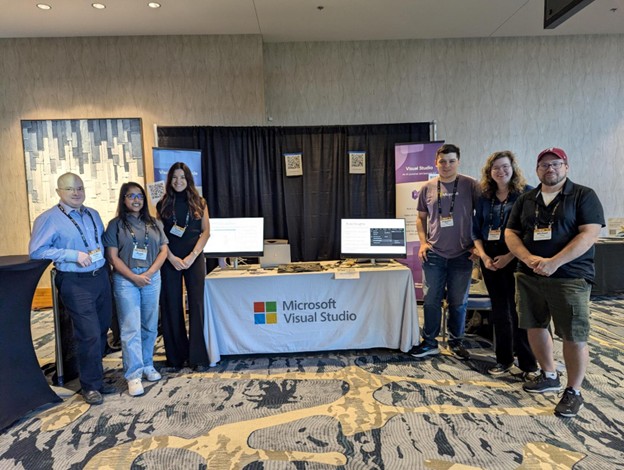
Microsoft C++ Team at CppCon 2024: Trip Report
The Microsoft C++ team attended CppCon, the largest C++ conference in the world. This year, the conference was held in Aurora, Colorado from September 16-20. Microsoft Booth Our team managed a booth from Monday to Thursday of the week. This gave us an amazing opportunity to interact with the C++ community and discuss many topics of interest as well as hear feedback from our customers. The following people worked at the booth (from left to right in the picture above): Microsoft works on several developer tools for C++, including the Visual Studio IDE, Visual Studio Code, the M...
Analyzing the Performance of the “Proxy” Library
This article analyzes the performance of the "Proxy" library in various scenarios, demonstrating its significant advantages in indirect invocations and lifetime management across different platforms.
Enhanced Breakpoint Expressions for C++ Debugging in Visual Studio

Conditional Breakpoints Performance Improvement Debugging C++ code can be a time-consuming process, especially when dealing with complex scenarios. As a developer, it's frustrating to go through extensive setup and wait for a specific conditional breakpoint to trigger so you can analyze your application in a specific state. In Visual Studio 2022 version 17.10, we optimized the implementation of conditional breakpoints in C++ to enhance performance. We further improved this in version 17.11 to boost performance even more. Key Improvements Conditional breakpoints in Visual Studio for C++ pause code execution w...
New Contextual Tools for GitHub Copilot in Visual Studio
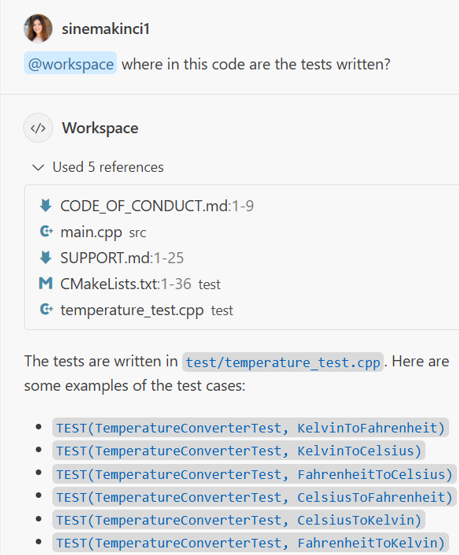
Visual Studio 2022 17.11 now allows you to pass your entire workspace or specific classes and functions as context for GitHub Copilot Chat. By referencing your entire codebase, down to specific classes and functions, Copilot Chat can deliver refined and accurate results tailored to your code. @workspace for project references You can now use GitHub Copilot Chat to refer to your entire C++ project using the @workspace command. This feature allows you to ask questions about your project, and GitHub Copilot will provide you with detailed responses. An example use case for the @workspace command in GitHub C...
What’s New in vcpkg (September 2024)
This blog post summarizes changes to the vcpkg package manager as part of the 2024.09.23 and 2024.09.30 releases, 2024-09-18 and 2024-09-30 tool releases, as well as changes to vcpkg documentation throughout September. This month’s release includes some minor changes and bug fixes, 18 new ports, and 319 updates to existing ports. When updating vcpkg, we recommend moving to the 2024.09.30 release, which fixes some regressions in the 2024.09.23 release. Some stats for this period: vcpkg changelog (2024.09.23 & 2024.09.30 releases) The following notable changes were made in Septem...
Configure GitHub Copilot Access via Content Exclusion
Have you ever wanted greater control over the sensitive content AI-powered tools can access in your repositories? You can now customize Copilot’s access to your files with the newly announced GitHub Copilot Content Exclusion in both Visual Studio and Visual Studio Code. Through this new process you can configure Copilot to ignore certain files in your repository – such as sensitive files or information - when generating responses. Once content has been excluded from Copilot: GitHub Copilot’s granular control over content exclusion gives you the flexibility to enact company-wide security po...
Latest enhancements to Copilot workflows in Visual Studio: Move seamlessly from Copilot in Quick Info and more…
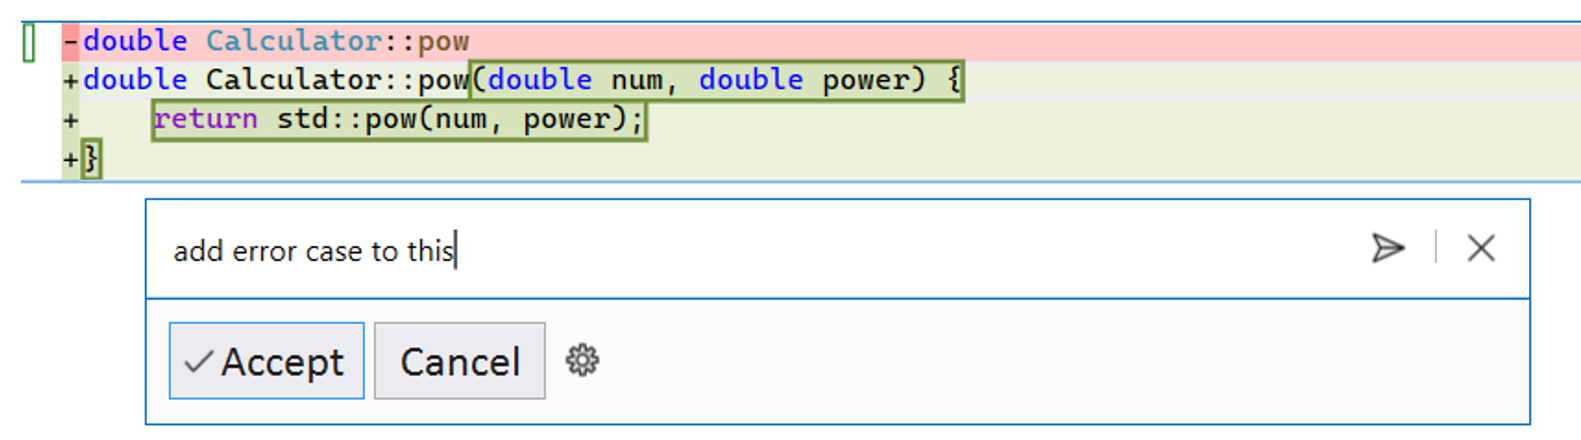
There have been new integrations added to Copilot workflows in Visual Studio to make it even more seamless to navigate between in-editor activities and the Chat window that has context of global workspace, conversational history, and more to get the most out of Copilot, wherever you are. With the latest updates, you can streamline your workflow with slight tweaks and follow-up questions, allowing Copilot to provide the most relevant set of suggestions for your workflows. These include enhancements to inline chat and code completions in 17.11 and Copilot in quick info in 17.12 Preview 1. Refine Completions...

Visual Studio at Unreal Fest Seattle 2024
Join us in-person at Unreal Fest Seattle 2024 with an in-depth look at how Visual Studio and GitHub Copilot can help modernize your Unreal Engine game development. Session Title: Modernizing Game Development with Visual Studio and AI Session Info: October 3rd, 2024, 2:00 PM-3:00 PM Pacific Time | Room 445 Abstract: Join Microsoft to learn how Visual Studio can speed up your iteration cycle from start to finish. Discover productivity tools for optimizing class structure memory layout; identify and rectify build issues with Build Insights integration; and explore performance enhancements. We'll also cover ...
Tailored Code Completions for C++ Developers: Fine-tuned models are now in limited public beta for GitHub Copilot Enterprise
GitHub recently announced that custom models are available for GitHub Copilot Enterprise users in limited public beta. Custom models are fine-tuned on your organization’s proprietary codebases and coding practices to provide more contextually relevant and consistent inline suggestions. How It Works: Security and Privacy in Custom Models The data used to train your organization’s custom model is never used to train another customer’s model, and your custom model is never shared. You can learn more about the fine-tuning process in GitHub’s announcement post and documentation. C and C++ Case Study: Microsoft Offi...
What’s New in Visual Studio Build Insights 17.12

We are excited to announce the latest Visual Studio 2022 17.12 Build Insights features. These updates provide developers with greater control and accuracy when diagnosing and optimizing C++ builds directly within Visual Studio. Download Visual Studio 2022 17.12 Preview We extend our thanks to the developer community, particularly our game studio partners, for providing invaluable feedback. Your input plays a vital role in shaping these new features. Learn more about Build Insights with our tutorials and documentation: Run Build Insights on Selected Files This feature is a game-c...
Microsoft C++ Team at CppCon 2024
As always our team will be at CppCon this year with a host of presentations. Many of us will also be present at our team’s booth in the main hall for the first four days of the conference. Come say hi and let us know if you have any questions about our talks, products, or anything else! You can also join the #visual_studio channel on the CppCon Discord to talk to us (note: to join, head to #directory channel first, and check the checkbox next to "Visual Studio" box). We’re also running a survey for attendees. If you have a moment, please take our survey. It's quick and you could win a duffel bag ...
Fix C++ warnings and errors with Copilot: Introducing AI-Assisted Code Fixes in Visual Studio
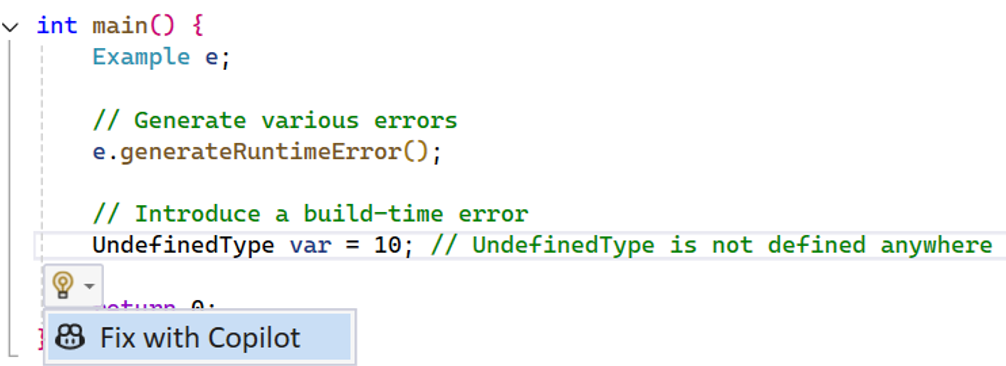
Stuck on an unfamiliar build error? Want to resolve your code errors quickly? Copilot is now integrated into Visual Studio error workflows to assist you with understanding and resolving C++ errors and warnings. To access this new feature, you will need an active Copilot subscription and the latest 17.11 GA version of Visual Studio. How does it work? There are two different entry points to accommodate where you are at in your error workflow: Semantically relevant code snippets from your active file and related files are automatically included as context to increase the relevant of the proposed fi...
Askia, an Ipsos company, achieved faster, reproducible builds with vcpkg
vcpkg is a free and open-source C/C++ package manager maintained by Microsoft and the C++ community that runs on Windows, macOS, and Linux. Over the years we have heard from companies using vcpkg to manage dependencies at enterprise-scale. In this interview, I spoke to Dimitri Rochette, a lead developer at Askia, an Ipsos company, about vcpkg’s impact on their team. After switching to vcpkg and CMake, Askia was able to reduce build times for their dependencies by using the vcpkg binary caching feature and reduce their code size by about 300,000 lines by eliminating project files, scripts, and copied depend...
What’s New in vcpkg (August 2024)
This blog post summarizes changes to the vcpkg package manager as part of the 2024.08.23 release, 2024-08-01 tool release, as well as changes to vcpkg documentation throughout August. This month’s release includes several notable changes as well as bug fixes and documentation improvements. The most notable changes were: Some stats for this period: Lastly, it’s CppCon season, and I am giving a talk on 10 Problems Large Companies Have with Managing C++ Dependencies and How to Solve Them on Tuesday, September 17, 2024, from 16:45-17:45 MDT. If you are coming to the conferenc...
MSVC Backend Updates in Visual Studio 2022 version 17.11

Visual Studio 2022 17.11 brings new optimizations, intrinsics, features, and improvements to the MSVC backend. Check out the highlights below: ...
Announcing the Proxy 3 Library for Dynamic Polymorphism
Next Generation Polymorphism in C++
Prevent Critical Bugs with MSVC Code Analysis
Imagine this: You’re deep into a complex C++ project, and everything seems to be running smoothly. But then, out of nowhere, a critical bug surfaces— one that requires a bit more foresight. We’ve all been there, right? This is where code analysis steps in as your silent guardian. Code analysis is a great tool for catching those elusive bugs and ensuring your code adheres to the best programming practices. It identifies defects that are difficult to discover through testing by searching for specific code patterns known to cause problems. The analysis results are displayed in the Visual Studio Error List ...
What’s New for C++ Developers in Visual Studio 2022 17.11
We are happy to announce that Visual Studio 2022 version 17.11 is now generally available! This post summarizes the new features you can find in this release for C++. You can download Visual Studio 2022 from the Visual Studio downloads page or upgrade your existing installation by following the Update Visual Studio Learn page. Standard Library We’re continuing to improve our open source standard library implementation. Thank you to everyone who has contributed features and fixes to this release! You can find the full set of changes at the STL changelog. Formatted Output We’ve made several advancements in our ...
GitHub Copilot Extensions for C++ developers and beyond now available in VS Code
GitHub Copilot is now more extensible than ever for extension authors in VS Code. At the Microsoft Build conference, we announced that VS Code extensions can now leverage APIs for Copilot to build custom chat participants that users can interact with in the GitHub Copilot Chat view in VS Code. To learn more, please watch the Build session on the new extensibility and read more on the VS Code blog. Some notable extensions that have developed chat participants for public consumption include Microsoft Dev Box and Parallels. Another API that extensions can leverage LLMs with is the language model API. It enabl...
What’s New in vcpkg (July 2024)
This blog post summarizes changes to the vcpkg package manager as part of the 2024.07.12 release, 2024-07-10 tool release, as well as changes to vcpkg documentation throughout July. This month’s release includes some minor changes to output, bug fixes, and documentation improvements. Some stats for this period: vcpkg changelog (2024.07.12 release) The following notable changes were made in this release: Documentation changes If you have any suggestions for our documentation, please submit an issue in...
MSVC Backend Updates in Visual Studio 2022 version 17.10
Visual Studio 2022 17.10 brings new optimizations, intrinsics, features, and improvements to the MSVC backend. Check out the highlights below: Do you want to experience the new improvements in the C++ backend? Please download the latest Visual Studio 2022 and give it a try! Any feedback is welcome. We can be reached via the comments below, Developer Community, X (@VisualC), or email at visualcpp@microsoft.com. Stay tuned for...
Genetec uses Visual Studio, CMake, vcpkg, and Docker for remote Linux C++ development
Over the past couple of months, the Microsoft C++ team reached out to a series of customers voting on a suggestion ticket asking for Remote Linux Unit Testing support to understand their full set of interactions and needs with CMake and remote Linux scenarios in Visual Studio. After these discussions, we built out a backlog of work items to deliver on any pain points in their experiences. One of the customers we interviewed and worked closely with during the process was Georg Zankl, a software developer for Genetec. Georg manages a project that uses dev containers and CMake. Our team helped Georg to bridge the...
Improving GitHub Copilot Completions in VS Code for C++ Developers
GitHub Copilot code completions are autocomplete-stye suggestions that appear inline as you code. Until today, they have used context from your active file and other tabs open in the editor to inform the suggestion that is returned. However, we know that more contextually relevant input leads to better suggestions. Our team has made changes to the C/C++ extension and the GitHub Copilot extension in VS Code to ensure that other relevant C++ context — like available types and methods — are also provided to Copilot completions. When you use the latest version of the C/C++ extension and the GitHub Copilot extensio...
What’s New in vcpkg (June 2024)
This blog post summarizes changes to the vcpkg package manager as part of the 2024.06.15 release, 2024-06-10 tool release, as well as changes to vcpkg documentation throughout June. This month’s release includes some error message improvements and bug fixes. Some stats for this period: vcpkg changelog (2024.06.15 release) The following meaningful changes were made in this release: Documentation changes If you have any suggestions for our documentation, please submit an issue in our GitHub repo or see the box at the ...

Understand your C++ symbols using Copilot in Visual Studio’s Quick Info
Navigating your codebase and forget what exactly that method does? Looking for quick, easy-to-digest information on your code at any point in your development journey? We are excited to announce that now when you hover over symbols in your codebase, you'll have the ability to invoke Copilot conveniently within the Quick Info dialog to learn more about a given symbol and enhance existing or lacking code documentation. How it works Normally, in the Quick info window, you would see comments or xml documentation if it was generated by your team in the code, which can sometimes be unrelated to what the given symb...

Bosch widely adopts Visual Studio 2022 after experiencing performance improvements for C++ Linux cross-compilation
Introduction The Bosch security camera team had been evaluating Visual Studio as a unified development setup for their team’s C++ development, which includes remote Linux C++ development for cross-compiling. While evaluating Visual Studio 2022, the team had a positive experience of using Visual Studio for their C++ development due to notable improvements over the years. Specifically, compared to their experience with Visual Studio 2019, they noticed improvements such as: In Visual Studio 2022, they migrated their project from CMake settings to CMake presets to improve portability between Vi...
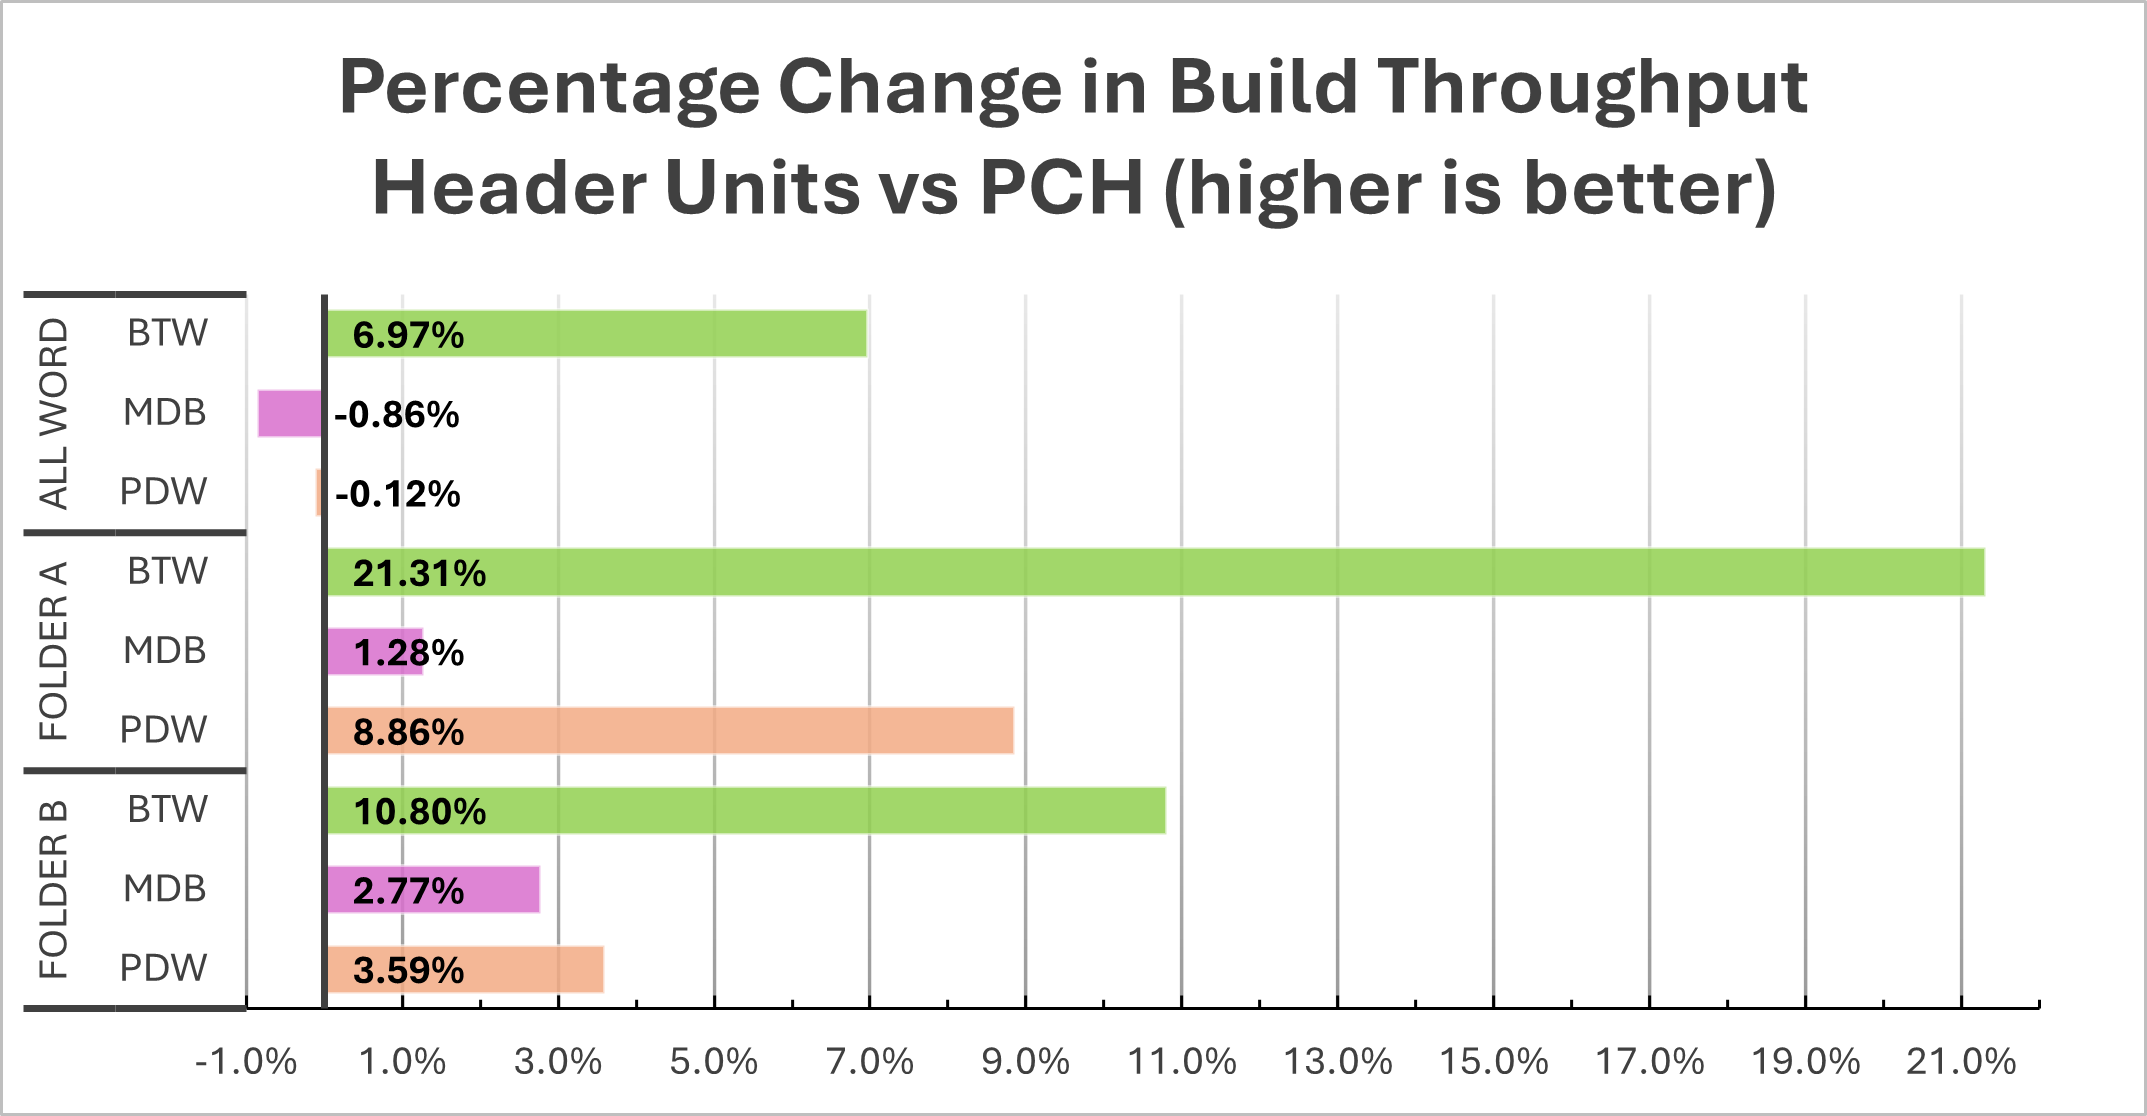
Integrating C++ header units into Office using MSVC (3/n)

Overview Introduction In our previous two (part 1, part 2) blog posts we discussed how Office was thinking holistically about header units. In this installment we’d like to share the concrete steps taken to integrate header units into the build of Microsoft Word, and their effect on build throughput. Throughout the post we'll use the term "build throughput" as opposed to "build performance" to avoid potential confusion with application runtime performance. This blog is primarily a recap of the presentation that Zachary gave at Pure Virtual C++ 2024. Remember that precompiled h...
What’s New in vcpkg (May 2024): Dedicated Pages for Each Package on vcpkg.io
This blog post summarizes changes to the vcpkg package manager as part of the 2024.05.24 release as well as changes to vcpkg documentation throughout May. This month’s update also includes individual pages for each package on the vcpkg website as well as several new documentation articles. Some stats for this period: There was no update this month to the vcpkg tool binary itself. However, we have made an important update to our website, vcpkg.io. Individual pages for each port Each one of the 2,434 ports available in the vcpkg open-source registry now has a dedicated page o...
C++ Refactoring tools in Visual Studio
Code refactoring is the process of restructuring existing code, while its outward functionality remains unchanged. By refactoring, you can simplify complex code structures, reduce code redundancy, and enhance code reusability. Visual Studio offers many tools to help refactor your C++ code. This article will delve into these tools, using the bullet3 open-source code as an example. Rename The renaming tool is useful when changing a symbol name that appears in multiple locations within your code. Manual renaming can lead to errors if one or more instances of your function or variable are overlooked. However, the...
Visual Studio Code CMake Tools Extension 1.18 Update: Quick Start with CMake and more…
The May release of CMake Tools in VS Code is now available. With this release, we have some new updates to the extension to improve CMake integrations with the extension's support. Some major highlights include improvements to the CMake: Quick Start command and support for CMake presets v7 and v8. To view the full list of updates with this release, please look at our CHANGELOG. This release features 2 contributions from our open-source community (@OrkunTokdemir and @hippo91). We greatly appreciate your continued support! CMake: Quick Start Updates The CMake: Quick Start command is a command that assists u...
What’s New for C++ Developers in Visual Studio 2022 17.10
We are happy to announce that Visual Studio 2022 version 17.10 is now generally available! This post summarizes the new features you can find in this release for C++. You can download Visual Studio 2022 from the Visual Studio downloads page or upgrade your existing installation by following the Update Visual Studio Learn page. Standard Library and Compiler We have incremented the minor version number of the MSVC toolset from 19.39 (VS 2022 v17.9) to 19.40 (VS 2022 v17.10). For more details, and some ways in which this will affect projects that assume that MSVC versions are all 19.3X for Visual Studio 2022 relea...
C++ at VS Code Day 2024
Looking to get caught up on new C++ features released in the last year? Check out the new YouTube video What’s New with C++ in VS Code posted for VS Code Day 2024. VS Code Day is an annual event hosted by the VS Code team which lets you elevate your development workflow with the latest and greatest features from Visual Studio Code. Sessions ranged from Generating Synthetic Datasets with GitHub Copilot to Real World Development with VS Code and C#. The What’s New with C++ session covered updates to the C++ extension, CMake Tools extension, and tips on how you can leverage GitHub Copilot when developing a C++ pr...
Use AI-Powered Rename Suggestions to rename your C++ variables in Visual Studio
We are very excited to announce C++ support for AI-Powered Rename Suggestions from GitHub Copilot in Visual Studio 2022. Seamlessly integrated into your familiar Rename workflow in the IDE, AI-powered rename suggestions dynamically generate name suggestions for any C++ identifier. It will generate proposed names based on its usage and your code's style to help you strike a balance between describing the variable with appropriate descriptive qualities while remaining concise. Instead of spending time brainstorming new names, you can focus on reviewing the variable names generated by Copilot to determine the approp...

Pure Virtual C++ 2024 Recordings Now Available
All recordings for our Pure Virtual C++ 2024 conference are now available. Thanks to everyone who came along and hope to see you again next year! You can find the full playlist on YouTube. Main Sessions Automated Test of Shader Code - Keith Stockdale Message Handling with Boolean Implication - Ben Deane I Embedded a Programming Language in Debug Information - Sy Brand Enhancing C++ Development with Copilot Chat - Sinem Akinci Progress Report: Adopting Header Units in Microsoft Word - Zachary Henkel Pre-conference Content ...
Building your C++ Code with CMake in VS Code
Build systems can help you manage your C++ project as it grows in scope and complexity, whether you are adding new features, dependencies, or cross-platform support. A popular choice in the C++ community is CMake which supports cross-platform development, streamlines build processes and configurations, and has many levels of customization. It also has first class support both in Visual Studio and in VS Code via the CMake Tools extension. Check out our recent video on the steps you need to take to install and configure CMake in VS Code: This video walks you through every step of the process: ...
What’s New in vcpkg (April 2024)
What’s New in vcpkg (April 2024) This blog post summarizes changes to the vcpkg package manager as part of the 2024.04.26 release as well as changes to vcpkg documentation throughout April. This month’s vcpkg release includes improvements for visually generated dependency graphs, a new triplet variable for tweaking what files are considered by the ABI hashing algorithm, several changes to our documentation, and some performance and bug fixes. Some stats for this period: An overview of vcpkg in 10 minutes For the Pure Virtual C++ conference this year, I gave an overview of v...
New Checks Since Visual Studio 2022 17.8

The C++ team is committed to making your C++ coding experience as safe as possible. In the last couple of releases, we added new safety checks based on the requests of internal customers like the Windows group. Below is the overview of the new checks. For additional information for each of the checks, please refer to the linked help documents. C6395: Helping migration to C++17 and above Consider the following snippet: The meaning of the code depends on the order in which we evaluate the subexpressions. In case we evaluate the left-hand side of the assignment first, the code stores the incremented value of i ...
OpenMP improvements in Visual Studio C/C++ compiler: triangular loop collapse

Our previous blog post about OpenMP support in Visual Studio announced support for the loop feature in version 17.8. In the meantime, we have continued working on improving the feature and, in Visual Studio 2022 17.10, we have added a new, more efficient algorithm for partitioning work of certain types of collapsed triangular loops supported by the OpenMP Standard 5.2. All this work continues to be accessible if you are using the switch (see the Improved OpenMP Support for C++ in Visual Studio blogpost for details about this switch). In this blog we will describe this algorithm in some detail: Triangular ...
Pure Virtual C++ 2024 is Now Live!
Pure Virtual C++, our free one-day virtual conference for the whole C++ community, is now live! Check it out on YouTube: The sessions are:
Pure Virtual C++ 2024 is Tomorrow
Pure Virtual C++ is our free one-day virtual conference for the whole C++ community. This year it will run on April 30th 15:00 UTC. Sign-up for free to get access to our five sessions on the day. The sessions are: We've added a host of new pre-conference content which you can check out in the meantime. In the last week we've released:
Usability Improvements in the Visual Studio Connection Manager

In Visual Studio 2022 17.10 Preview 2, we’ve introduced some UX updates and usability improvements to the Connection Manager. With these updates we provide a more seamless experience when connecting to remote systems and/or debugging failed connections. Please install the latest Preview to try it out. Read on to learn what the Connection Manager does, and which issues that we resolved. What is the Connection Manager? The Connection Manager is a tool in Visual Studio that allows users to manage and store SSH connections to remote systems. You can add new connections, edit existing connections, and set the defa...
Visual Studio features for C++ Header Files and Modules
In the field of C++ programming, the management of header files and modules can often seem challenging. However, there are numerous tools and features available that can simplify this process, enhancing efficiency and reducing the likelihood of errors. Here’s a walkthrough for several tools that we provide for C++ headers and modules. Run Build Insights Start by running Build Insights, through navigating to Build > Run Build Insights. This tool provides insights into the Include File and Include Tree views to analyze and optimize your #include usage. For instance, in the bullet3 sample repository, run...
Pure Virtual C++ Pre-Conference Videos – Linux Development, Modules, Containers and more!
Pure Virtual C++ is our free one-day virtual conference for the whole C++ community. This year it will run on April 30th 15:00 UTC. Sign-up for free to get access to our five sessions on the day. Half of the pre-conference content for the conference is now available. We have videos on a host of topics: Keep your eye out for more in the run up to the conference!
VS Code C++ Extension 1.19 Release: 3.6x faster Go To Symbol & 1.5x faster colorization
With our recent 1.19 release, performance was our biggest focus for the C++ Extension in Visual Studio Code. This included features like progressive population of IntelliSense results and faster symbol searching. With these enhancements, you can begin writing C++ code when opening a file quicker than ever before. Additionally, we also added support for fuzzy results when searching for symbols. Faster Go To Symbol Search Searching for symbols using the “Go to Symbol in Workspace” command now uses a new algorithm which returns relevant results in a fraction of the time it took previously. This new algorith...
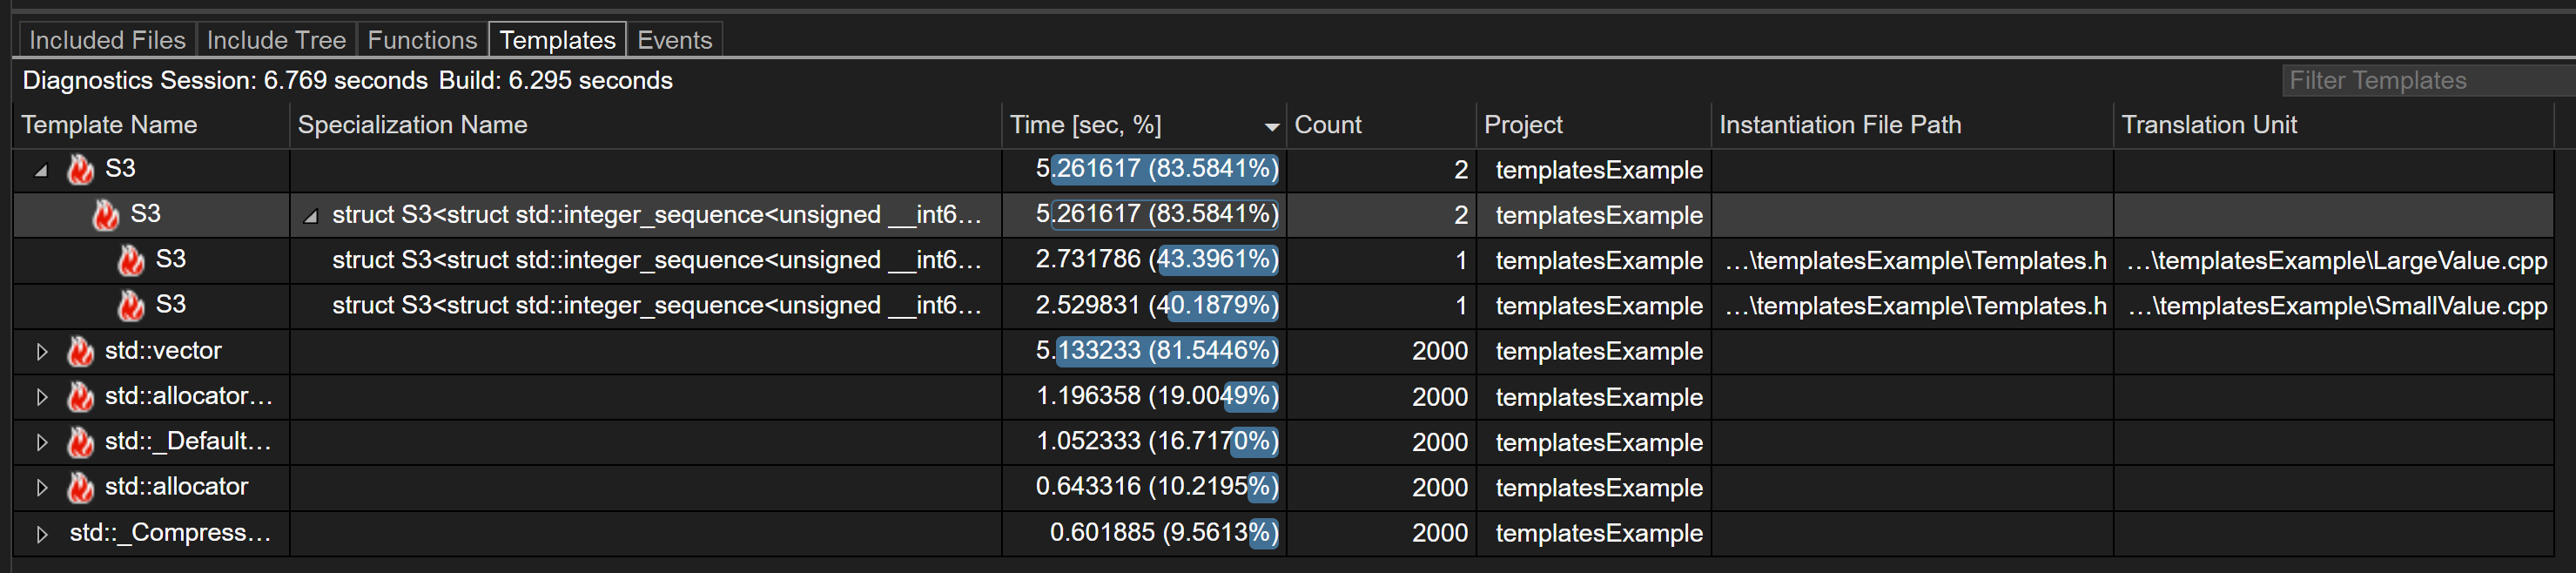
Templates View for Build Insights in Visual Studio


Introduction Introducing the new Templates View feature of Build Insights! Templates View now allows you to capture data about how templates in your codebase are contributing to your build time. This feature is available in Visual Studio 2022 17.10 and later. Download Visual Studio 2022 Getting Started with Templates View To use Build Insights in Visual Studio you will need to ensure you’ve installed the “C++ Build Insights” component. This is installed by default if you’ve installed either the “Desktop development with C++” or “Game development with C++” workloads. By default, Templates View is tur...
MSVC Address Sanitizer adoption in .NET’s CoreCLR
Collaboration to improve the reliability and security of .NET, from the perspective of an MSVC Address Sanitizer Developer Introduction .NET (on GitHub) is a cross-platform, open-source, and general-purpose development platform with widespread adoption. A core component of .NET is the Core Common Language Runtime (CoreCLR), which provides services such as memory management, exception handling, threading, and interoperability with native code. It is used by millions of developers across multiple platforms, including Windows, Linux, and Mac OSx. The CoreCLR is implemented in native code, C and C++, and is a co...
Time Travel Debugging team uses Copilot Chat for C++
Ken Sykes and Juan Carlos Arevalo Baeza (JCAB) are both Principal Software Engineers who work on the Time Travel Debugging team at Microsoft, which is the team that maintains and develops the Windows Debugger (WinDbg) and related technologies. Their codebase is developed with C++ and CMake, and they primarily use Visual Studio Code for developing their code. They have been integrating GitHub Copilot and GitHub Copilot Chat into their C++ development in VS Code and have found many useful workflows for the AI pair programmer. This blog post series has been written in partnership with Ken and JCAB to highlight...
How Copilot is being used by the Time Travel Debugging team for repetitive C++ coding
Background Ken Sykes and Juan Carlos Arevalo Baeza (JCAB) are both Principal Software Engineers who work on Time Travel Debugging at Microsoft. They are part of the team that maintains and develops the Windows Debugger (WinDbg) and related technologies. Their codebase is developed with C++ and CMake and they primarily use VS Code for day-to-day development of their code. They have been integrating GitHub Copilot and GitHub Copilot Chat into their C++ development in VS Code and have found many useful workflows for the AI pair programming tool. Download GitHub Copilot To access GitHub Copilot and Copi...
Pure Virtual C++ 2024 Sessions Announced
Pure Virtual C++ is our free one-day virtual conference for the whole C++ community. This year it will run on April 30th 15:00 UTC. Sign-up for free to get access to our five sessions on the day and a host of pre-conference content. Here is the list of sessions:
What’s New in vcpkg (March 2024)
This blog post summarizes changes to the vcpkg package manager as part of the 2024.03.19 and 2024.03.25 releases as well as changes to vcpkg documentation throughout March. This month’s vcpkg release includes an arm64ec platform expression, more flexibility when mixing static and dynamic libraries, diagnostics improvements, a change in the binary caching ABI calculation, and bug fixes. Some stats for this period: vcpkg changelog (2024.03.19 + 2024.03.25 releases) Several improvements to diagnostics output. For example: Bug fixes: ...
Improvements in Variable Visibility when Debugging

In Visual Studio 2022 17.10 Preview 2, we’re including a small quality-of-life improvement that results in the Watch/Locals window displaying local variables correctly for any arbitrary frames in the call stack in debug builds. To try it out, please install the recently released Preview. For more information, read on. The problem: missing variables in Watch Window Have you ever been in this situation? We’re debugging some code, and have a breakpoint we hit in a function, foo. We need to inspect the values of some local variables a bit up the call stack, so we open up the call stack window and click to that f...
Sign Up for the free Pure Virtual C++ 2024 Conference
Every year we run Pure Virtual C++: a free one-day virtual conference for the whole C++ community. Next month we’re doing it again! Sign-up for free to get access to our five live sessions and a host of pre-conference content. The live event will start at April 30th 15:00 UTC. Videos will be available to stream for free on YouTube after the conference. The speakers and topics will be announced soon. Hope to see you there!
Using Copilot Chat with C++ in VS Code
If you are a C++ developer who uses VS Code as your editor, Copilot Chat can help you with many of your everyday coding tasks by allowing you to iterate with your code in natural language. Download GitHub Copilot Chat To access GitHub Copilot and Copilot Chat, you will need an active subscription to GitHub Copilot. Chat features are available by installing the GitHub Copilot Chat extension for VS Code. If you’re just getting started, please check out the VS Code documentation. We have just released a new YouTube video demonstrating the power of Copilot Chat in C++ code: We cover how Copilot Chat c...
What’s New in vcpkg (February 2024)
This blog post summarizes changes to the vcpkg package manager as part of the 2024.02.14 release and changes to vcpkg documentation throughout February. This month’s vcpkg release was mainly minor bug fixes, while several new documentation articles were added. Some stats for this period: vcpkg changelog (2024.02.24 release) Documentation changes If you have any suggestions for our documentation, please submit an issue in our GitHub repo or use the button “This page” at the bottom of a particular article. ...
MSVC Backend Updates since Visual Studio 2022 version 17.3

Since Visual Studio 2022 version 17.3, we have continued to improve the C++ backend with new features, improved support for arm64 and OpenMP, and new and improved optimizations across all architectures.
What’s New for C++ Developers in Visual Studio 2022 17.9
We are happy to announce that Visual Studio 2022 version 17.9 is now generally available! This post summarizes the new features you can find in this release for C++. You can download Visual Studio 2022 from the Visual Studio downloads page or upgrade your existing installation by following the Update Visual Studio Learn page. Standard Library We're continuing to improve our open source standard library implementation. Thank you to everyone who has contributed features and fixes to this release! You can find the full set of changes at the STL changelog. The main conformance highlight for this release is the i...
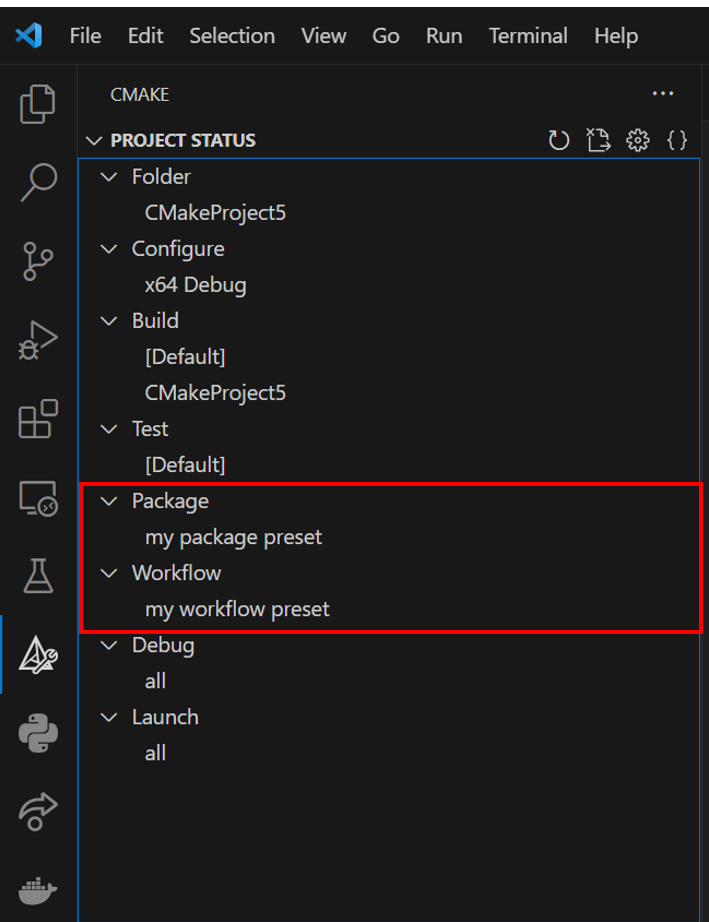
Visual Studio Code CMake Tools Extension 1.17 Update: CMake Presets v6, Overriding Cache Variables, and Side Bar Updates
The February release of the CMake Tools extension in VS Code is now available. With this release, we have three major new updates to the extension, including some of our highly upvoted requests: To view the full list of updates with this release, please look at our CHANGELOG. This release features 2 contributions from our open-source community, and we greatly thank you for your support! CMake Presets v6 Support Kitware has added two new CMake Presets in version 6: workflow and package presets. Workflow presets allow you to define a string of CMake presets that you want to execute (e.g. a confi...
A Year of C++ Improvements in Visual Studio, VS Code, and vcpkg
As we enter the new year, it’s a good time to look back at all the features and improvements we made for C++ developers in our tools in 2023. We’ve made advancements across Visual Studio, Visual Studio Code, our toolchain, and the vcpkg package manager in both performance and functionality. Some particular areas of focus have been ARM64 support, Unreal Engine development, code safety, and cross-platform development. Contents Visual Studio Cross-Platform Cross-platform development is a first-class citizen in Visual Studio and has been for many years now. We’ve added many new features for those targeting Linu...
OpenMP improvements in Visual Studio C/C++ compiler: loop collapse

The MSVC compiler adds support for OpenMP "collapse" feature on for loops.
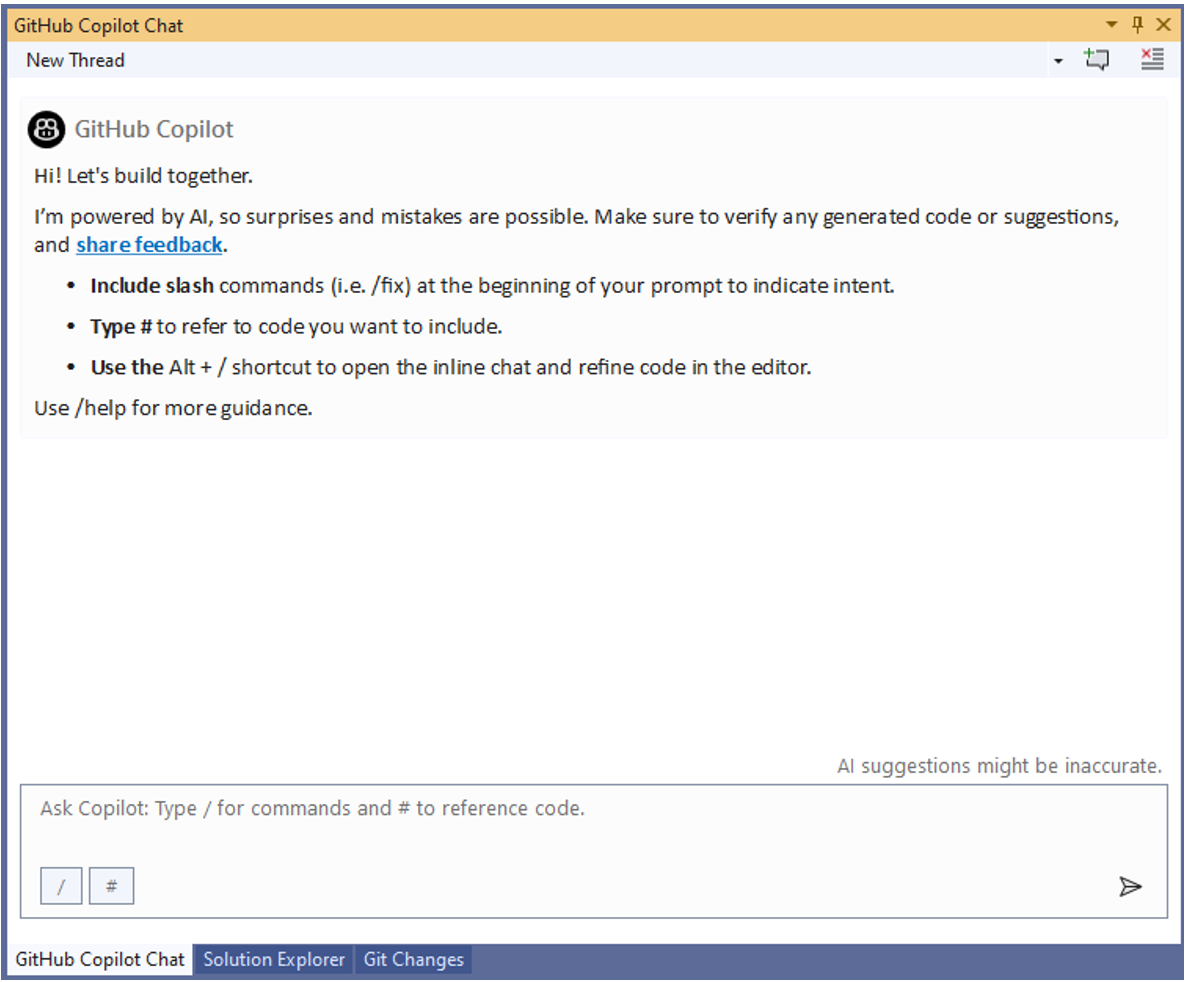
Quick Tips for using Copilot Chat with C++ in Visual Studio
GitHub Copilot Chat is now available in both Visual Studio and Visual Studio Code when you have an active subscription to the service. Copilot Chat is your AI pair-programmer that allows you to speak in plain text through the chat interface to accomplish programming tasks such as understanding sections of code, generating test cases, and generating code. This blog post will focus on tips for using Copilot Chat functionality with C++ in Visual Studio, but the same functionality is available in Visual Studio Code and will be covered in future blog posts. Additionally, in future posts, we will dive into various C...
MSVC Toolset Minor Version Number 14.40 in VS 2022 v17.10
As we approach delivery of Visual Studio 2022 v17.9, the MSVC toolset version is 14.39. In Visual Studio 2022 version 17.10, the MSVC Toolset minor version will continue with 14.40 and continue incrementing in the ‘14.4x’ series. The file version and directories in Visual Studio v17.10 and subsequent installations will appear as follows: [VSInstallDir]\VC\Tools\MSVC\14.4x.BBBBB Where: We will make separate announcements about MSVC compiler toolset versions beyond 14.4x (i.e., versions >= 14.50) at an appropriate time in the future. Build System and Library Impact In Visual Studio 2022 ...
Testing the MSVC Compiler Backend
This post provides a behind-the-scenes look at how we test MSVC's backend, which is responsible for optimization and code generation. Many people worldwide use our compiler and expect it to provide a high-quality experience in terms of correctness (compiled code behaves as written), performance (speed of the compiled code), and throughput (speed of the compiler itself). By sharing with you how we test, you will better understand the level of quality control that goes into producing the compiler that you use. This topic may bring to mind a compiler bug that you have encountered in the past or are presently e...
What’s New in vcpkg (January 2024)
This blog post summarizes changes to the vcpkg package manager as part of the 2024.01.12 release and changes to vcpkg documentation throughout January. This month’s vcpkg release was mainly minor bug fixes, while several new documentation articles were added. Some stats for this period: vcpkg changelog (2024.01.12 release) Documentation changes If you have any suggestions for our documentation, feel free to submit an issue in our GitHub repo. You can also leave feedback for existing articles by using the Feedback button ...
C++ in VS Code: Getting Started & Configuring IntelliSense
Ever wondered how you can configure IntelliSense in the C++ Extension in Visual Studio Code? Or the easiest way to run your C++ code? With the new features added to the C++ extension, configuring IntelliSense and setting up a project is easier than ever. This includes a “Getting Started with C++” walkthrough, configure IntelliSense indicator, and the language status bar. "Getting Started with C++" Walkthrough With the C++ Extension for VS Code installed, the new Getting Started walkthrough helps you set up your environment and will have you running your C++ code in no time. Invoke it by running the...
MSVC ARM64 optimizations in Visual Studio 2022 17.8


Visual Studio 2022 17.8 has been released recently (download it here). While there is already a blog “Visual Studio 17.8 now available!” covering new features and improvements, we would like to share more information with you about what is new for the MSVC ARM64 backend in this blog. In the last couple of months, we have been improving code-generation for the auto-vectorizer so that it can generate Neon instructions for more cases. Also, we have optimized instruction selection for a few scalar code-generation scenarios, for example short circuit evaluation, comparison against immediate, and smarter immediate spli...
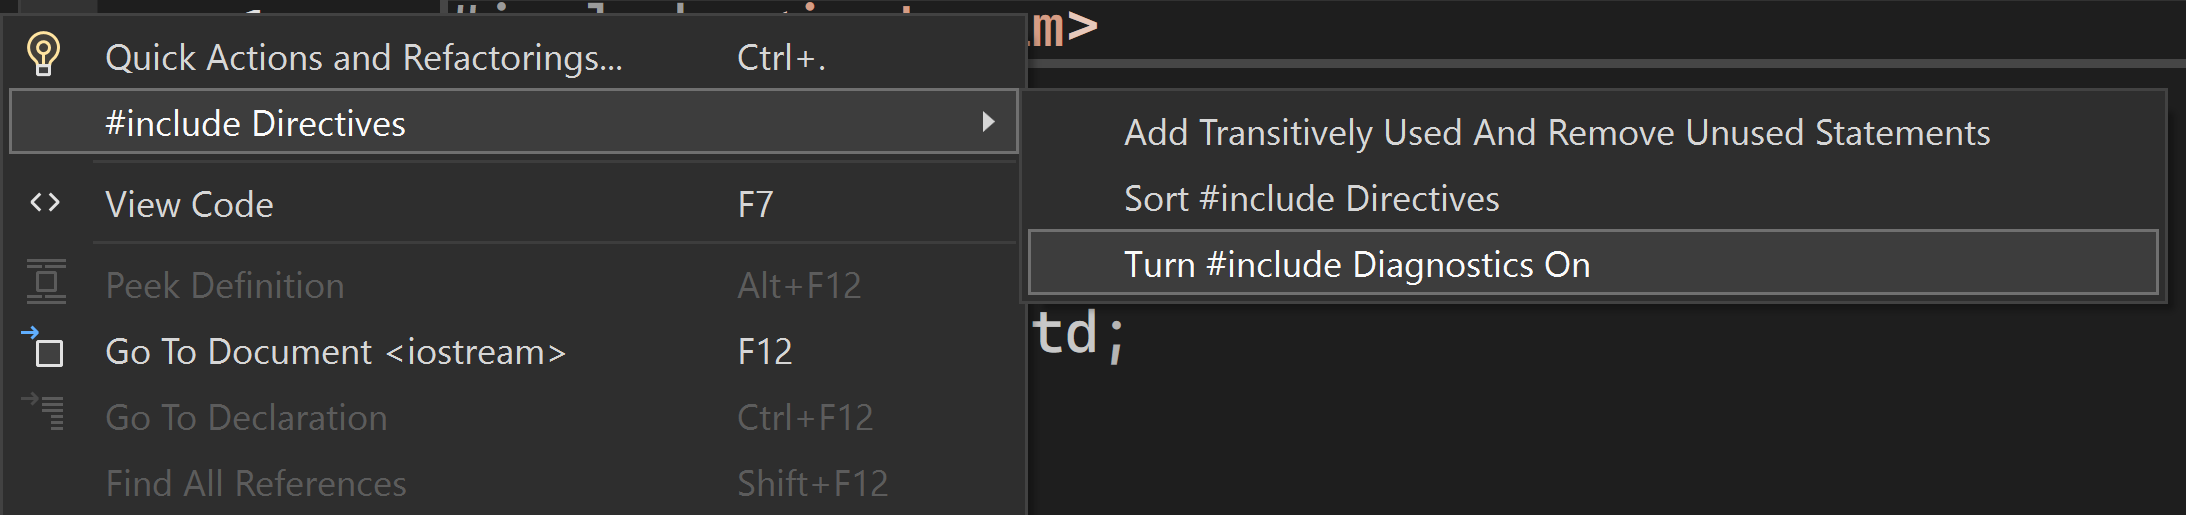
#include Diagnostics in Visual Studio
We’re excited to announce that the #include Diagnostics feature is now available in Visual Studio 2022 17.9 Preview 2. This new feature allows you to better understand the behavior of #include directives by providing detailed information on each directive’s references and build time. To begin utilizing this feature, activate #include diagnostics by performing a right-click in your editor to display the context menu. Then, navigate to the ‘Include Directives’ option and choose ‘Enable #include Diagnostics’. #include References The feature in Visual Studio allows you to analyze the usage of #include...
What’s New in the vcpkg 2023.12.12 Release
The 2023.12.12 release of the vcpkg package manager is available. This blog post summarizes changes from November 21st, 2023 to December 12th, 2023 for the Microsoft/vcpkg, Microsoft/vcpkg-tool, and Microsoft/vcpkg-docs GitHub repos. Some stats for this period: Feature changes Bug fixes Documentation changes Total ports available for tested triplets While vcpkg supports a much larger variety of target platforms and architectures, the list above is validated exhaustively to ensure updated ports don’t break...

What’s New for Makefile Tools in Visual Studio Code Release 0.8: Post-Configure Scripts and more…
The latest version 0.8 of Makefile Tools in Visual Studio Code has shipped and is now available. This release includes two new features: a setting to support adding post-configure scripts and settings to add argument support to parse into your pre- and post-configure scripts. This release also features several bug fixes and improvements, including one from our open-source community. Thank you all for your contributions to this extension! Post-Configure Scripts In your Visual Studio Code settings, you can now specify a post-configure script to run after your Makefile configure step. Once a post config...
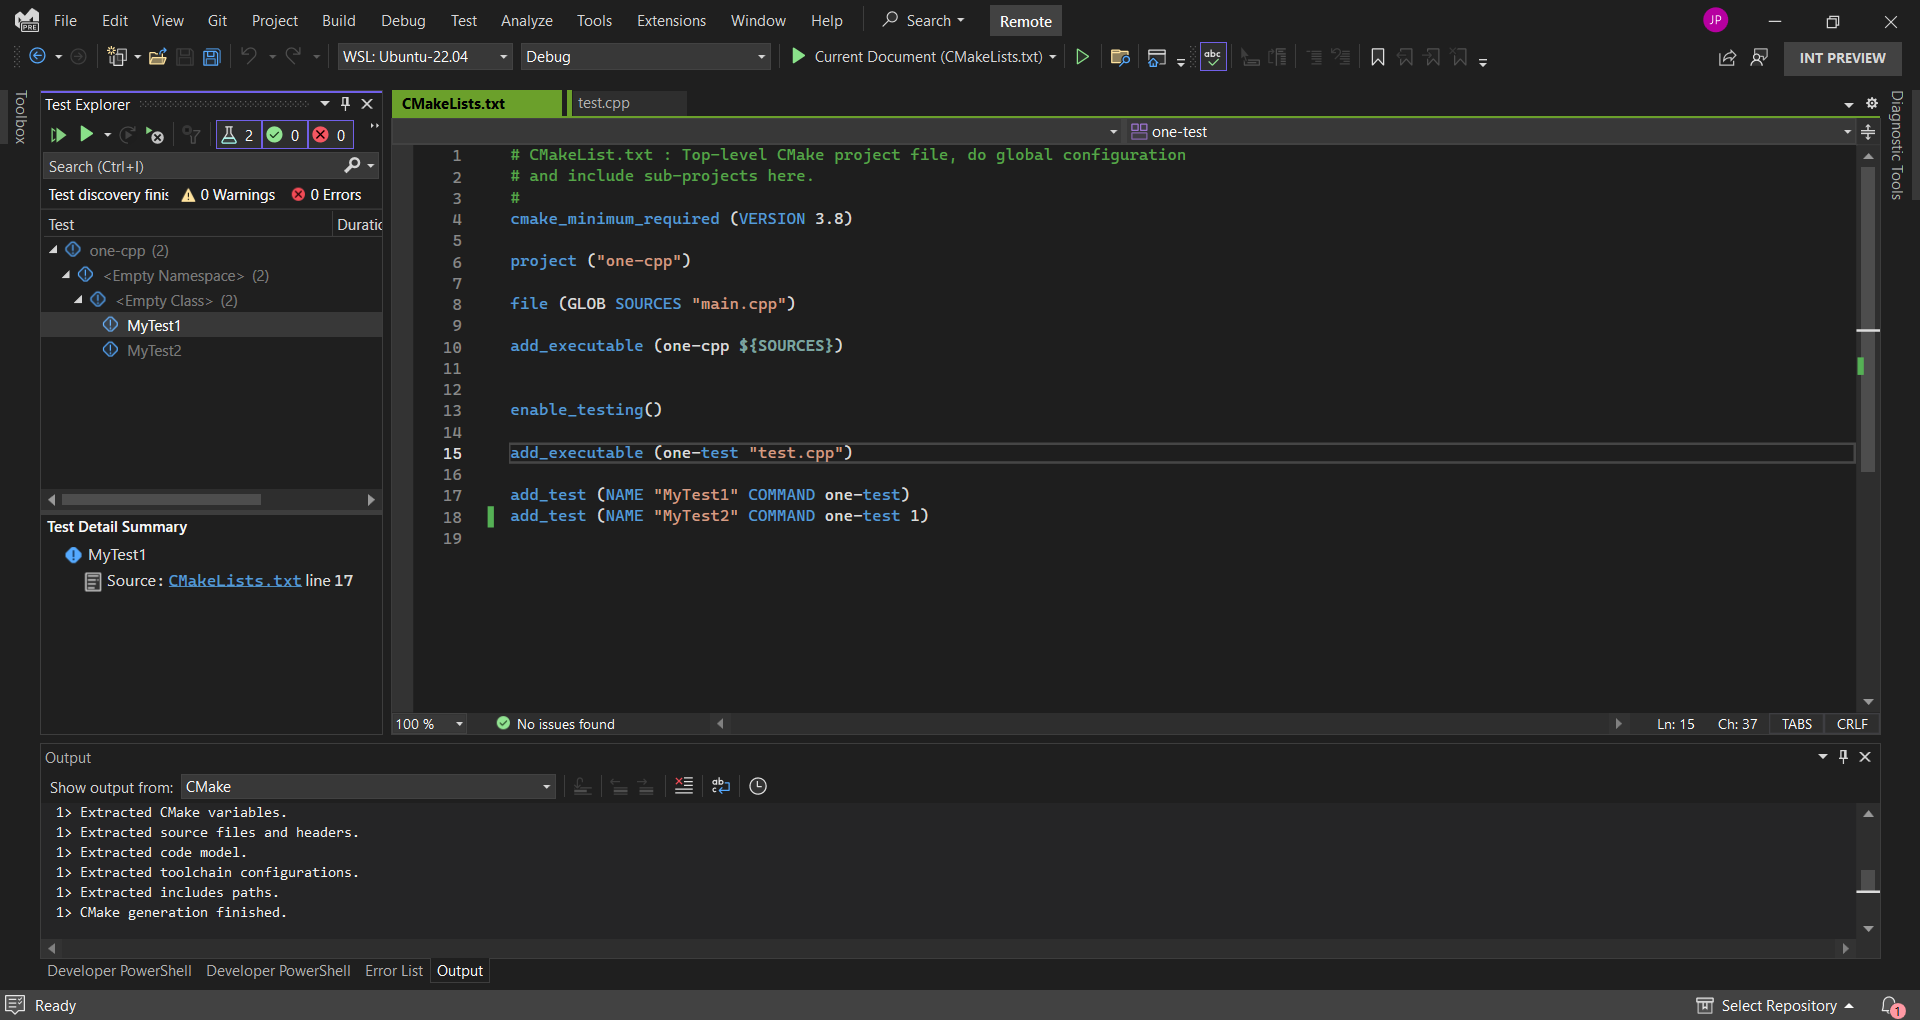
Azure Networking Team reaches peak productivity with Visual Studio’s new remote Linux capabilities and improvements
Over the past couple of months, the Microsoft C++ team reached out to a series of customers voting on a suggestion ticket asking for Remote Linux Unit Testing support to better understand their full set of interactions and needs with CMake and Remote Linux scenarios in Visual Studio. After these discussions, we built out a backlog of work items to deliver on any pain points in their experiences. One of the customers we interviewed and worked closely with during the process was John Schultz, an Azure Networking software engineer. Our team helped John not only to be able to F5 run his CTest unit tests for Linux,...

Directly Edit Unreal Engine Projects in Visual Studio 2022
Introduction We are excited to announce that Visual Studio 2022 version 17.9 Preview 2 offers direct support for Unreal Engine projects. We would like to give a special thank you to the folks at Epic Games. Our on-going collaboration made this feature possible. In addition, this feature relies on the latest features of Unreal Engine 5.4. You will no longer need to generate a Visual Studio solution. Currently, whenever you are working with Unreal Engine projects in Visual Studio, you must generate a Visual Studio solution from within the Unreal Editor or using the Unreal Build Tool (UBT). However, this pro...
What’s New in the vcpkg 2023.11.20 Release
The 2023.11.20 release of the vcpkg package manager is available. This blog post summarizes changes from October 19th, 2023 to November 19th, 2023 for the Microsoft/vcpkg, Microsoft/vcpkg-tool, and Microsoft/vcpkg-docs GitHub repos. Some stats for this period: Key changes This vcpkg update includes some bugfixes, documentation improvements, as well as a new community triplet. Notable changes for this release are summarized below. Added mips64-linux community triplet A community contributor has added a mips64-linux community triplet. MIPS stands for Microprocessor w...
Functions View for Build Insights in Visual Studio 2022 17.8
Introduction We are excited to unveil a new feature in Build Insights for Visual Studio: Functions View! This feature is available in Visual Studio 2022 version 17.8. Functions View offers essential insights into functions and forceinlines within your codebases. Download Visual Studio 2022 17.8 We extend our sincere thanks thanks to the developer community, especially our game studio partners, for actively providing feedback. Your contributions are invaluable in shaping this new feature. For more details about Build Insights and to explore other features like Included Files and Include Tree Views, pleas...
Debug vcpkg portfiles in CMake script mode with Visual Studio Code

We recently announced support for debugging the CMake language using the VS Code CMake Tools extension. Now in version 1.16 of the extension, you can fine-tune the debugger configuration using a launch.json file. This enables debugging in CMake script mode in addition to the existing debugging of CMake project generation. CMake script mode is an alternative way of running CMake that does not generate a build system, but instead uses the CMake language as a general-purpose scripting language. While script mode is not widely used (although there are fun esoteric examples), it is the mechanism that powers vcpkg ...
C++ Extension in VS Code 1.18 Release: Quick Fixes for missing header files, Extract to Function & More
The 1.18 version of the C++ Extension in Visual Studio Code has been released. With this version of the extension, we have added several new features such as: For the full list of changes, please reference the 1.18 release notes. Quick Fixes for missing header files Have you ever written C++ code and forgotten to add the right header? Gotten frustrated because of an IntelliSense error that turns out to just be a missing header file? We have now added a quick fix suggestion (lightbulb) to make the process of adding the correct header files to C++ files easier. If there is an unknown symb...
Visual Studio Code CMake Tools Extension 1.16 Update: New CMake Tools Sidebar and CMake Debugging options
The November release of the CMake Tools extension in VS Code is now available. With this release, we have two major new updates to the extension: The full list of updates can be seen in our change log. This release features 10 contributions from the open-source community. Thank you all for your continued support! Release Schedule Updates Starting with this November release, CMake Tools will now release every 3 months. You can learn more about our release schedules on our release schedule wiki. Updates to the default CMake Tools UI Starting in this 1.16 release, the default CMake Tools status b...

Unreal Engine and C++ Game Development Made Easy with Visual Studio 2022
Introduction Creating amazing games just got easier. We are very happy to announce the latest Unreal Engine integrations and powerful C++ productivity features in Visual Studio 2022. Our team has been tirelessly working to incorporate your feedback and bring even more features that will enhance your game development experience whether you work on Unreal Engine or a proprietary engine. In this blog, we will explore how you can leverage the new Unreal Engine Test Adapter, which helps to streamline your testing process without leaving the IDE. Then, we will also show you how you can code faster with Unreal E...
What’s New for C++ Developers in Visual Studio 2022 17.8
We are happy to announce that Visual Studio 2022 version 17.8 is now generally available! This post summarizes the new features you can find in this release for C++. You can download Visual Studio 2022 from the Visual Studio downloads page or upgrade your existing installation by following the Update Visual Studio Learn page. Standard Library The Standard Library Modules standardized in C++23 are now available in C++20 mode. This is a cross-vendor extension, planned or supported also by libstdc++ and libc++. We have also implemented several new C++23 and C++26 features, including augmented support for Freest...
vcpkg 2023.10.19 Release: Export for Manifests, Documentation Improvements, and More…
The 2023.10.19 release of the vcpkg package manager is available. This blog post summarizes changes from August 10th, 2023 to October 19th, 2023 for the Microsoft/vcpkg, Microsoft/vcpkg-tool, and Microsoft/vcpkg-docs GitHub repos. Some stats for this period: Key changes Notable changes for this release are summarized below. vcpkg export now supports manifest mode The vcpkg export command can be used to export built packages from the installed directory to a standalone SDK. A variety of formats are supported, including NuGet, a zip, or a raw directory. The SDK contains all pr...
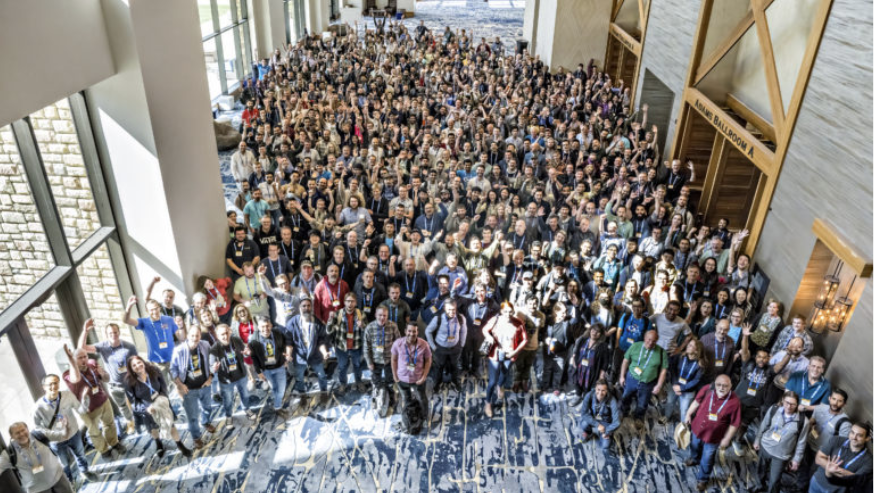
Microsoft Visual C++ at CppCon 2023 Trip Report
The Visual C++ team attended CppCon 2023, the largest in-person C++ conference, in Aurora, Colorado from October 2-6th. There were over 700 attendees from the C++ community, and we really enjoyed getting a chance to meet all of you and talk about your unique backgrounds and C++ experiences. Some of our team member’s talks are now available to watch on YouTube so that you can watch them even if you missed CppCon to learn the latest for our tooling and more: The venue was at the Gaylord Rockies this year. The Gaylord Rockies is a resort with a massive convention center and many restaurants ...
Structured Diagnostics in the New Problem Details Window
Massive compiler errors which seem impossible to navigate are the bane of many C++ developers’ lives. It’s up to tools to provide a better experience to help you comprehend diagnostics and understand how to fix the root issue. I wrote Concepts Error Messages for Humans to explore some of the design space and now, due to the hard work of many folks working on Visual Studio, we have a better experience to share with you all. You can read about some of the work which has led up to these changes in Xiang Fan’s blog post on the future of C++ diagnostics in MSVC and Visual Studio. In Visual Studio 2022 version 17.8 ...
Open Sourcing IFC SDK for C++ Modules

Back with VS2019 version 16.10, we announced a complete implementation of C++ Modules (and, generally, of all C++20 features) across the MSVC compiler toolset, static analysis, IntelliSense, and debugger. Implementing Modules requires principled intermediate representation of C++ source programs. Today, we are thrilled to announce the availability of the IFC SDK, a Microsoft implementation of the IFC Specification. This is an open-source project under the Apache 2-with-LLVM-exception license. The IFC Specification formalizes C++ programs as data amenable to semantics-based manipulation. We are open sourcing the I...
Build Reliable and Secure C++ programs — Microsoft Learn

“The world is built on C and C++” is no overstatement — C and C++ are foundational languages for our global society and are always in the world’s top 10 most heavily used languages now and for the foreseeable future. Visual Studio has always supported many programming languages and we encourage new languages and experiments; diversity and innovation are healthy and help progress the state of the art in software engineering. In Visual Studio we also remain heavily invested long-term in providing the best C and C++ tools and continuing to actively participate in ISO C++ standardization, because we know that our int...
Microsoft C++ Team at CppCon 2023
As always our team will be at CppCon this year with a host of presentations. Many of us will also be present at our team’s booth in the main hall for the first two days of the conference. Come say hi and let us know if you have any questions about our talks, products, or anything else! You can also join the #visual_studio channel on the CppCon Discord to talk to us (note: to join, head to #directory channel first, and check the checkbox next to "Visual Studio" box). We’re also running a survey on the C++ ecosystem. If you have a moment, please take our survey. It's quick and you could win a utility backpac...
MSVC ARM64 Optimizations in Visual Studio 2022 17.7
In Visual Studio 2022 version 17.6 we added a host of new ARM64 optimizations. In this 2nd edition of our blog, we will highlight some of the performance improvements to MSVC ARM64 compiler backend, we will discuss key optimizations in the Visual Studio 2022 version 17.7 for both scalar ISA and SIMD ISA (NEON). We started introducing these performance optimizations in 17.6 release and we have landed them in 17.7 release. By element operation ARM64 supports by-element operation in several instructions such as , , , etc. This feature allows a SIMD operand to be computed directly by a SIMD element using an index ...
C11 Threads in Visual Studio 2022 version 17.8 Preview 2

Back in Visual Studio 2022 version 17.5 Microsoft Visual C gained preliminary support for C11 atomics. We are happy to announce that support for the other major concurrency feature of C11, threads, is available in Visual Studio version 17.8 Preview 2. This should make it easier to port cross-platform C applications to Windows, without having to drag along a threading compatibility layer. Unlike C11 atomics, C11 threads do not share an ABI with C++’s facilities, but C++ programs can include the C11 threads header and call the functions just like any C program. Both are implemented in terms of the primitives pr...
MSVC Machine-Independent Optimizations in Visual Studio 2022 17.7
This blog post presents a selection of machine-independent optimizations that were added between Visual Studio versions 17.4 (released November 8, 2022) and 17.7 P3 (released July 11, 2023). Each optimization below shows assembly code for both X64 and ARM64 to show the machine-independent nature of the optimization. Optimizing Memory Across Block Boundaries When a small struct is loaded into a register, we can optimize field accesses to extract the correct bits from the register instead of accessing it through memory. Historically in MSVC, this optimization has been limited to memory accesses within the same ba...
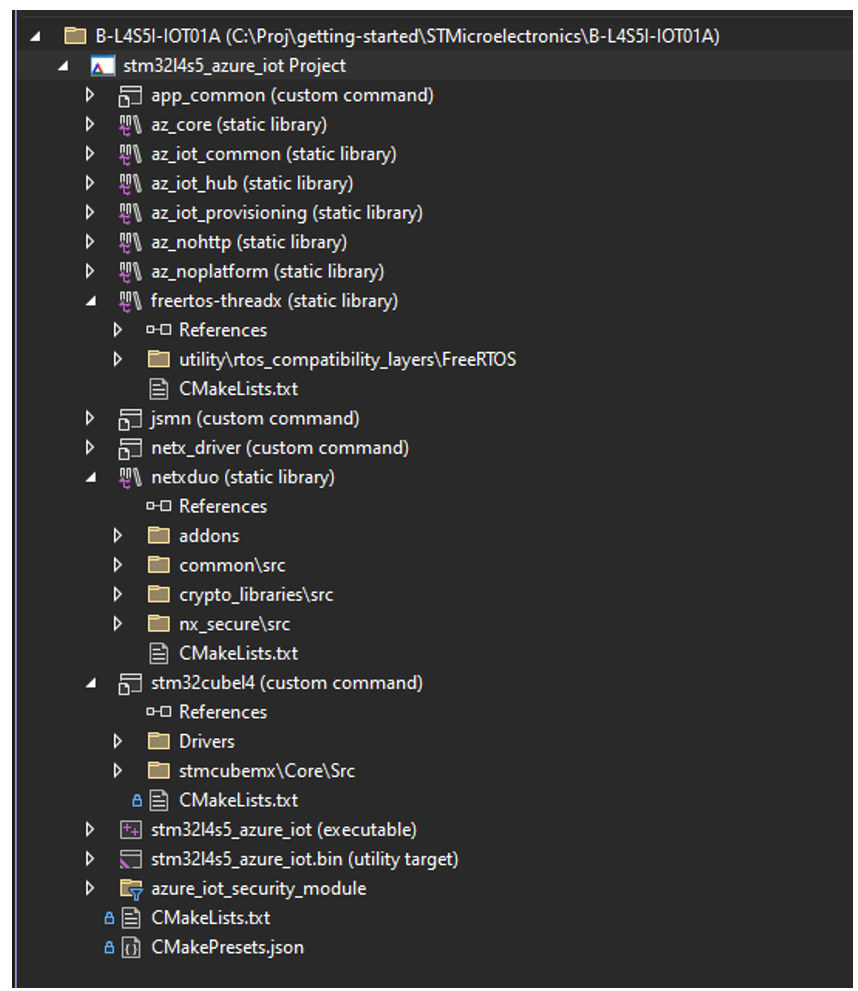
Enhancing the CMake Targets View in Visual Studio
The CMake Targets View in Visual Studio is a view that allows you to visualize your CMake project structure by the CMake targets and build specified target libraries and executables. To make this view more usable, we have implemented a few new improvements to make it easier than ever to navigate your CMake targets. This includes improved navigation to the CMake Targets View, a new, more simplified CMake Targets View, and the ability to exclude specified CMake items from the Targets View. Additionally, we have future planned work in the near-term to allow users to customize this view to their desired configuration...
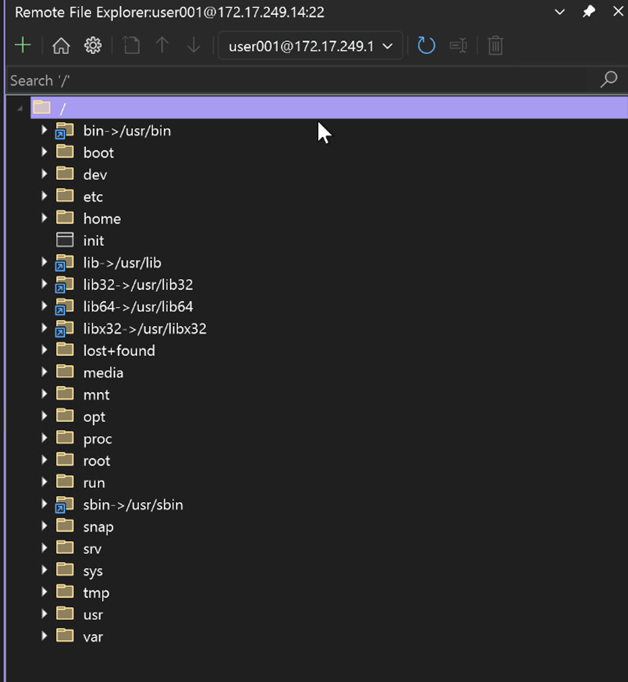
What’s New for the Remote File Explorer in Visual Studio
The Remote File Explorer gives you the capability to access your files and folders on your remote machines that you are connected to through the Connection Manager in Visual Studio, without having to leave the IDE. Since we last spoke, the team has implemented new features to further enhance your remote file workflows by listening to your direct feedback. Download the latest preview version of Visual Studio to access the new updates for the Remote File Explorer and give it a try. Background To access the Remote File Explorer, navigate to View > Remote File Explorer after downloading through the Linux and Em...
Make Member Function const and Global Function Static in Visual Studio
We are delighted to announce that Visual Studio Preview now includes the "Make Member Function Const" and "Make Global Function Static" features. To check out these features, make sure you update to the latest version of Visual Studio Preview. Make Member Function Const Visual Studio now generates hints to mark member functions as when a member function doesn't modify the object's state. This feature identifies cases where a member function performs actions that could be accomplished through the object's public interface using a const pointer. We have made this process easier for you by adding a sugges...
Integrating C++ header units into Office using MSVC (2/n)
In this follow-up blog, we will explore progress made towards getting header units working in the Office codebase. Overview Overview Last time we talked about how and why header units can be integrated into a large cross-platform codebase like Office. We discussed how header units helped surface conformance issues (good) and expose and fix compiler bugs (good-ish). We talked about how we went about taking "baby steps" to integrate header units into smaller liblets—we're talking something on the order of 100s of header units. This blog entry is all about scale and how we mov...
MSVC Address Sanitizer – One DLL for all Runtime Configurations

With Visual Studio 2022 version 17.7 Preview 3, we have refactored the MSVC Address Sanitizer (ASan) to depend on one runtime DLL regardless of the runtime configuration. This simplifies project onboarding and supports more scenarios, particularly for projects statically linked (, ) to the C Runtimes. However, static configurations have a new dependency on the ASan runtime DLL. Summary of the changes: Motivation and Effects When building a project, you must specify how you want to link to the C and C++ Runtime Libraries. Using the option will link dynamically to the runtimes and have...
Introducing CMake Debugger in VS Code: Debug your CMake Scripts using Open-Source CMake Debugger
The new CMake Debugger that was introduced in Visual Studio is now available in VS Code. Now, you can debug your CMakeLists.txt scripts from VS Code using the CMake Tools Extension. To see the full release notes for this release and what else is included, including bug fixes, please see the release notes. Background The Visual C++ team collaborated closely with Kitware, the CMake maintainers, to merge our CMake debugger implementation upstream and make this widely available. This implementation is now available in CMake version 3.27. Please download the latest version for your OS via this link or update via you...
What’s New for C++ Developers in Visual Studio 2022 17.7
We are happy to announce that Visual Studio 2022 version 17.7 is now generally available! This post summarizes the new features you can find in this release for C++. You can download Visual Studio 2022 from the Visual Studio downloads page or upgrade your existing installation by following the Update Visual Studio Learn page. Core Editor Comparing Files You no longer need to leave Visual Studio and rely on other tools to compare files. Now you can easily compare any file in Solution Explorer with other files by either: Please share your feedback here. We’d love to hear your thoughts on this n...
vcpkg 2023.06.20 and 2023.07.21 Releases: GitHub Dependency Graph Support, Android Tested Triplets, Xbox Triplet Improvements, and More…
The 2023.07.21 release of the vcpkg package manager is available. This blog post summarizes changes from April 16th, 2023 to July 21th, 2023 for the Microsoft/vcpkg, Microsoft/vcpkg-tool, and Microsoft/vcpkg-docs GitHub repos. Some stats for this period: Notable Changes Notable changes for this release are summarized below: GitHub Dependency Graph API In June, we announced vcpkg integration with the GitHub dependency graph. This is available for all vcpkg users on the 2023.07.21 release. If you are a GitHub user, we highly recommend checking it out to visualize you...

Partnering with The Coalition to Bring Unreal Engine Find All Blueprint References to Visual Studio 2022
Introduction We are thrilled to bring you the 3rd batch of exciting Unreal Engine integrations in Visual Studio 2022! Since our initial announcements, our team has been hard at work building additional integrations based on your invaluable feedback. Recently, we have been working closely with our partners at The Coalition. Their work on the popular Gears of War franchise inspired us to ship a new feature that allows you to search for Blueprint UFUNCTION references. Today, we are excited to unveil additional performance improvements and a host of new features that will take your game development productivity ...
Visualize Macro Expansion for C++
We are excited to announce the availability of Visualize Macro Expansion in Visual Studio 17.7 Preview. This feature lets you visualize the step-by-step expansion of macros. To begin utilizing this feature, ensure that you update to the latest version of Visual Studio Preview. Visualize Macro Expansion Visual Studio has introduced an enhanced Macro Expansion feature. This feature brings significant benefits, enabling you to comprehend and review complex multi-level macro expansions in a step-by-step manner. When you hover over a macro, you can access Quick Info, which now includes the Visualize Expansion li...
#include cleanup in Visual Studio
We are thrilled to announce the return of #include cleanup, a tool that helps you maintain clean code, now available in Visual Studio 17.8 Preview 1. To start using this feature, make sure to update to the latest version of Visual Studio Preview. #include cleanup Visual Studio now offers #include cleanup, a feature that improves the quality of your code by generating suggestions to remove unused headers and add direct headers. Our suggested workflow is to first go through the direct include suggestions to add direct headers where indirect headers are used, followed by removing the unused includes. R...
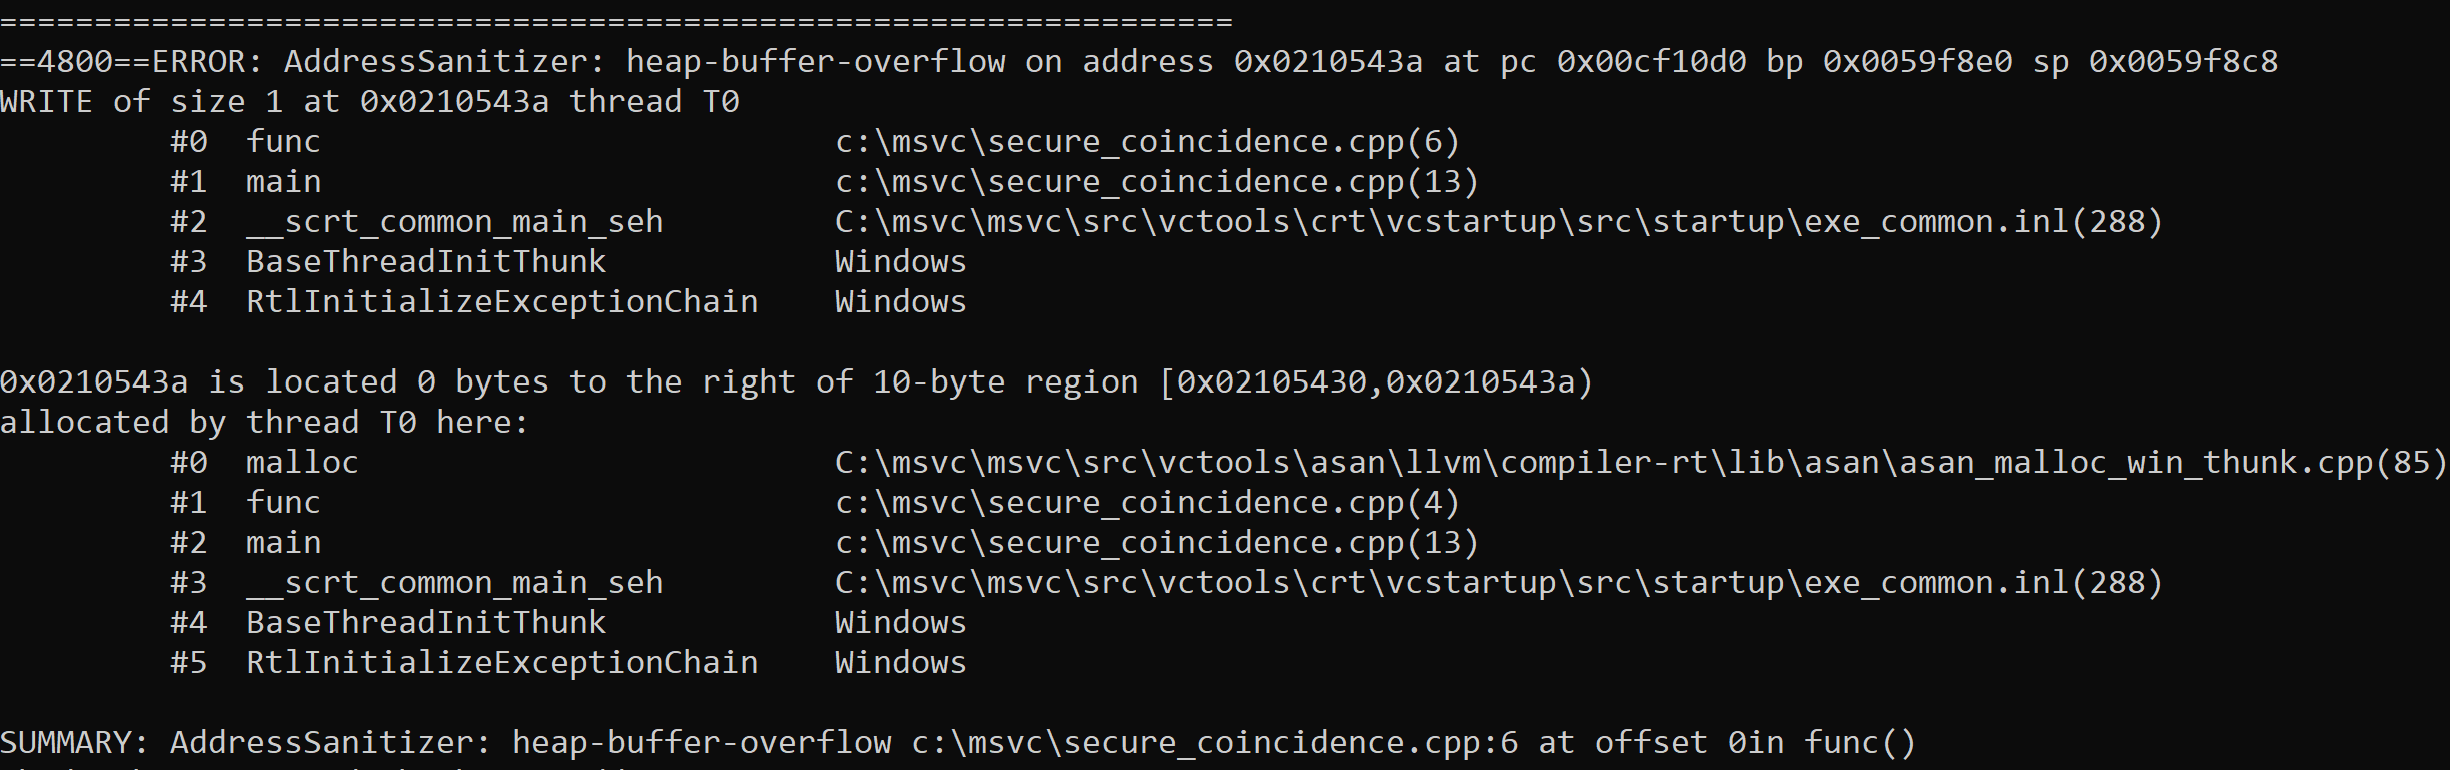
AddressSanitizer continue_on_error

Visual Studio 17.6 comes with new functionality in the Address Sanitizer runtime which provides a new “checked build” for C and C++. This new runtime mode diagnoses and reports hidden memory safety errors, with zero false positives, as your app runs. Introduction C++ memory safety errors are a top concern for the industry. In Visual Studio 17.6, we deliver a new experimental Address Sanitizer feature: continue_on_error (COE). We’ll remove the experimental label in 17.8. You compile as before, by simply adding the compiler flag . With 17.6 you can enable the COE functionality by setting environment variables fro...
C++ Extension in VS Code 1.16 Release: Call Hierarchy & more
The 1.16 version of the C++ Extension in VS Code has now been shipped. With this version of the extension, we are releasing one of our most upvoted GitHub feature requests – Call Hierarchy. We also added new functionality when creating declarations and definitions that allows you to copy the declaration/definition and specify its placement in code, as well as adding other code enhancements. For the full list of changes, please reference the 1.16 release notes. Call Hierarchy With call hierarchy, you can now easily navigate your codebase, especially when trying to understand the complex calling relationships...
vcpkg integration with the GitHub dependency graph
Introducing vcpkg's integration with the GitHub dependency graph
Using Key Events with warning C26800

Here's how you can use Key Events to fix warning C26800
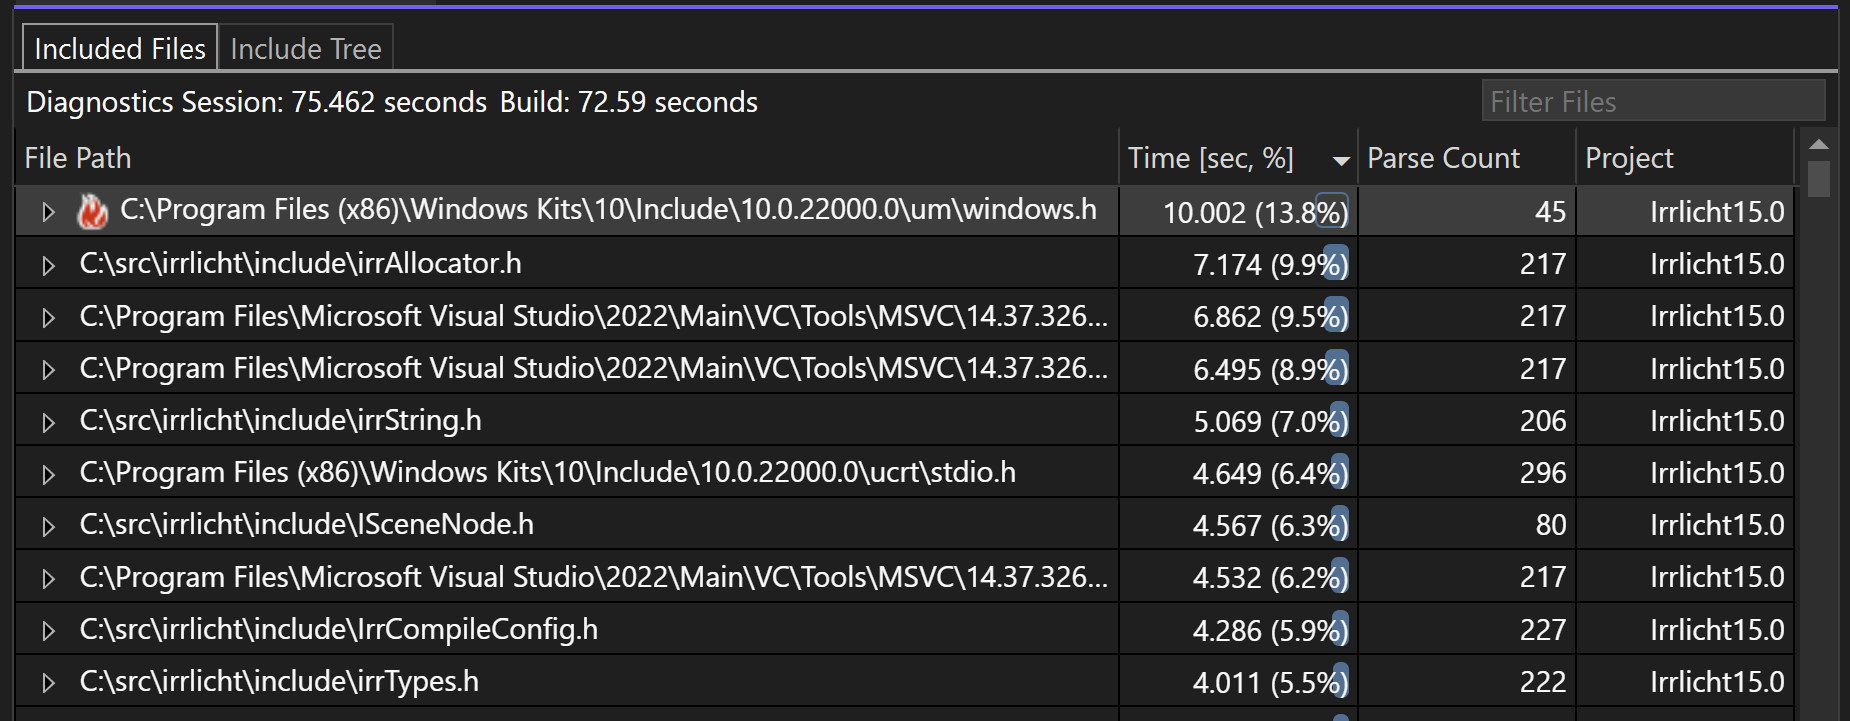
Build Insights Now Available in Visual Studio 2022
Introduction We're excited to announce that Build Insights is now integrated with Visual Studio 2022! Available in Visual Studio 2022 17.7 Preview 2, Build Insights provides critical information of your development environment. Using the analysis created by Build Insights, you will now have the power to effectively optimize your build times, especially large projects like AAA games. With Build Insights now integrated with Visual Studio, you will be able to capture your ETL trace and see your build analytics from within Visual Studio with only a few clicks. As a first step, you will be able to use the Include Fil...
Pure Virtual C++ Videos Available
All of the videos from our Pure Virtual C++ conference are now available! You can find them all on YouTube. Overall we had 18 videos on a wide variety of C++ topics, from Rust/C++ interoperability, to value semantics, to improving compiler errors. Here are the videos for our five live sessions which ran on the day of the conference:
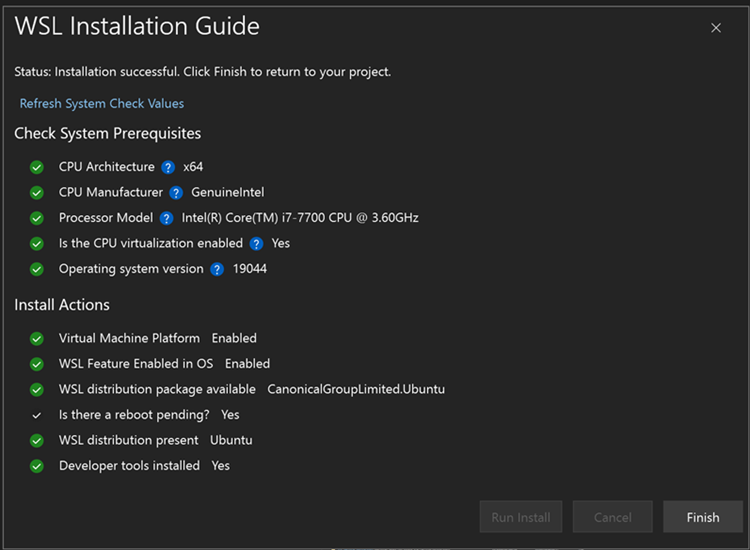
Automatically Install Windows Subsystem for Linux from Visual Studio using New Seamless Integration
Have you ever wanted to try using Windows Subsystem for Linux (WSL) to target Linux from your C++ project, but haven’t gone through the documentation or CLI installation process? Now, from Visual Studio with the Linux and Embedded Workload, Visual Studio makes it easier than ever to get to that one-click install of WSL. Download the latest preview version of Visual Studio and select the Linux and Embedded workload to give it a try! How do I start? When you open a CMake project that can target Linux, an info bar will open for users to click and open a WSL installation process. By default, it will install a WSL2 ...
Improved Doxygen Overload Resolution
We are excited to announce an enhanced Doxygen Comment Support for C++ in Visual Studio 17.7 Preview 2. To start using this feature, ensure to update to the latest version of Visual Studio Preview. Improved Doxygen overload resolution Doxygen comment support has been enhanced to improve the visibility and consistency of shared Doxygen comments across all overloads of a function. Previously, these comments were only displayed in Quick Info for the first overload, as shown below. With this feature improvement, the shared Doxygen comment will now appear in Quick Info of all other overloads as well. This...
MSVC C++23 Update and Pure Virtual C++ Tomorrow!
In preparation for Pure Virtual C++ tomorrow Stephan T. Lavavej has made a video update of all we've been working on for conformance in MSVC for C++20 and C++23. You can sign up for Pure Virtual C++ for free here. Stephan's video is here:
Pure Virtual C++: CMake Debugger, Build Insights in Visual Studio, and more
Pure Virtual C++ is our free, annual, one-day virtual conference for the whole C++ community. This year it is running June 6th and you can find the session list and sign-up for free on the event page. In the run up to the conference we will be publishing new C++ videos every day. You can find the playlist on YouTube. We've published a bunch of new videos the past week:
MSVC ARM64 optimizations in Visual Studio 2022 17.6
In the last couple of months, the Microsoft C++ team has been working on improving MSVC ARM64 backend performance and we are excited to have a couple of optimizations available in the Visual Studio 2022 version 17.6. These optimizations improved code-generation for both scalar ISA and SIMD ISA (NEON). Let’s review some interesting optimizations in this blog. Before diving into technical details, we'd encourage you to create feedback here at Developer Community if you have found performance issues. The feedback helps us prioritize work items in our backlog. This, optimize neon right shift into cmp, is an examp...
Pure Virtual C++ 2023 Pre-Conference Videos
Pure Virtual C++ is our free, annual, one-day virtual conference for the whole C++ community. This year it is running June 6th and you can find the session list and sign-up for free on the event page. In the run up to the conference we will be publishing new C++ videos every day. You can find the playlist on YouTube. The first two videos on Breakpoint Groups and Improved Step Filtering in the Visual Studio Debugger are live now!
vcpkg is Now Included with Visual Studio
As of Visual Studio 2022 version 17.6, the vcpkg C/C++ package manager is included as an installable component for the C++ Desktop and C++ Gaming workloads. You can also find it in the installer by searching for vcpkg package manager under the Individual components tab. Using the Visual Studio Copy of vcpkg After you install or update Visual Studio with the vcpkg component checked, the package manager will be installed in your Visual Studio installation directory. You can run vcpkg commands directly from the Developer Command Prompt for Visual Studio or Developer PowerShell for Visual Studio. T...
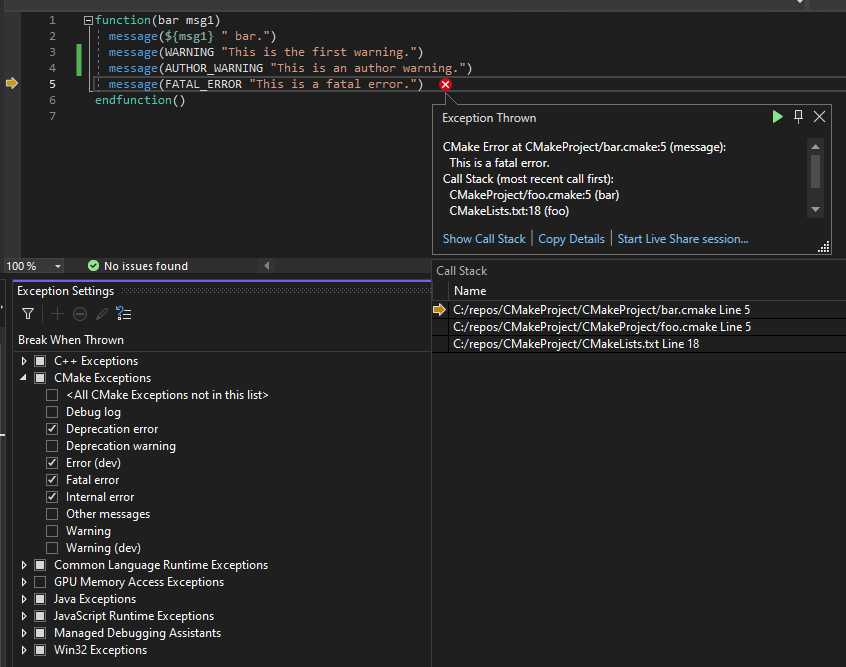
Visual Studio 2022 version 17.6 for C++ Developers
We are happy to announce that Visual Studio 2022 version 17.6 is now generally available! This post summarizes the new features you can find in this release for C++. You can download Visual Studio 2022 from the Visual Studio downloads page or upgrade your existing installation by following the Update Visual Studio Learn page. Cross-Platform You’re used to debugging your C++ code with a lot of help from the IDE, but what about your build system? You can use the new CMake Debugger to debug your CMake scripts at configure time. You can set breakpoints based on filenames, line numbers, and when CMake errors are ...
C++20 Support Comes To C++/CLI
Details of C++20 support for C++/CLI introduced in VS 2022 17.6
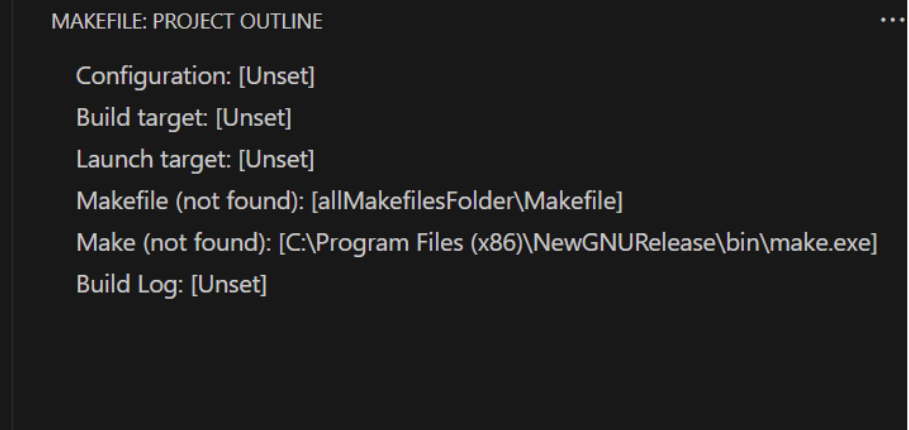
What’s New for Makefile Tools in VS Code Version 0.7.0 – Variable Expansion and more…
The Makefile Tools team in VS Code has shipped the latest 0.7.0 version of the extension. In this version, we have enabled variable expansion for your Makefile projects in settings, so you no longer need to write plain paths for your Makefiles in the settings.json for the extension and can instead utilize variables that the Makefile extension can detect and replace values for. This allows for easier sharing of settings.json and improved consistency. Also, this allows for parameterization, so that you can define one setting and don’t need to constantly change its value if you toggle between different configuration...
Sign Up for the free Pure Virtual C++ 2023 Conference
Every year we run Pure Virtual C++: a free one-day virtual conference for the whole C++ community. Next month we’re doing it again! Sign-up for free to get access to our five live sessions and a host of pre-conference content. The live event will run June 6th 13:00-16:00 UTC. Videos will be available to stream for free on YouTube after the conference. The live sessions will be: Hope to see you there!

What’s New for CMake Tools 1.14 in VS Code – Test Explorer
The team has been working hard to provide new highly requested capabilities for CMake users. Now, in version 1.14, we have provided a new Test Explorer for using CTest with your CMake projects. This release also features open-source community contributions from users. Thanks for your contributions! Test Explorer One of our most highly-upvoted tickets in the CMake Tools Extension was the request for a Test Explorer for CTest. We are excited to announce that this is now available for users in the latest version of the CMake Tools extension in VS Code. Now, in your CMake projects, you can click the “Run CTest” ico...
Documentation for C++20 Ranges

C++20 introduced Ranges to the standard library: a new way of expressing composable transformations on collections of data. This feature adds a huge amount of expressive power and flexibility to C++. As with many concepts in C++, that power comes with new concepts to learn, and some complexity which can be difficult to navigate. One way of taming that complexity is through complete, clear, comprehensive documentation. Christopher Di Bella and Sy Brand (one of the co-authors of this post) presented their ideas for C++ documentation in the era of concepts in their CppCon 2021 talk. Tyler Whitney (the other co...
Fill in the ISO C++ Developer Survey
The ISO C++ developer survey runs every year and is a great help to us in prioritizing work based on what the community cares about. It only takes about 10 minutes to complete and closes tomorrow, so please take the time to fill it out.
vcpkg 2023.04.15 Release: vcpkg ships in Visual Studio, Xbox triplets, GitHub Actions Cache Support, and More…
The 2023.04.15 release of the vcpkg package manager is available. This blog post summarizes changes from February 25th, 2023 to April 15th, 2023 for the Microsoft/vcpkg, Microsoft/vcpkg-tool, and Microsoft/vcpkg-docs GitHub repos. Some stats for this period: Notable Changes vcpkg now included with Visual Studio IDE As of Visual Studio 2022 (version 17.6), vcpkg is now added by default for IDE installations that include C++ workloads. Visual Studio users can run vcpkg commands from a Developer Command Prompt for Visual Studio targeting a new version of the IDE – both the ones ...
Functional exception-less error handling with C++23’s optional and expected
C++23's new facilities for handling disappointments without exceptions.

Even faster builds with Incredibuild 10 and Visual Studio 17.6 Preview 3
Note: This post was co-authored with Incredibuild's Director of Product Marketing, Yohai West. We are pleased to announce that Visual Studio version 17.6 Preview 3 includes Incredibuild's most advanced developer acceleration platform: Incredibuild 10. This release includes several notable, new features that empower teams to speed up the development process: In this post we'll detail how these features can improve your daily development. Build Cache - cache what you can; distribute the rest Incredibuild 10's most significant addition is its Build Cache technology. Incredibuild breaks down dev...
C++23’s New Fold Algorithms
New fold algorithms in C++23, what they do, how to use them.

Maximize Unreal Engine Development with the Latest Integrations in Visual Studio 2022
Introduction Since our announcement last month, the team has been working hard on building a new round of Unreal Engine integrations. Today, we are happy to show you the next set of features that can level up your game development productivity. In this article, you will learn about how to stream Unreal Logs, see Unreal Header Tool warnings in Visual Studio, and discover how you can be more productive working with HLSL files. All features mentioned below are available in the latest Visual Studio 2022 Preview. Visual Studio Toolbox – Game Dev Edition Curious to see these features in action? I chatted wit...
Create C++ Member Function in Visual Studio
We are excited to announce that Create C++ Member Function can now be used to quickly add constructor and equality operator (operator ==) in Visual Studio 17.6 Preview 2. When you have a class with fields, you can add a default constructor, constructor with all fields, equality operator, and equality operator with all fields easily. Three dots will appear below a class name to indicate that you can add a member function, and you can hover over them to see the quick action (screwdriver icon). When the default constructor and equality operator are added respectively, the Go to Definition of the operator== is...
vcpkg 2023.02.24 Release: Default Triplet Changes, RISC-V support, Bug Fixes, and More…
The 2023.02.24 release of the vcpkg package manager is available. This blog post summarizes changes from January 10th, 2023 to February 24th, 2023 for the Microsoft/vcpkg, Microsoft/vcpkg-tool, and Microsoft/vcpkg-docs GitHub repos. Some stats for this period: Notable Changes Notable changes for this release are summarized below: Upcoming Default Triplet Changes Starting with the September 2023 vcpkg tool release, the default triplet for vcpkg libraries for Windows users will change from x86-windows to a detected host triplet. The detected host triplet will be infe...
std::string now supports Address Sanitizer

The standard library now checks for more incorrect usage using the ASan "container overflow" feature in `std::string`.
Code Analysis Improvements in Visual Studio 17.6
Code Analysis Improvements in VS 17.6
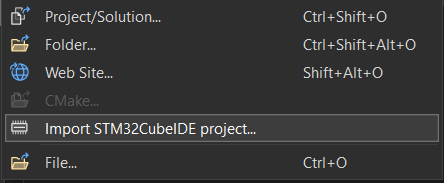
Importing ST projects into Visual Studio

Last year we introduced the ability to import ST projects in Visual Studio Code. We’re happy to announce the availability of this feature in Visual Studio 2022 17.6 as well. In the world of Arm microcontrollers there are many silicon vendors, one of the largest is STMicroelectronics. ST has a large catalog of available devices with many capabilities as well as supporting development boards for evaluating them. They also produce STM32CubeIDE, a custom IDE to use when targeting their devices, and STM32CubeMX, a configuration tool used in configuring properties of their devices and generating projects. If you ...
An alternative to __if_exists in ATL

What are and The and keywords in the Active Template Library (ATL) allow a user to test at compile time whether an identifier exists. If the identifier exists, the associated statement block is executed. and can be applied to the names of variables, functions, typedefs, as well as other identifiers. You can read more about the specifics of their use and potential pitfalls on MSDN, and in Raymond Chen’s blogpost about the keywords. Why you shouldn’t use or Although these keywords seem like they’d be useful, they’ve been problematic for years. Also, and are also incompatible with the recommended comp...
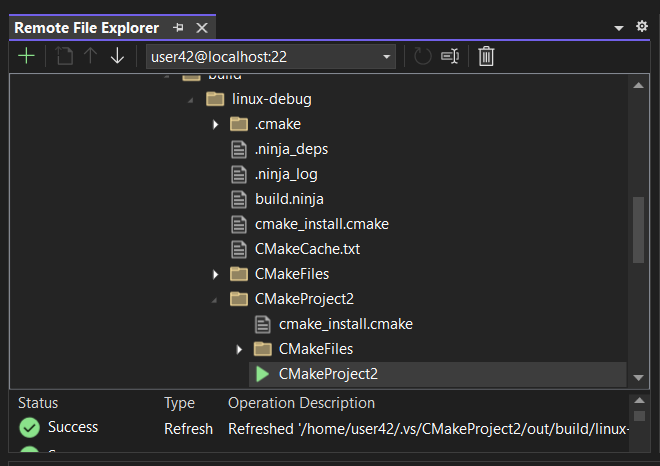
View files on your Remote Machines using the new Remote File Explorer in Visual Studio
We are excited to announce that we have added a new tool window, the Remote File Explorer, to Visual Studio in version 17.6 Preview 1. This window provides you with the ability to browse, upload, and download files and folders on your remote machines that you are connected to via the Connection Manager within your Visual Studio instance. How do I access the Remote File Explorer? To access the Remote File Explorer, download the latest version of Visual Studio and ensure “Remote File Explorer for Linux” is checked under the optional downloads in the Linux and embedded development with C++ toolset: ...

CMake debugger allows you to debug your CMake scripts and more
The VS CMake team has been working in close collaboration with Kitware on developing a debugger for CMake scripts in the Visual Studio IDE (see this open Kitware issue for more details). We will be contributing this work back upstream (targeting the 3.27 release) so that the developer community can have it and work to improve it together, by adding new features and support for additional DAP capabilities. We are excited to announce that a preview of the CMake debugger is now available to debug your CMake scripts and CMakeLists.txt file for any CMake project in Visual Studio 17.6 Preview 1. To initiate a ...
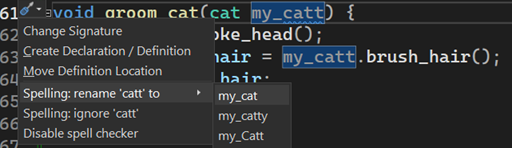
Visual Studio 2022 version 17.5 for C++ Developers
We are happy to announce that Visual Studio 2022 version 17.5 is now generally available! This post summarizes the new features you can find in this release for C++. See the Visual Studio 17.5 announcement to learn about all of the features in the release. You can download Visual Studio 2022 from the Visual Studio downloads page or upgrade your existing installation by following the Contents Arm64 In 17.3 you could use Visual Studio as a native Arm64 application. In 17.4 you could use our native Arm64 toolchain in production. Continuing our progress, in 17.5 you can now obtain a native ...
Unreal Engine Integrations Now Available in Visual Studio 2022
Since the release of Visual Studio 2022, we have been focusing on building a cascade of productivity and performance improvements for game and large project developers. Today, we are happy to share the next set of features specifically aimed towards improving productivity for Unreal Engine development. We have heard and seen a tremendous amount of valuable feedback from you, our game developers. We want to give a special shoutout to all who participated in surveys, left Developer Community suggestions, and chatted with us on social media. These features wouldn’t have been possible without you. In this blog...

Minecraft’s WSL build time cut in half after working with Visual Studio C++ team
The Minecraft Publishing team, within Mojang Studios, reached out to the Visual Studio C++ team because they needed to expand C++ development to a new platform (Linux) while respecting their existing technological base (MSBuild) and these constraints prevented them from pursuing more established cross-platform pipelines. When developing with these technical constraints, they were experiencing issues with extremely slow full rebuild times on WSL (40-50 minutes!) and remote Linux systems with MSBuild. For reference, the same rebuild would take around 20 minutes for Windows. The Visual Studio C++ team met with them...
Remote Native Unit Test Support in Visual Studio
Remote C++ unit testing enables developers to connect Visual Studio 2022 to remote windows environments for running and debugging C++ desktop application tests. This functionality is useful for developers who deploy code to different Windows target environments such as different Windows architectures. With this feature, you can run tests on your target machine right from Visual Studio by connecting the Test Explorer to a remote environment. How to Setup for Native Remote Unit Testing Prepare the Remote Windows Machine 1. Ensure Windows Projected File System is enabled. You can run the following from an admin P...
VS Code C++ Extension January Update: Create Definitions and Declarations
Starting with the 1.13.6 version of the C++ Extension in VS Code, we are happy to share a much requested feature: Auto creation of definitions or declarations for functions! You can now quickly create a declaration in a header file for a function you only have a definition for, or vice versa. These generated definitions and declarations already include all function arguments, so no need for constant copying, pasting, and double checking. Let’s see it in action: How can I create a Definition or Declaration? You can either: How do I know where the definition or de...

Debug Linux Console apps in Visual Studio’s Integrated Terminal
We have now added the capability for users to debug their C++ Linux Console applications from the Integrated Terminal in Visual Studio 2022 17.5 Preview 3! To learn more about what the Integrated Terminal does and how to work with it in Visual Studio, please see this C++ feature announcement blog post. Now, using the Linux Console embedded in the Integrated Terminal, Visual Studio supports a fully functional terminal-like experience when debugging Linux applications. This new Linux Console emulates an xterm and can support application screen manipulation; for example, writing screen formatting control charact...
C++ Brace Pair Colorization and More in Visual Studio
Visual Studio 17.5 brings you several new improvements in the C++ editing experience. Now we are excited to announce that C++ Brace Pair Colorization, Spell Checker, All-In-One Search, Reimagined Member List, and Macro Expansion Improvements are released in the Visual Studio Preview. These features are also part of our focus on increasing game development productivity. Look out for a dedicated post coming soon. To start using the features, make sure to update to the latest version of Visual Studio Preview. Brace Pair Colorization for C++ You can now visually distinguish each set of opening and closin...
Deploy and debug apps on remote targets
There are a number of ways that Visual Studio and Visual Studio Code enable you to interact with remote machines. Both can enable you to connect to a remote machine and use it as a build machine and debug your applications there. Sometimes though your target is not the same as your build machine. For example, for embedded Linux devices you will likely want to cross compiler the application on a more powerful build machine then deploy to the device for debugging. This post is going to demonstrate how to build an application locally in a Dev Container for either a Raspberry Pi 3 or 4, then deploy and debug the appl...
vcpkg 2023.01.09 Release: Registry Pattern Matching, Documentation Changes, and More…
The 2023.01.09 release of the vcpkg package manager is available. This blog post summarizes changes from November 15th, 2022 to January 9th, 2023 for the Microsoft/vcpkg and Microsoft/vcpkg-tool GitHub repos. Some stats for this period: Notable Changes Notable changes for this release are summarized below. Registries now support pattern matching when declaring packages Based on user feedback, we have added a feature that enables limited pattern matching for packages declared in registries. We now allow prefixes followed by a * character. The * character is a wi...
vcpkg Documentation Moves to Microsoft Docs Platform
vcpkg Documentation Moves to Microsoft Docs Platform As of today, the vcpkg documentation has a new home at https://learn.microsoft.com/vcpkg. This is the platform that most Microsoft documentation is hosted on and comes with many features that make it easier to search, navigate, author, and review documentation. All current vcpkg articles are now visible on the new platform. We are still in the process of removing the documentation from other locations (vcpkg.io, the main vcpkg GitHub repo, and vcpkg.readthedocs.io). We will add redirects where possible to the new home for the docs to avoid breaking existing ...
Standards conformance improvements to /Gw in Visual Studio version 17.5 Preview 2

The /Gw switch enables the linker to optimize global data to reduce binary size. As part of the 17.5 Preview 2 release a new flag, , has been added to improve C++ standards conformance when using . Previously, when using , certain One Definition Rule (ODR) violations were being ignored and would not cause an error. The new flag ensures that we do raise the appropriate errors. If you are currently using we recommend setting on your builds, as it’s currently off by default. This may change in a future major update. For a more detailed explanation of ODR, , and how this issue came about, read on below. Let’s go...
High-confidence Lifetime Checks in Visual Studio version 17.5 Preview 2
New High-confidence Lifetimes Checks in Visual Studio 2022
C11 Atomics in Visual Studio 2022 version 17.5 Preview 2
C11 Atomics in Visual Studio 2022 version 17.5 Preview 2
Improving the State of Debug Performance in C++
In this blog we will explore one change the MSVC compiler has implemented in an effort to improve the codegen quality of applications in debug mode. We will highlight what the change does, and how it could be extended for the future. If debug performance is something you care about for your C++ projects, then Visual Studio 2022 version 17.5 is making that experience even better! Please note that this blog will contain some assembly but being an expert in assembly is not required. Overview Motivation You might notice that the title of this blog is a play on words based on a recent popular...

MSVC OpenMP Update
Summary of your post, shown on the home page next to the featured image
A Tour of 4 MSVC Backend Improvements
This blog post presents some of the optimizations the backend team has implemented for Visual Studio 2022.
vcpkg 2022.11.14 and 2022.10.19 Releases: Localization for 14 Languages, Overlay Ports/Triplets in Manifests, acquire-project Command, and More…
The 2022.11.14 release of the vcpkg package manager is available. This blog post summarizes changes from September 27th, 2022 to November 13th, 2022 for the Microsoft/vcpkg and Microsoft/vcpkg-tool GitHub repos. Some stats for this period: Notable Changes Notable changes for this release are summarized below: Localized vcpkg output is now available One of the steps required for us to ship vcpkg in Visual Studio was to localize its output to a variety of languages. This experience is now enabled in the tool for 14 languages – the same languages available for Vis...
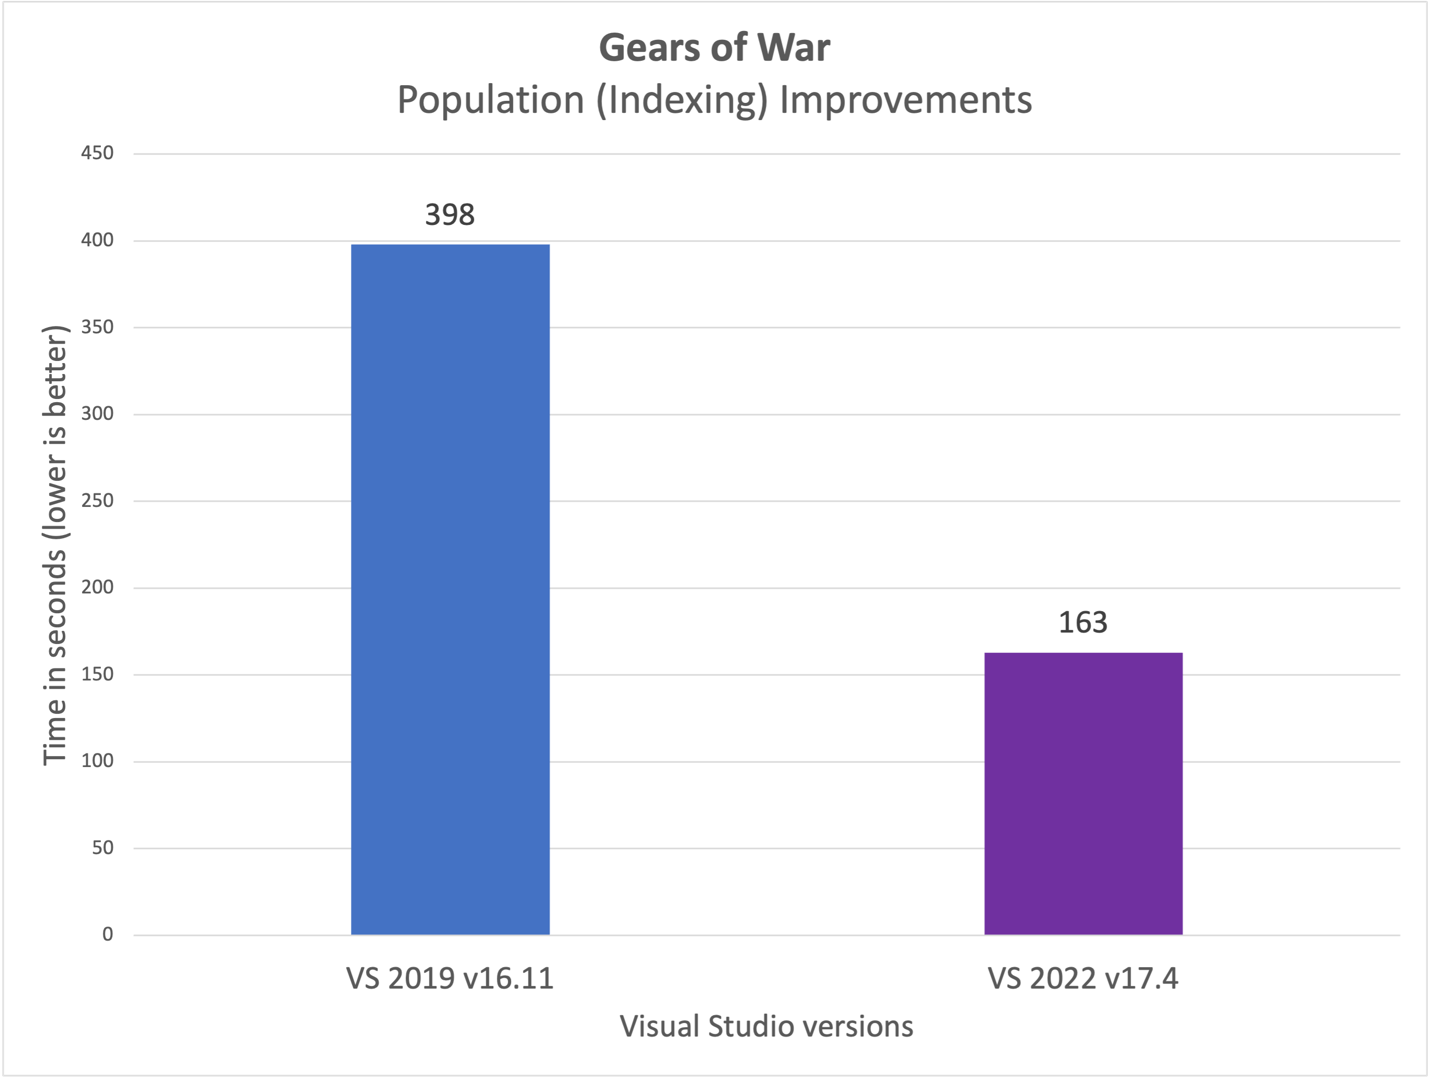
Visual Studio 2022 Performance: Faster C++ Source Code Indexing

Building on top of performance wins in Visual Studio 2022 version 17.3, we are excited to announce additional improvements in version 17.4. Whether you are a game developer, work with large codebases, or have solutions with many C++ projects, your development experience in Visual Studio 2022 17.4 will feel even faster. In 17.4 we significantly reduced the time it takes to open a C++ project for the first time (cold load). While working on these improvements, we constantly check our performance against real-life large projects, including some of our own, as well as several C++ codebases for popular games ...
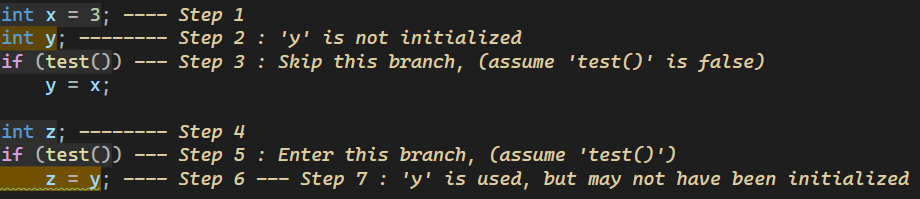
What’s New for C++ Developers in Visual Studio 2022 17.4
We are happy to announce that Visual Studio 2022 version 17.4 is now generally available! This post summarizes the new features you can find in this release for C++. You can download Visual Studio 2022 from the Visual Studio downloads page or upgrade your existing installation by following the Update Visual Studio Learn page. Arm64 In 17.3, Visual Studio became available as a native Arm64 application. We have continued work on supporting more development scenarios and are pleased to announce that the native Arm64 toolchain is now ready for production use! The “Desktop development with C++” and “Game developm...
Fix for High Risk OpenSSL Security Vulnerabilities Announced – Guidance for vcpkg Users
OpenSSL.org announced the release of OpenSSL 3.0.7 to address two security vulnerabilities rated as high risk. This patch is now available, including via vcpkg. The vulnerabilities impact users of OpenSSL 3.0.0 - 3.0.6. If you are relying on a version of OpenSSL in this range, it is strongly recommended to upgrade to 3.0.7 as soon as possible. We also recommend reviewing Microsoft Security Response Center's central blog post on awareness and guidance related to these two CVEs: Awareness and guidance related to OpenSSL 3.0 – 3.0.6 risk (CVE-2022-3786 and CVE-2202-3602) – Microsoft Security Response Center. If y...
Microsoft Office team uses Remote MacOS Debugging Capability in Visual Studio
The Microsoft Office team approached the C++ team after seeing the Visual Studio announcement for support for debugging applications running on C++ from Windows through the Blizzard blog post. They had a need for a similar workflow, but for Macs instead of Linux. The C++ team worked closely with the Office engineers to adapt the same underlying technology for Mac. The following blog post is written in conjunction with Anthony Penniston, an Office engineer we worked closely with to deliver this capability. Thank you, Anthony, for working with us! What does this team do? Anthony’s team in Office works on...
Improving Copy and Move Elision
With Visual Studio 2022 version 17.4 Preview 3, we've significantly increased the number of situations where we do copy or move elision and given users more control over whether these transformations are enabled. What are copy and move elision? When a keyword in a C++ function is followed by an expression of non-primitive type, the execution of that return statement copies the result of the expression into the return slot of the calling function. To do this, the copy or move constructor of the non-primitive type is called. Then, as part of exiting the function, destructors for function-local variables are call...

vcpkg September 2022 Release is Now Available: Celebrating 6 Years with Over 2000 Libraries!
The September 2022 release of the vcpkg package manager is available. This blog post summarizes changes from August 15th, 2022 to September 27th, 2022 for the Microsoft/vcpkg and Microsoft/vcpkg-tool GitHub repos. vcpkg now has over 2,000 unique libraries in its open-source registry With this release, and the 6th anniversary of the launch of vcpkg, we are proud to hit a new milestone: over 2,000 unique open-source libraries are available in the vcpkg catalog! vcpkg continues to maintain the largest catalog of any C/C++ package manager with over 10,000 unique library versions with built-in support for ...

Announcing NuGet PackageReference support for C++/CLI MSBuild projects targeting .NET Core and .NET 5 or higher
One of the new features for C++ developers in Visual Studio 2022 version 17.3 is NuGet PackageReference support for C++/CLI MSBuild projects that target .NET Core and .NET 5 or higher. More specifically, this impacts CLR Class Library (.NET) and CLR Empty Project (.NET) project templates. This functionality allows you to manage NuGet packages while bringing the benefits of PackageReference support to your dependencies. This feature is on by default for new projects. To enable this feature for your existing projects, add the following property to your project file: In most cases, you will want to enable...
Using system package manager dependencies with vcpkg

According to the C++ 2022 developer survey, the top 3 ways to manage C++ libraries were having the library source code as part of the build, compiling the library separately from instructions, and acquiring the library from a system package manager. Language package managers, such as vcpkg, simplify library management by offering the ease of use of a system package manager with the power, flexibility, and portability of building from source. vcpkg brings several advantages to C++ library management. First, vcpkg supports a wide range of customizations for each library. vcpkg installs libraries with a specific ...
A Visual Studio Debugger Extension for the Raspberry Pi Camera

While developing a sample application for a Raspberry Pi with a camera using the RaspiCam library, it occurred to me that it would be convenient and fun to be able to see the current camera input while debugging the application. The Visual Studio debugger supports type-specific custom visualizers and end-user extensions that implement UI for these visualizers. I decided to make one for the RaspiCam camera types that would display the current image from the camera. The image below is the end result, showing Visual Studio debugging a program running on the Raspberry Pi and displaying the content of a Raspberry Pi ...
Microsoft C++ Code Analysis Warnings with Key Events
Introduction To make your C++ coding experience as safe as possible, the Microsoft C++ Code Analysis has added new checks and improved existing ones to help you prevent bugs before they find their way into your products. Some of the checks work harder than others, analyzing the code deeper by simulating runtime behavior. As such, they can find defects that are harder to find through syntactic checks alone or through data flow analysis. It is natural that developers find it harder to find the root causes for some of these more complex warnings. Imagine a warning where the effect of the bug is detected tens o...
The Future of C++ Compiler Diagnostics in MSVC and Visual Studio

We are working hard on improving the diagnostics experience in MSVC and Visual Studio. We began this work in Visual Studio 2022 version 17.3 and while not everything is ready yet, we would like to share the early progress. Motivation & Principles New C++ features like concepts and ranges present the opportunity for more expressive code and better-defined APIs. However, to make the most of them, better diagnostics are required from tooling so that constraint failures can be pinpointed and resolved. We are aware that there is a lot of room for improvement, as noted by many of you on Developer Community...
Dev Containers for C++ in Visual Studio
We are happy to share with you that we have added Dev Container support In Visual Studio 2022 17.4 for C++ projects using CMake Presets. Containers are a great way to package up everything for running an application. Through a Dockerfile all prerequisites are captured so that there is a consistent runtime environment anywhere the container is deployed and run Dev Containers expand this concept to capture everything necessary for developing and building an application in the container. We have been observing for some time that containers are becoming more popular in the C++ community for providing reproducible ...
vcpkg Environment Activation in Visual Studio
In Visual Studio 2022 17.4 vcpkg environments will now automatically activate. A vcpkg environment is described by a manifest that captures the artifacts necessary for building your application (learn more about vcpkg artifacts). Today the vcpkg artifact experience is focused on embedded developers, but we will be expanding this in time to all C++ development scenarios. Try vcpkg environment activation This is part of the Linux and embedded development with C++ workload., so make sure that is selected in your installation. Today you need to install vcpkg directly, it is not installed with Visual Studio y...
Integrating C++ header units into Office using MSVC (1/n)
.cameron { color: #4472c4; } C++20 has had a lot to offer and one feature in particular requires the most thought of all when integrating into our projects: C++ modules (or C++ header units in this particular case). In this blog we will show a real world case of integrating a new C++20 feature into a large codebase that we might all be familiar with. Just a few notes: Without further delay, let us jump right in! Overview How MSVC enables header units in a multi-platform codebase C++20 header units are a way to receive m...
Microsoft C++ Team at CppCon 2022
The Microsoft C++ team has an exciting lineup of sessions at CppCon 2022. Many of us will also be present at our team’s booth in the main hall for the first two days of the conference. Come say hi and let us know if you have any questions about our talks, products, or anything else! You can also join the #visual_studio channel on the CppCon Discord to talk to us (note: to join, head to #directory channel first, and check the checkbox next to "Visual Studio" box). We’re also running a survey on the C++ ecosystem. If you have a moment, please take our survey, it's quick. Here’s the lineup: Monday, Septem...
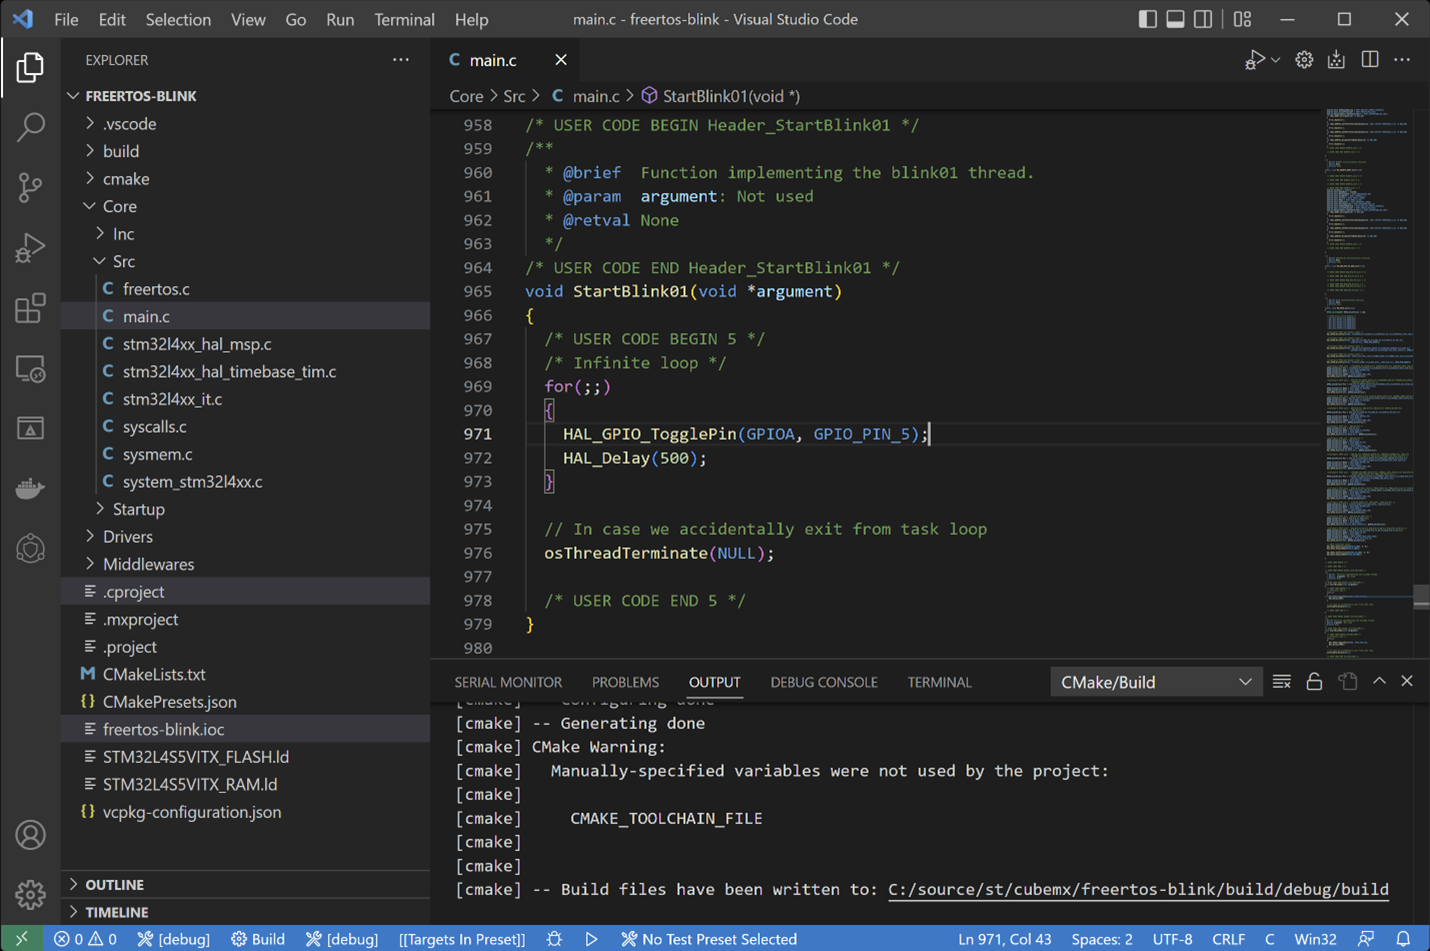
Importing ST projects into Visual Studio Code
In the world of Arm microcontrollers there are many silicon vendors, one of the largest is STMicroelectronics. ST has a large catalog of available devices with many capabilities as well as supporting development boards for evaluating them. They also produce STM32CubeIDE, a custom IDE to use when targeting their devices, and STM32CubeMX, a configuration tool used in configuring properties of their devices and generating projects. If you are a developer already using ST’s products I’m not telling you anything new. You may not be aware though of the work we have been doing to enable embedded developers in Visual ...
vcpkg August 2022 Release is Now Available: CMake Version Update, Updated FAQ, Cross-compilation Fix for Apple Silicon
The August 2022 release of the vcpkg package manager is available. This blog post summarizes changes from July 25th, 2022 to August 14th, 2022 for the Microsoft/vcpkg and Microsoft/vcpkg-tool GitHub repos. Some stats for this period: Notable Changes This is a minor update and there was no tool update this month, so most of the changes are to the open-source ports registry or minor changes. See the full commit changelog for details. We call out several of the more interesting changes below. vcpkg now uses CMake v3.24 Updated the version of CMake used by vcpkg to...
Updates to Visual Studio Build Tools license for C and C++ Open-Source projects
Visual Studio Build Tools (VSBT) can now be used for compiling open-source C++ dependencies from source without requiring a Visual Studio license, even when you are working for an enterprise on a commercial or closed-source project. This change expands user rights to the Build Tools and does not limit the existing Visual Studio Community license provisions around Open-Source development. If you already are a developer contributing to OSS projects, you can continue to use Visual Studio and Visual Studio Build Tools together for free, just like before. New License Benefits If you are an enterprise developer or...
proxy: Runtime Polymorphism Made Easier Than Ever
proxy is a single-header cross-platform library that facilitates runtime polymorphism.
Official Support for Arm64EC is Here

Last year, Microsoft announced x64 compatibility for Windows 11 on Arm, along with the new Arm64EC ABI, a new way to bring apps to Windows on Arm. With Arm64EC you can mix Arm and x64 code in the same process, allowing you to port existing x64 apps to Arm in an incremental way. We also announced experimental support for Arm64EC development in Visual Studio. Now, after a year of bug fixes and product stabilization, we are here to announce that this toolset is leaving experimental mode in the 17.3 release, making it possible to build fully-supported Arm64EC applications for Windows 11 on Arm. We hope that using...
MSVC Backend Updates in Visual Studio 2022 version 17.3

In Visual Studio 2022 version 17.3 we have continued to improve the C++ backend with new features, new and improved optimizations, build throughput improvements, and better security. Here is a list of improvements for you to review. Do you want to experience the new improvements of the C++ backend? Please download the latest Visual Studio 2022 and give it a try! Any feedback is welcome. We can be reached via the comments below, Developer Community, and Twitter (@VisualC)
MSBuild Low Priority Builds in Visual Studio

The C++ team is happy to announce the completion of a highly upvoted C++ feedback ticket from Developer Community – Low Priority Builds. With your feedback and collaboration from our partner teams, you can now start Low Priority Builds within Visual Studio. This will ensure the MSBuild node spawns with a lower priority, affecting all compile and link processes. If the build is affecting you from having a responsive work environment, then this is the feature for you! Internally, VS interfaces with MSBuild like a service. The MSBuild team has added new API functionality to switch the priority of the MSBuild nodes...
vcpkg July 2022 Release is Now Available: Shared Libraries on Linux, Improved vcpkg new, Optional name and version Fields, and More…
The July 2022 release of the vcpkg package manager is available. This blog post summarizes changes from June 16th, 2022 to July 24th, 2022 for the microsoft/vcpkg and microsoft/vcpkg-tool GitHub repos. Some stats for this period: Notable Changes Better support for shared libraries on Linux This update includes a community triplet for installing shared libraries on Linux: x64-linux-dynamic. This was made possible by adding rpath support to make ports relocatable. After building a port, the binaries are patched to have correct rpath values relative to lib/ (or debug/lib/). ...
New std::optional Checks in Visual Studio 2022 version 17.3 Preview 3
New std::optional Checks in Visual Studio 2022
Integrated Terminal in Visual Studio: New SSH integration for Linux targeting
In the latest version of Visual Studio, users are now able to leverage the integrated terminal to access their remote targets when developing for remote machines from Windows. This updated terminal includes an interactive SSH shell. It can be accessed by going to View->Terminal in Visual Studio. Now, instead of starting an SSH session inside of PowerShell or WSL and having to re-authenticate, you can select one of your existing connections with one click. The integrated terminal pulls from the stored connections established in your Connection Manager. You only have to authenticate once when you add a s...

VS2022 Performance Enhancements: Faster C++ Development
Introduction Building on top of our performance wins in earlier releases of VS2022, we are excited to announce additional improvements in Visual Studio 2022 17.3! Whether you are a game developer, work with large codebases, or have a small C++ project, your C++ development experience in Visual Studio 17.3 will feel even faster! In this blog, I will share the incredible speed improvements you will experience when VS indexes your codebase and colorizes your C++ code for the first time. In addition, learn about the new Go to All experience that will show results as you type. Testing Methodology Measuring index...
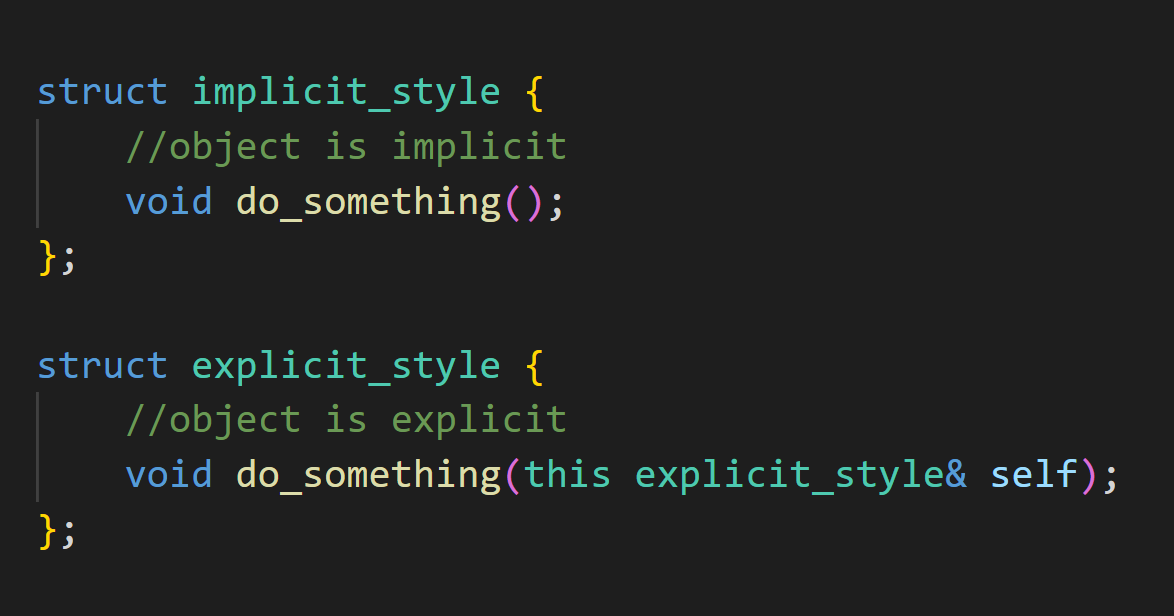
C++23’s Deducing this: what it is, why it is, how to use it
Find out how C++23's Deducing this feature can help make your code better.
vcpkg June 2022 Release is Now Available: Force Download vcpkg Dependencies, Documentation Changes, and More
The June 2022 release of the vcpkg package manager is available. This includes a hotfix that fixed a regression in the binary caching experience. This blog post summarizes changes from May 11th, 2022 to June 15th, 2022 for the microsoft/vcpkg and microsoft/vcpkg-tool GitHub repos. In the past month, the ISO C++ 2022 Annual Developer Survey results were released. We want to thank the C++ community for taking the time to provide feedback on vcpkg in the survey. This year, 19% (+4% year over year) of respondents indicated they were using vcpkg. We hope to see more and more of the community adopting package manage...
What’s New in CMake for VS Code
The latest version of CMake tools is now available for download in the VS Code Marketplace or using the .vsix file. We have been working hard on improving the CMake experience and are excited to share some new features and improvements for users starting in version 1.11. ‘CMake’ task provider updates We have added more options to the build task and more commands for the “cmake” task type so you don’t have to manually type up shell tasks. Tasks make it easier to automate your workflows. With our new task provider commands, you can easily create workflows that include configuration, build, install, test, clean,...
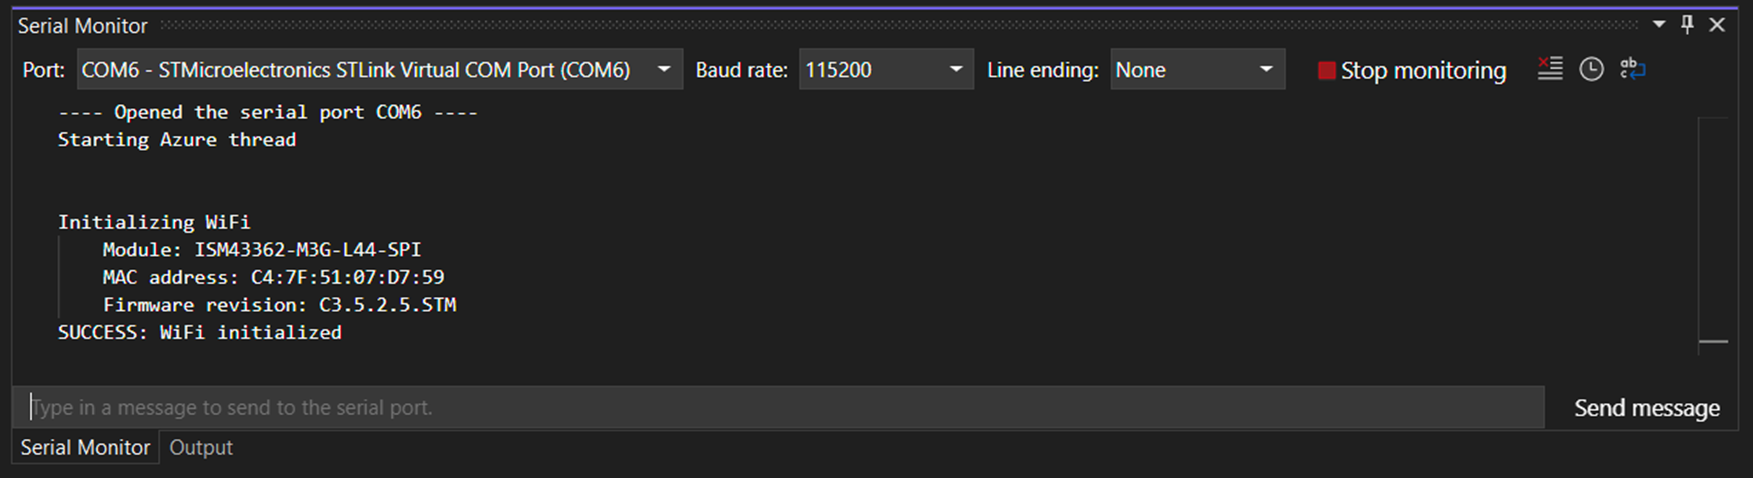
Serial and Zephyr support for Visual Studio and VS Code
We are continuing to improve our embedded development support in Visual Studio and VS Code. We have recently introduced a serial monitor and RTOS support for Zephyr. These capabilities are present in Visual Studio 17.3 Preview 1 as part of the Linux and embedded development workload. The Embedded Tools extension for VS Code also includes these capabilities, though the serial monitor is available as a stand-alone extension as well. This post illustrates these new capabilities in Visual Studio and VS Code. Serial monitor To start the serial monitor in Visual Studio in the Debug > Windows > Serial Monitor. ...
MSVC Backend Updates in Visual Studio 2022 version 17.2
In Visual Studio 2022 version 17.2 we have continued to improve the C++ backend with new features, new and improved optimizations, build throughput improvements, and better security. Here is a list of improvements for you to review. Do you want to experience the new improvements of the C++ backend? Please download the latest Visual Studio 2022 and give it a try! Any feedback is welcome. We can be reached via the comments below, Developer Community, and Twitter (@VisualC)
vcpkg May 2022 Release: artifacts using JSON, COS and SPDX support, and more
The May 2022 release of the vcpkg package manager is available. This blog post summarizes changes from March 31st, 2022 to May 10th, 2022 for the Microsoft/vcpkg and Microsoft/vcpkg-tool GitHub repos. Some stats for this period: Notable Changes vcpkg Artifacts update This is our first significant update to vcpkg artifacts since we introduced them in December. The changes and additions are all on the artifact metadata used in populating catalogs of available artifacts. As such this section is mainly of interest to people working on preparing their own catalogs of artifacts. ...
Pure Virtual C++ 2022 Recordings Available
Pure Virtual C++, a free one-day virtual conference for the whole C++ community, ran on 26th April 2022. All sessions are now available to watch online. Live sessions: Pre-conference sessions:
MSVC’s STL Completes /std:c++20

We are happy to announce that the final C++20 Standard Library features are now stabilized and available in mode in both Visual Studio 2022 version 17.2 and Visual Studio 2019 version 16.11.14. This notably includes several proposals approved as Defect Reports (DRs) by the C++ Standard Committee against the C++20 Standard Library that made extensive design changes to and as recently as October 2021. You can now use the complete list of C++20 features in production in a binary compatible way with other supported language version modes. C++20 Complete... Again??!? We previously announced that MSVC had complete...
OpenMP Task Support for C++ in Visual Studio
The MSVC compiler adds support for OpenMP tasks with the /openmp:llvm flag.
Pure Virtual C++ 2022 is Today
Pure Virtual C++ 2022 is today at 14:00 UTC! Join us on Learn TV for a free one-day virtual conference for the whole C++ community. You can find the schedule here.

Customizing GitHub Codespaces for C++ Projects
A walkthrough for creating a GitHub Codespace, customizing the Codespace development container, and configuring Visual Studio Code for developing in a C++ project such as microsoft/vcpkg-tool.
Pure Virtual C++ 2022 Pre-Conference Sessions Available
Our pre-conference sessions for Pure Virtual C++ 2022 are now online. Find them here, and hope to see you at the main event on 26th April! Session list: There's one session on Visual Studio for Unreal Engine and Game Developers which will be uploaded soon.
vcpkg April 2022 Release: artifacts merged to tool repo, tar.exe in Windows 10, GIT_ASKPASS, vcpkg in Arch Linux instructions, and more
The April 2022 release of the vcpkg package manager is available. This blog post summarizes changes from March 1st, 2022 to March 30th, 2022 for the microsoft/vcpkg and microsoft/vcpkg-tool GitHub repos. Some stats for this period: Notable Changes vcpkg artifacts merged into Microsoft/vcpkg-tool repo vcpkg artifacts is our preview experience for acquiring binary packages, intended for developer tools like compilers, platform SDKs, and debuggers. This is a major step towards accepting external contributions for the vcpkg artifacts feature. PR: Microsoft/vcpkg-tool#428 &n...
What’s new for C++ Debugging in Visual Studio Code

It’s been a minute since our last blog post about C++ in VS Code, but we’ve been working hard on new features and bug fixes! Today, we’re excited to fill you in on the latest and greatest C++ debugger improvements in VS Code, including support for the Apple M1 chip, data breakpoints, and a new run/debug play button! Apple Silicon ARM64 (M1 chip) Last year, we enabled language server support for Apple Silicon ARM64 architecture, which meant you could run the C++ extension’s language server (responsible for things like IntelliSense, code navigation, and autocomplete) natively on the Apple M1 chip. At the time, th...
Pure Virtual C++ 2022 Schedule Available
Pure Virtual C++ 2022 is a free, one-day virtual conference for the whole C++ community. The schedule is now available. You can find the full set of abstracts, alongside calendar files to download on the website. All times UTC on the 26th April. Yes, I know the times look a bit weird, it'll work out on the day! Look forward to seeing you there!
New Enumeration Checks in Visual Studio 2022 version 17.2 Preview 3
New Enumeration Checks in Visual Studio 2022
Sign Up for the Pure Virtual C++ 2022 Conference
In the last couple of years we have run Pure Virtual C++, a free one-day virtual conference for the whole C++ community. This month we're doing it again! Sign-up for free on the website to be the first to hear about our program schedule, access our extra on-demand C++ demos, and get more virtual surprises. The live event will run April 26th 14:00-17:00 UTC on Microsoft Learn TV. It will also be streamed to YouTube and videos will be available to watch after the event. The full program will be announced soon, but expect content on C++23, modules, static analysis, embedded C++, and some fun C++ corners yo...
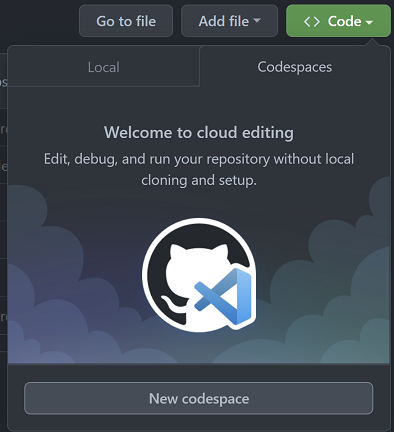
Using GitHub Codespaces and Visual Studio Code for C++ Development
GitHub Codespaces and Visual Studio Code lower the barrier to entry for developing C++-based applications and libraries.
Enhancing Game Developer Productivity with Visual Studio 2022
In this blog, we will discuss how much faster you can get to code with speedier C++ IntelliSense ready and opening a file. Learn how search improved with faster with C++ Find All References and indexed Find in Files.
C++ Modules in CMake with Visual Studio

We’ve seen a lot of excitement around C++ modules since we announced support in the Microsoft C++ compiler and Visual Studio. Ever since, the community has been asking us when CMake support was coming. I am happy to announce that Visual Studio 2022 17.2 Preview 2 has experimental support for C++ modules in CMake projects. One caveat for this early support, is that you must use the Visual Studio (MSBuild) generator. If you want to try it out, you can download the latest preview of Visual Studio today. We are looking forward to hearing your feedback about how modules work in your CMake projects. C++ modules are ...

Visual Studio for remote macOS C++ development
The latest preview version of Visual Studio is now available to download. In this latest release, users wishing to develop cross platform C++ applications for macOS can now make use of Visual Studio’s Linux tools with CMake to target the Mac. There is some setup required on the Mac side to enable the support, but then the Mac is treated just as any other remote (Linux) target by Visual Studio. Installation To get started install the latest preview release of Visual Studio 2022 and select the Linux and embedded development with C++ workload. The components you need are selected by default. Setup on the...
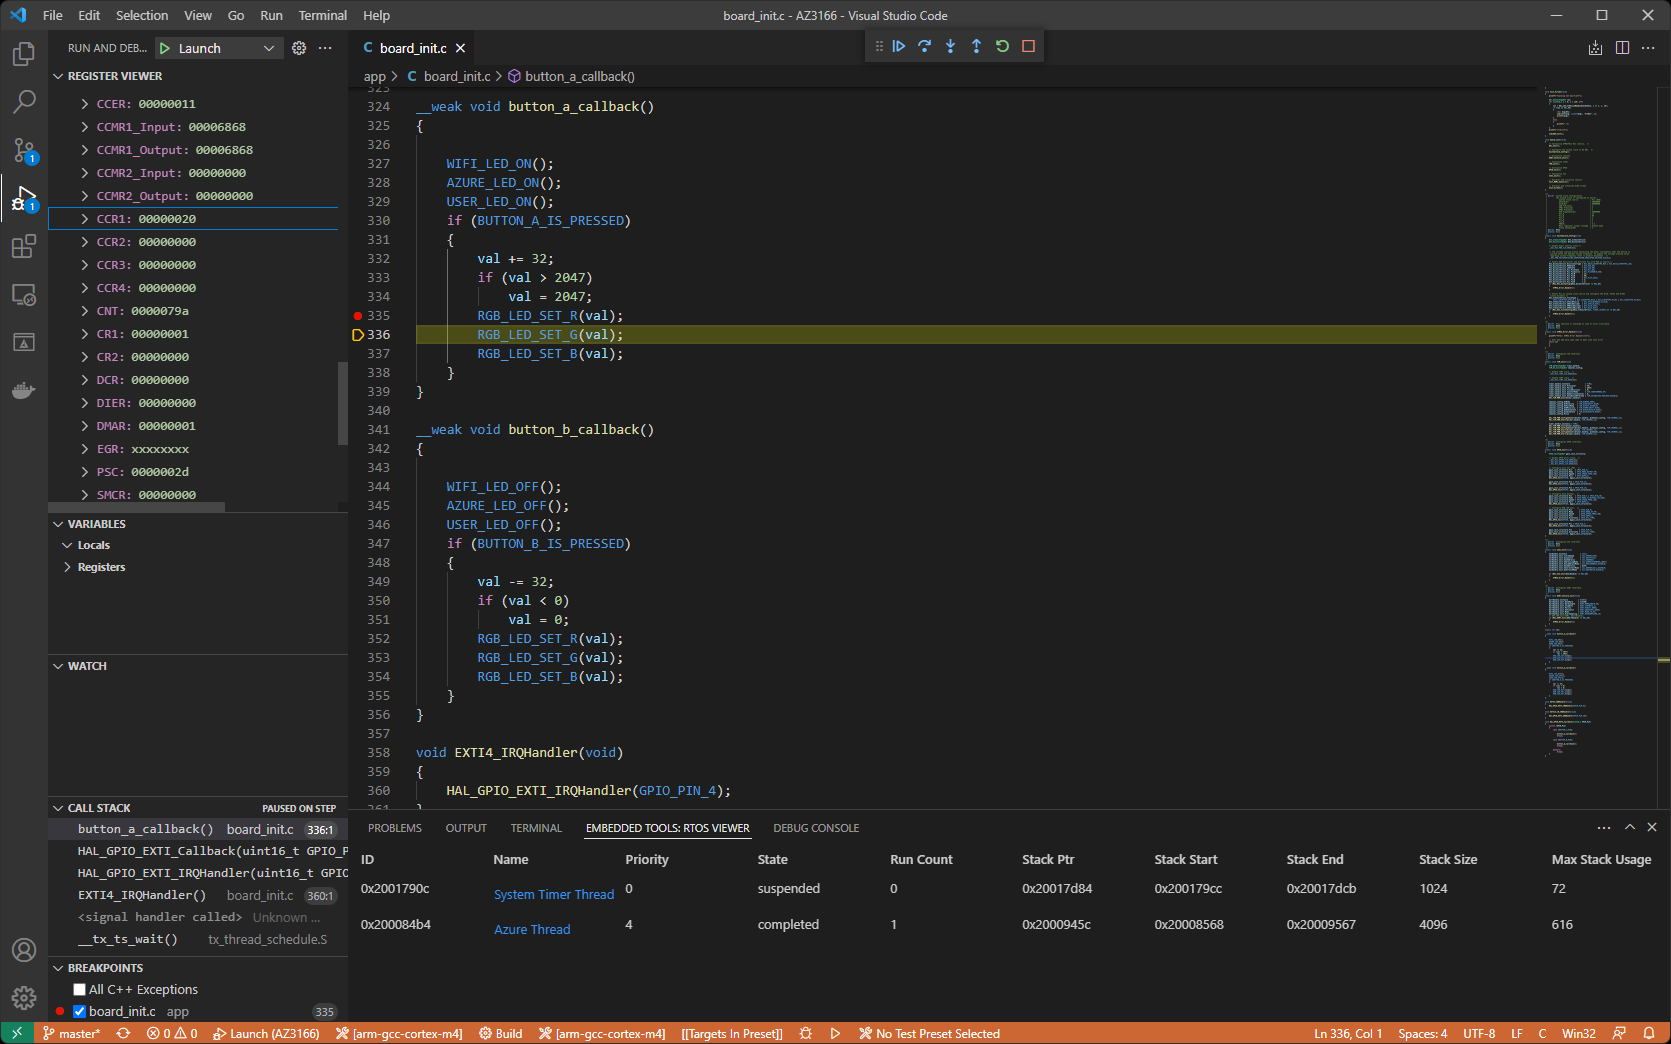
Embedded Software Development in Visual Studio Code
In this post we will walk through the new Visual Studio Code Embedded Tools extension. We'll show how to acquire embedded tool dependencies with vcpkg then edit, build, deploy, and debug an Azure RTOS ThreadX project highlighting the new peripheral register and RTOS object views.
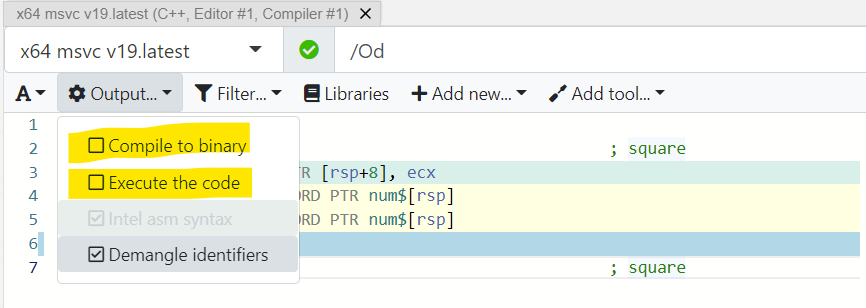
Execution and Static Analysis Support for MSVC on Compiler Explorer
Compiler Explorer is a popular resource for visualizing the assembly output of various compilers, trying out different compiler versions and flags, and testing many popular libraries. We're pleased to announce that, as of today, code execution and static analysis are now available for MSVC on Compiler Explorer. Execution on CE has been one of our highest voted tickets on Developer Community, so we hope many of you will find it useful. The static analysis tool provided is the same as offered in GitHub Actions and in the IDE as background code analysis. To enable code execution, tick the "Execute the code" bo...
GSL 4.0.0 is Available Now
GSL 4.0.0 has been released! Here is a summary of the changes.
How we used C++20 to eliminate an entire class of runtime bugs
C++20 is here and has been supported in MSVC since 16.11, but today's post is not about how you can use it, but rather how we used it to effectively eliminate an entire class of runtime bugs by hoisting a check into compile-time. Let's get right into it! Humble beginnings In compiler design one of the very first things you need is a way to convey to the programmer that their source code has an error or warn them if their code might not behave as expected. In MSVC our error infrastructure looks something like this: The way works is that each has a corresponding string entry which represents the text we want...
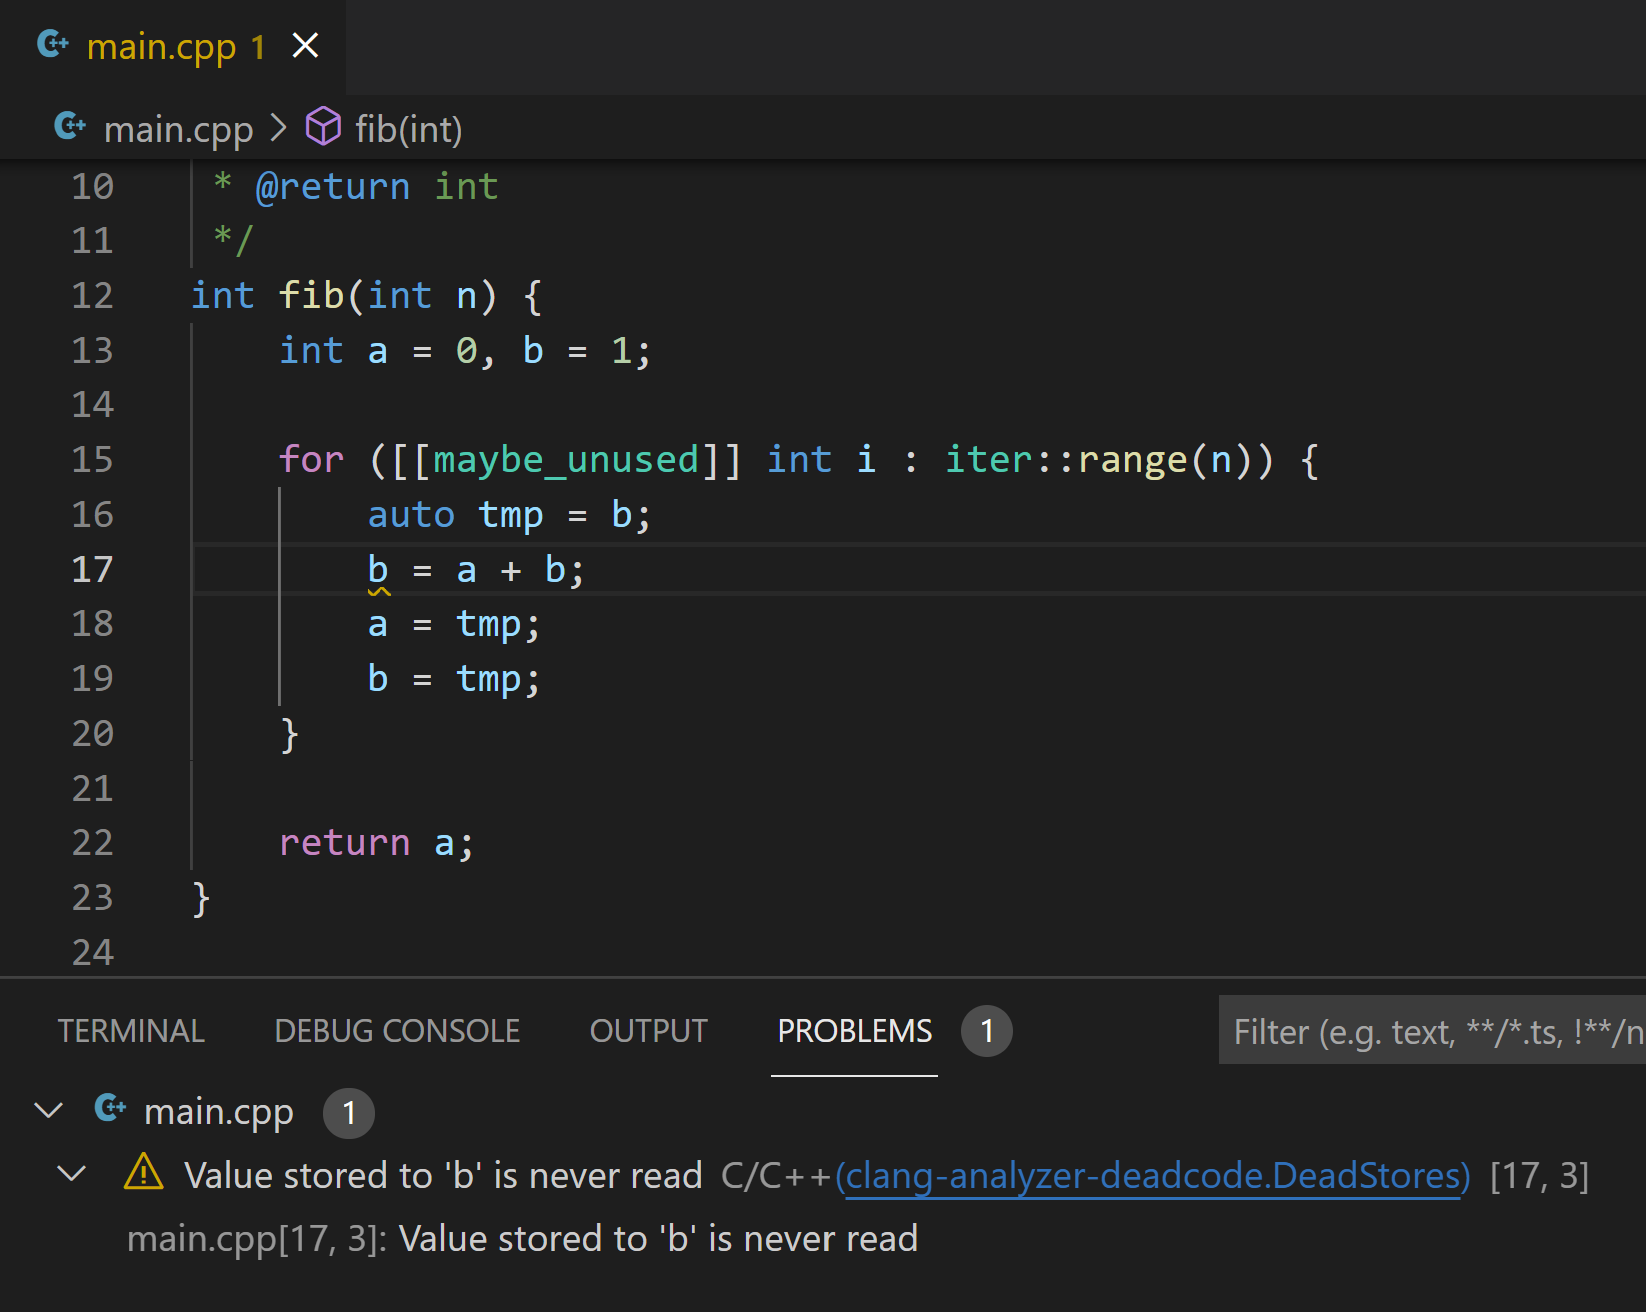
Visual Studio Code C++ December 2021 Update: clang-tidy
The latest insiders release of the C++ extension is here, bringing clang-tidy support to VS Code! Clang-tidy is a clang-based C++ linter tool that detects common errors in your code, like style violations and bugs that can be deduced via static analysis. Clang-tidy integration was one of our top asks on GitHub, so we’re excited to announce that it’s ready for you to try! Getting started Do I need to install clang-tidy? Nope! Clang-tidy now comes bundled with the C++ extension. But if you already have clang-tidy installed (and it’s on your environment’s path), the C++ extension will use that one instead. You ca...
The /fp:contract flag and changes to FP modes in VS2022

The /fp:contract flag and changes to FP modes in VS2022 In this blog we will cover a new feature we have added to the MSVC version 17.0 compiler in VS2022 that impacts the generation of Floating-Point contractions such as Fused Multiply Add (FMA) instructions. We will cover how FMA contractions are supported in pre-VS2022 MSVC compiler releases, a new /fp:contract flag and changes to existing Floating-Point pragmas in VS2022 MSVC compiler allowing explicit control over generation of contractions A contraction, as used here, is where two operations in the source code are performed by a single instruction in th...
Microsoft Visual Studio 2022 and Floating-point to Integer Conversions

Microsoft Visual Studio 2022 and Floating-point to Integer Conversions Quick Summary: See also the MSDN documentation on /fpcvt here. Introduction As some of you may be aware, Microsoft Visual Studio 2019 changed some floating-point to integer conversions for Intel Architecture (IA). When targeting 32-bit IA (x86), most conversions match the Intel AVX-512 conversion instructions. For signed integers this is the same as Visual Studio 2017. With unsigned integers the results of invalid conversions can be different, as I will explain later. With 64-bit IA (x64), the AVX-51...
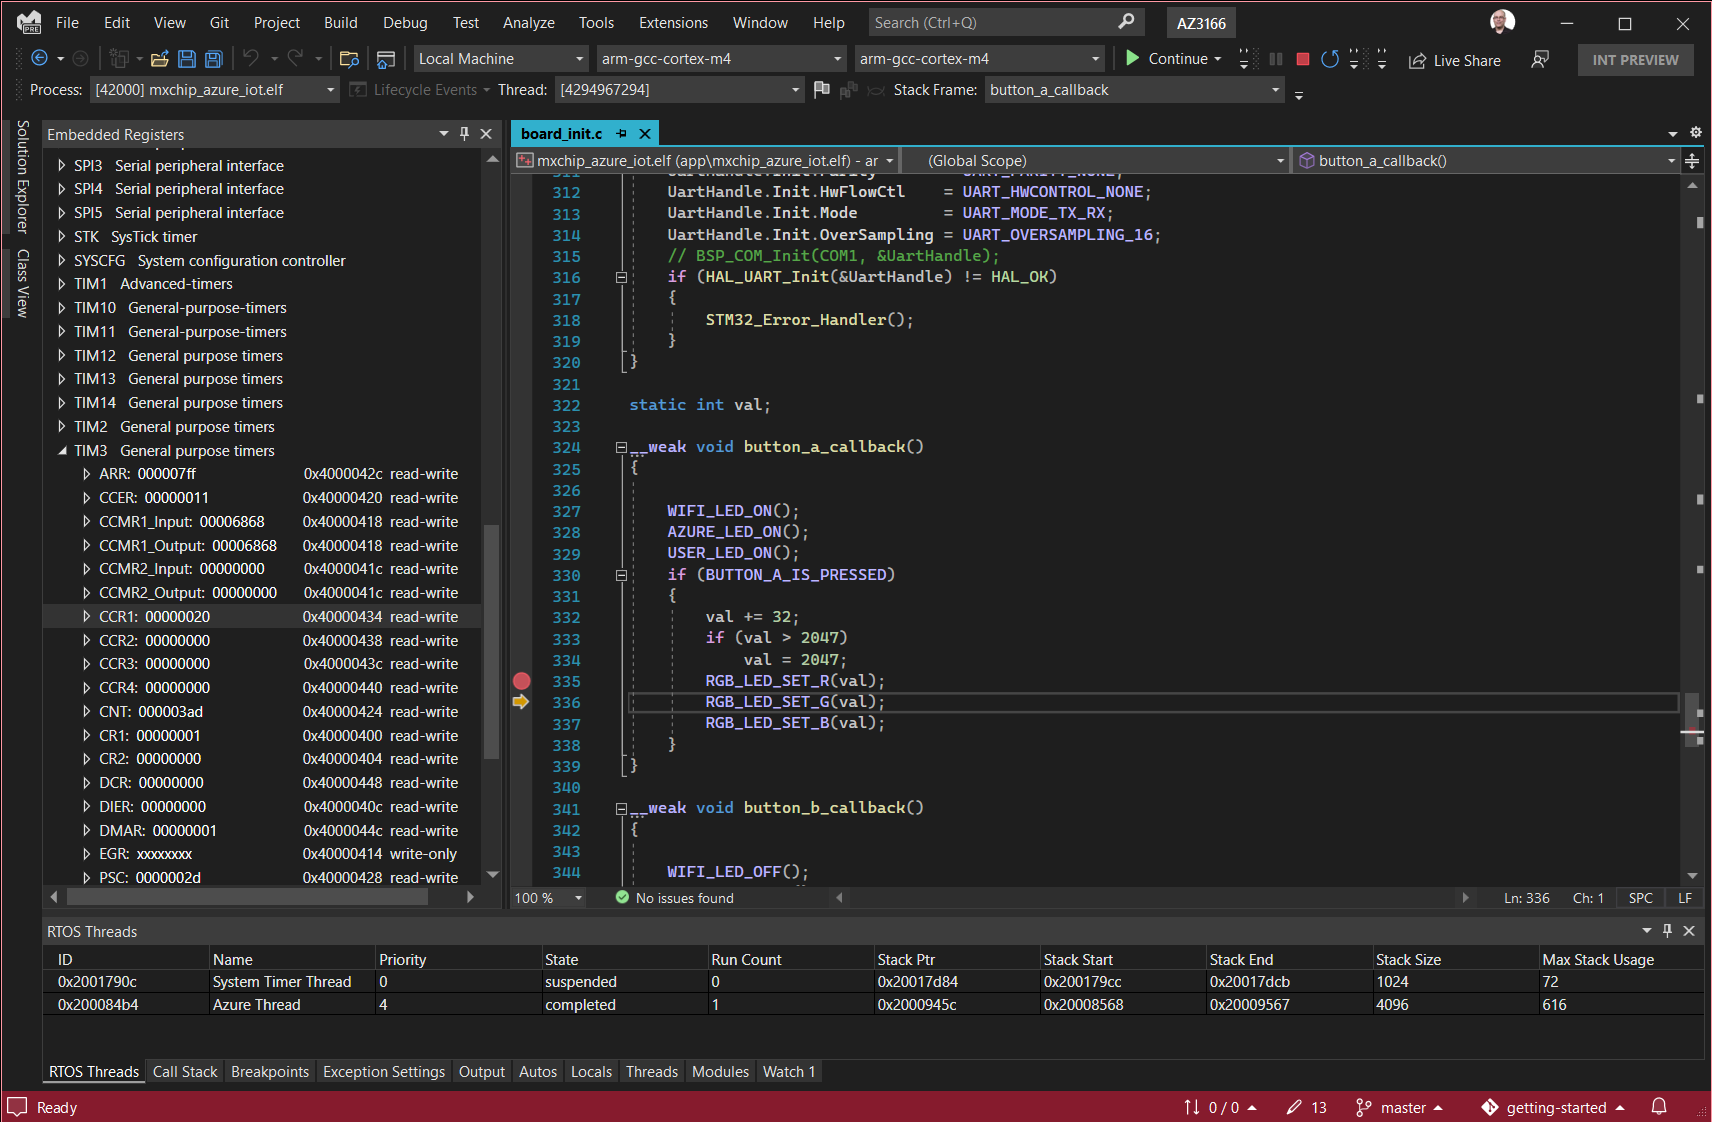
Embedded Software Development in Visual Studio
In this post we will walk you through Visual Studio installation of the embedded workload, how to acquire embedded tool dependencies with vcpkg, then demonstrate edit, build, deploy, and debugging directly in Visual Studio with new peripheral register and RTOS object views. We will demonstrate all of this with an Azure RTOS ThreadX project.
Bootstrap your dev environment with vcpkg artifacts
Updated May 11, 2022: Using your own registry section revised to reflect metadata format changes. We are happy to announce a new experience for acquiring artifacts using vcpkg. We define an artifact as a set of packages required for a working development environment. Examples of relevant packages include compilers, linkers, debuggers, build systems, and platform SDKs. With this important change, vcpkg can not only download and build your libraries from source, it can also bootstrap the rest of your environment, acquiring pre-built binary dependencies for your projects. The experience is in preview and curre...
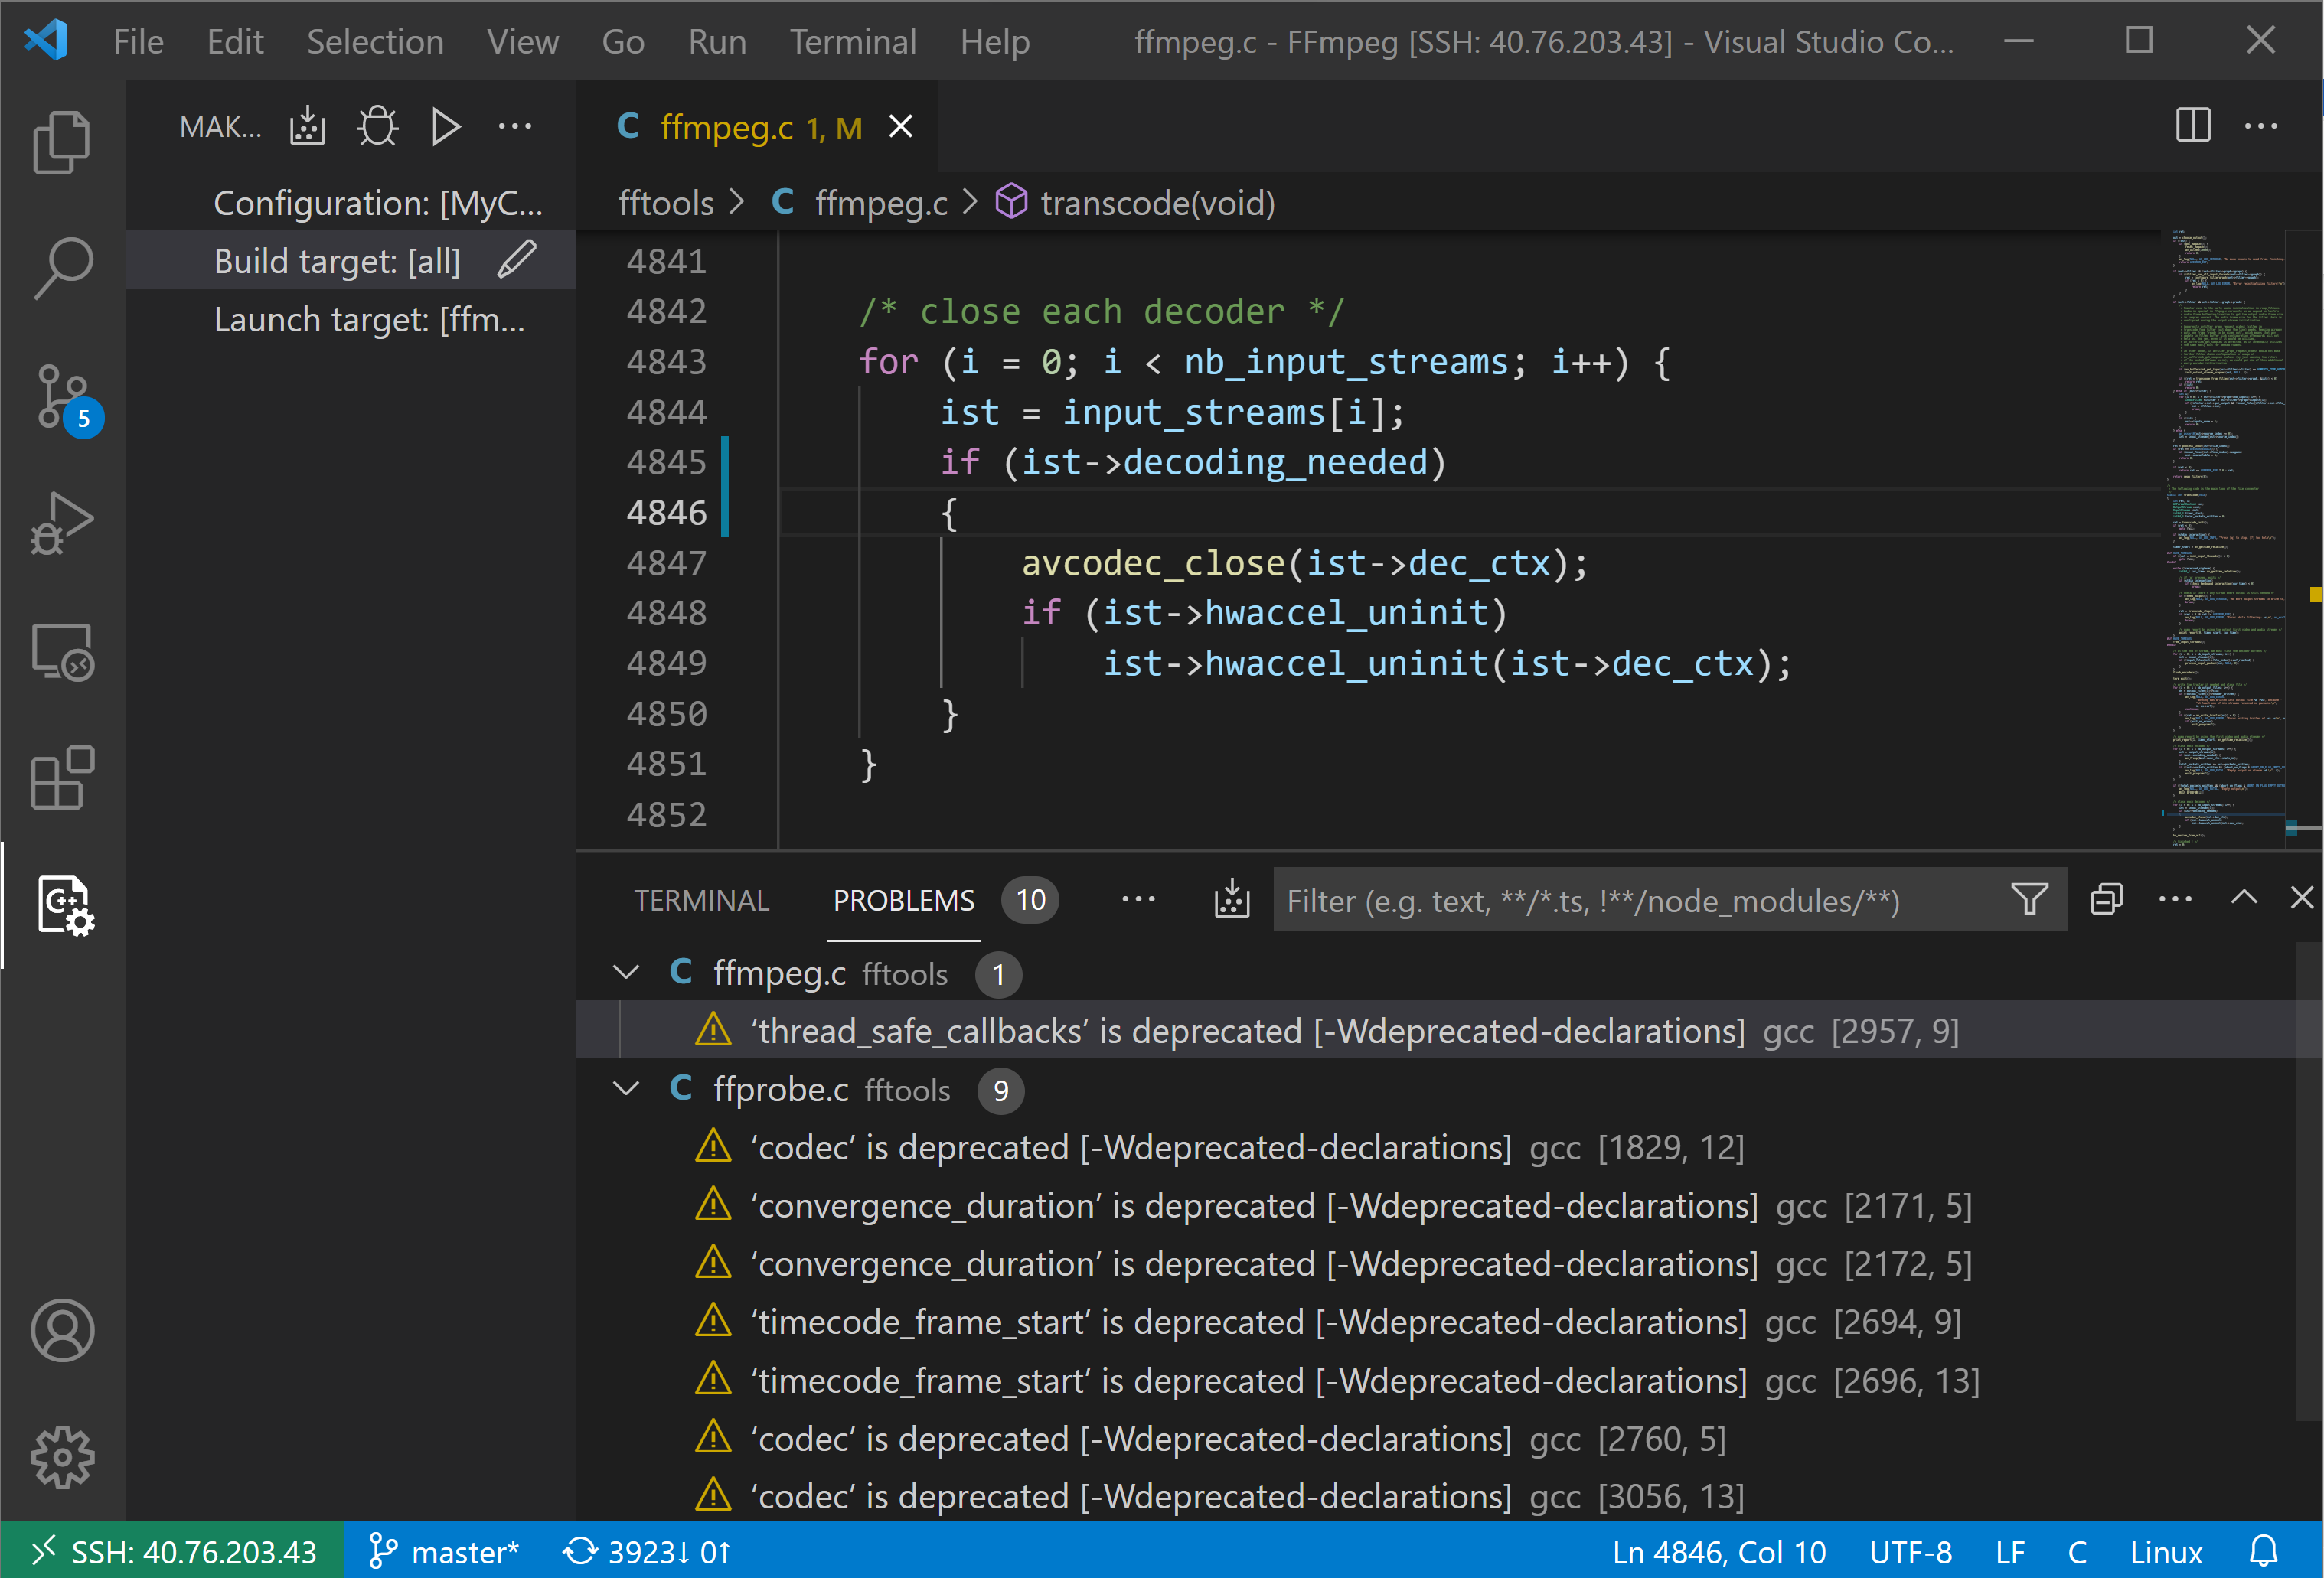
Makefile Tools December 2021 Update: Problem Matchers and Compilation Database Generation
The December 2021 update of the Makefile Tools extension for Visual Studio Code is here, bringing you support for problem matchers (to easily view errors and warnings in the editor), the ability to generate a compile_commands.json file for your project, and a bunch of other enhancements and bug fixes! To find out more about all the enhancements, check out our release notes on GitHub. Problem matchers If you’ve used the C++ extension for VS Code, you’re probably familiar with the Problems panel, where you can navigate through a list of compiler errors and warnings found in your project. VS Code uses a problem ma...
C++ build throughput investigation and tune up

Building C++ code is a complex process, launching many build tools in parallel and often running for a long time. It is always desirable to make it faster, but also a challenge to understand what the most effective way would be to achieve this. We’d like to share some techniques we use to get a "bigger" picture of the build, as well as tools that can help to see what is taking time in a particular part of the build. We’ll also talk about MSBuild project options which can improve build parallelism without overwhelming the system, as well as other (not immediately obvious) options which might affect build throug...

What’s new for C++ cross-platform developers in Visual Studio 2022
Visual Studio 2022 is available now! Check out the video below to learn what’s new for C++ developers who are building for more than just Windows, or who are developing with an eye to open source. This video covers: Contact us Have questions or comments about Visual Studio 2022? Want to share feedback with our team? You can contact us at visualcpp@microsoft.com or on Twitter (@VisualC). The best way to file a bug or suggest a feature is with the Send Feedback button in the upper right-hand corner of the IDE. See How to report a problem with Visual Studio or Visual Studio Install...
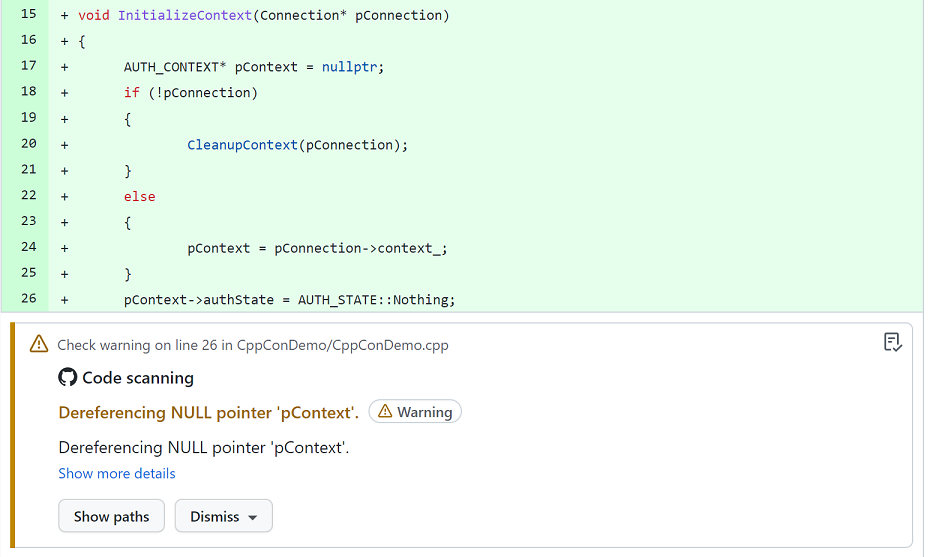
Microsoft C++ Code Analysis with GitHub Actions

Summary of your post, shown on the home page next to the featured image
18x Faster IntelliSense for Unreal Engine Projects in Visual Studio 2022
We joined forces with Epic Games to bring faster semantic highlighting and IntelliSense ready to Visual Studio 2022 for Unreal Engine developers. In this blog post, we will detail how we worked with the Unreal Engine team to significantly speed up IntelliSense ready by 18x.
Microsoft C++ Team at CppCon 2021
The Microsoft C++ team has an exciting lineup of sessions at CppCon 2021. Many of us will also be present at our team’s booth in the main hall for the first two days of the conference. Come say hi and let us know if you have any questions about our talks, products, or anything else! You can also join the #visual_studio channel on the CppCon Discord to talk to us. We’re also running a survey on the C++ ecosystem. If you have a moment, please take our survey, it's quick. Here’s the lineup: Monday, October 25th 15:15 – 16:15 (MDT): Implementing C++ Modules: Lessons Learned, Lessons Abandoned by Gabrie...
A Race Condition in .NET Finalization and its Mitigation for C++/CLI
Race conditions can occur in .NET finalization. This article explains the solution implemented in MSVC.
Improved Null Pointer Dereference Detection in Visual Studio 2022 version 17.0 Preview 4
Improved Null Pointer Dereference Detection in Visual Studio 2022
Static Analysis Fixes in Visual Studio 2019 version 16.11
List of Code Analysis Fixes in Visual Studio 2019 16.11
MSVC C++20 and the /std:c++20 Switch
We are excited to announce that in Visual Studio 2019 version 16.11, we have added the switch to the set of language mode switches available. The addition of this switch indicates that we’ve reached a point of sufficient stabilization of the MSVC C++20 feature set for it be used in production, with full support in VS servicing updates. This blog post focuses on describing our level of C++20 feature support, compiler-supported extensions, and the remaining feature set differences between MSVC and the ISO C++ standard as of Visual Studio 2019 version 16.11 and Visual Studio 2022 version 17.0 C++ Language Modes...
C++20 Coroutine Improvements in Visual Studio 2019 version 16.11

This post includes contributions from Terry Mahaffey and Ramkumar Ramesh. We last blogged about coroutine support in Visual Studio 2019 version 16.8. In the releases since 16.8 we've introduced several new coroutine features and improvements. This post is a round up of those improvements, all available in Visual Studio 2019 16.11. Debugging Improvements Since Visual Studio 2019 version 16.9, stepping into a coroutine call will now land directly in the coroutine body (unless it is set to initially suspend, in which case the step becomes a “step over”). Stepping over a will land in the logical statement f...
New Compiler Warnings for Dynamic Initialization and User Defined Sections
We've added two new warnings to MSVC for misuses of binary sections reserved for the compiler. This short post will explain the issues which they warn against, and potential fixes for your code. The MSVC C++ compiler provides several ways to create sections and place data in them. The linker will convert them into the 'sections' in the PE (Portable Executable) format. The compiler also creates some sections itself. One example is the section , which is used to implement C++ dynamic initialization (there are other sections for this purpose, too). The name of the section is mentioned in articles like CRT Init...

Attach to a Remote Process with LLDB in Visual Studio 2022 Preview 3
You can now use Attach to Process to remote debug processes with GDB or LLDB in Visual Studio. The ability to attach to a process running on a remote system with GDB was added in Visual Studio 2019. The ability to attach to a process with LLDB is new in Visual Studio 2022 Preview 3. Remote debugging in Visual Studio is especially valuable for teams who write cross-platform C++ code that runs on Windows and Linux or macOS. For example, if you use Windows + Visual Studio as your primary development environment, then you may need to occasionally debug code running on Linux or macOS. Rather than switching platform...
ARM64EC Support in Visual Studio
ARM64EC (“Emulation Compatible”) is a new application binary interface for building apps for Windows 11 on ARM. With ARM64EC, you can build new native apps that can run on ARM or incrementally transition existing x64 apps to native performance on ARM. With Visual Studio, you can start building your projects as ARM64EC and enjoy the benefits.
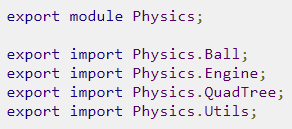
Moving a project to C++ named Modules
There is a lot of hype (and perhaps restraint) to using modules in projects. The general blocker tends to be build support, but even with good build support there is a distinct lack of useful resources for practices around moving projects to using named modules (not just header units). In this blog we will take a small project I created, analyze its components, draft up a plan for modularizing it, and execute that plan. Overview Tools used For the purposes of this project, we will be using the following tools: Project description I remember when I was young...
Edit Your C++ Code while Debugging with Hot Reload in Visual Studio 2022
In Visual Studio 2022 Preview 2, we are happy to announce that Hot Reload is now supported for C++. Hot Reload for C++, powered by Edit and Continue, is a new way of editing your code during debugging.
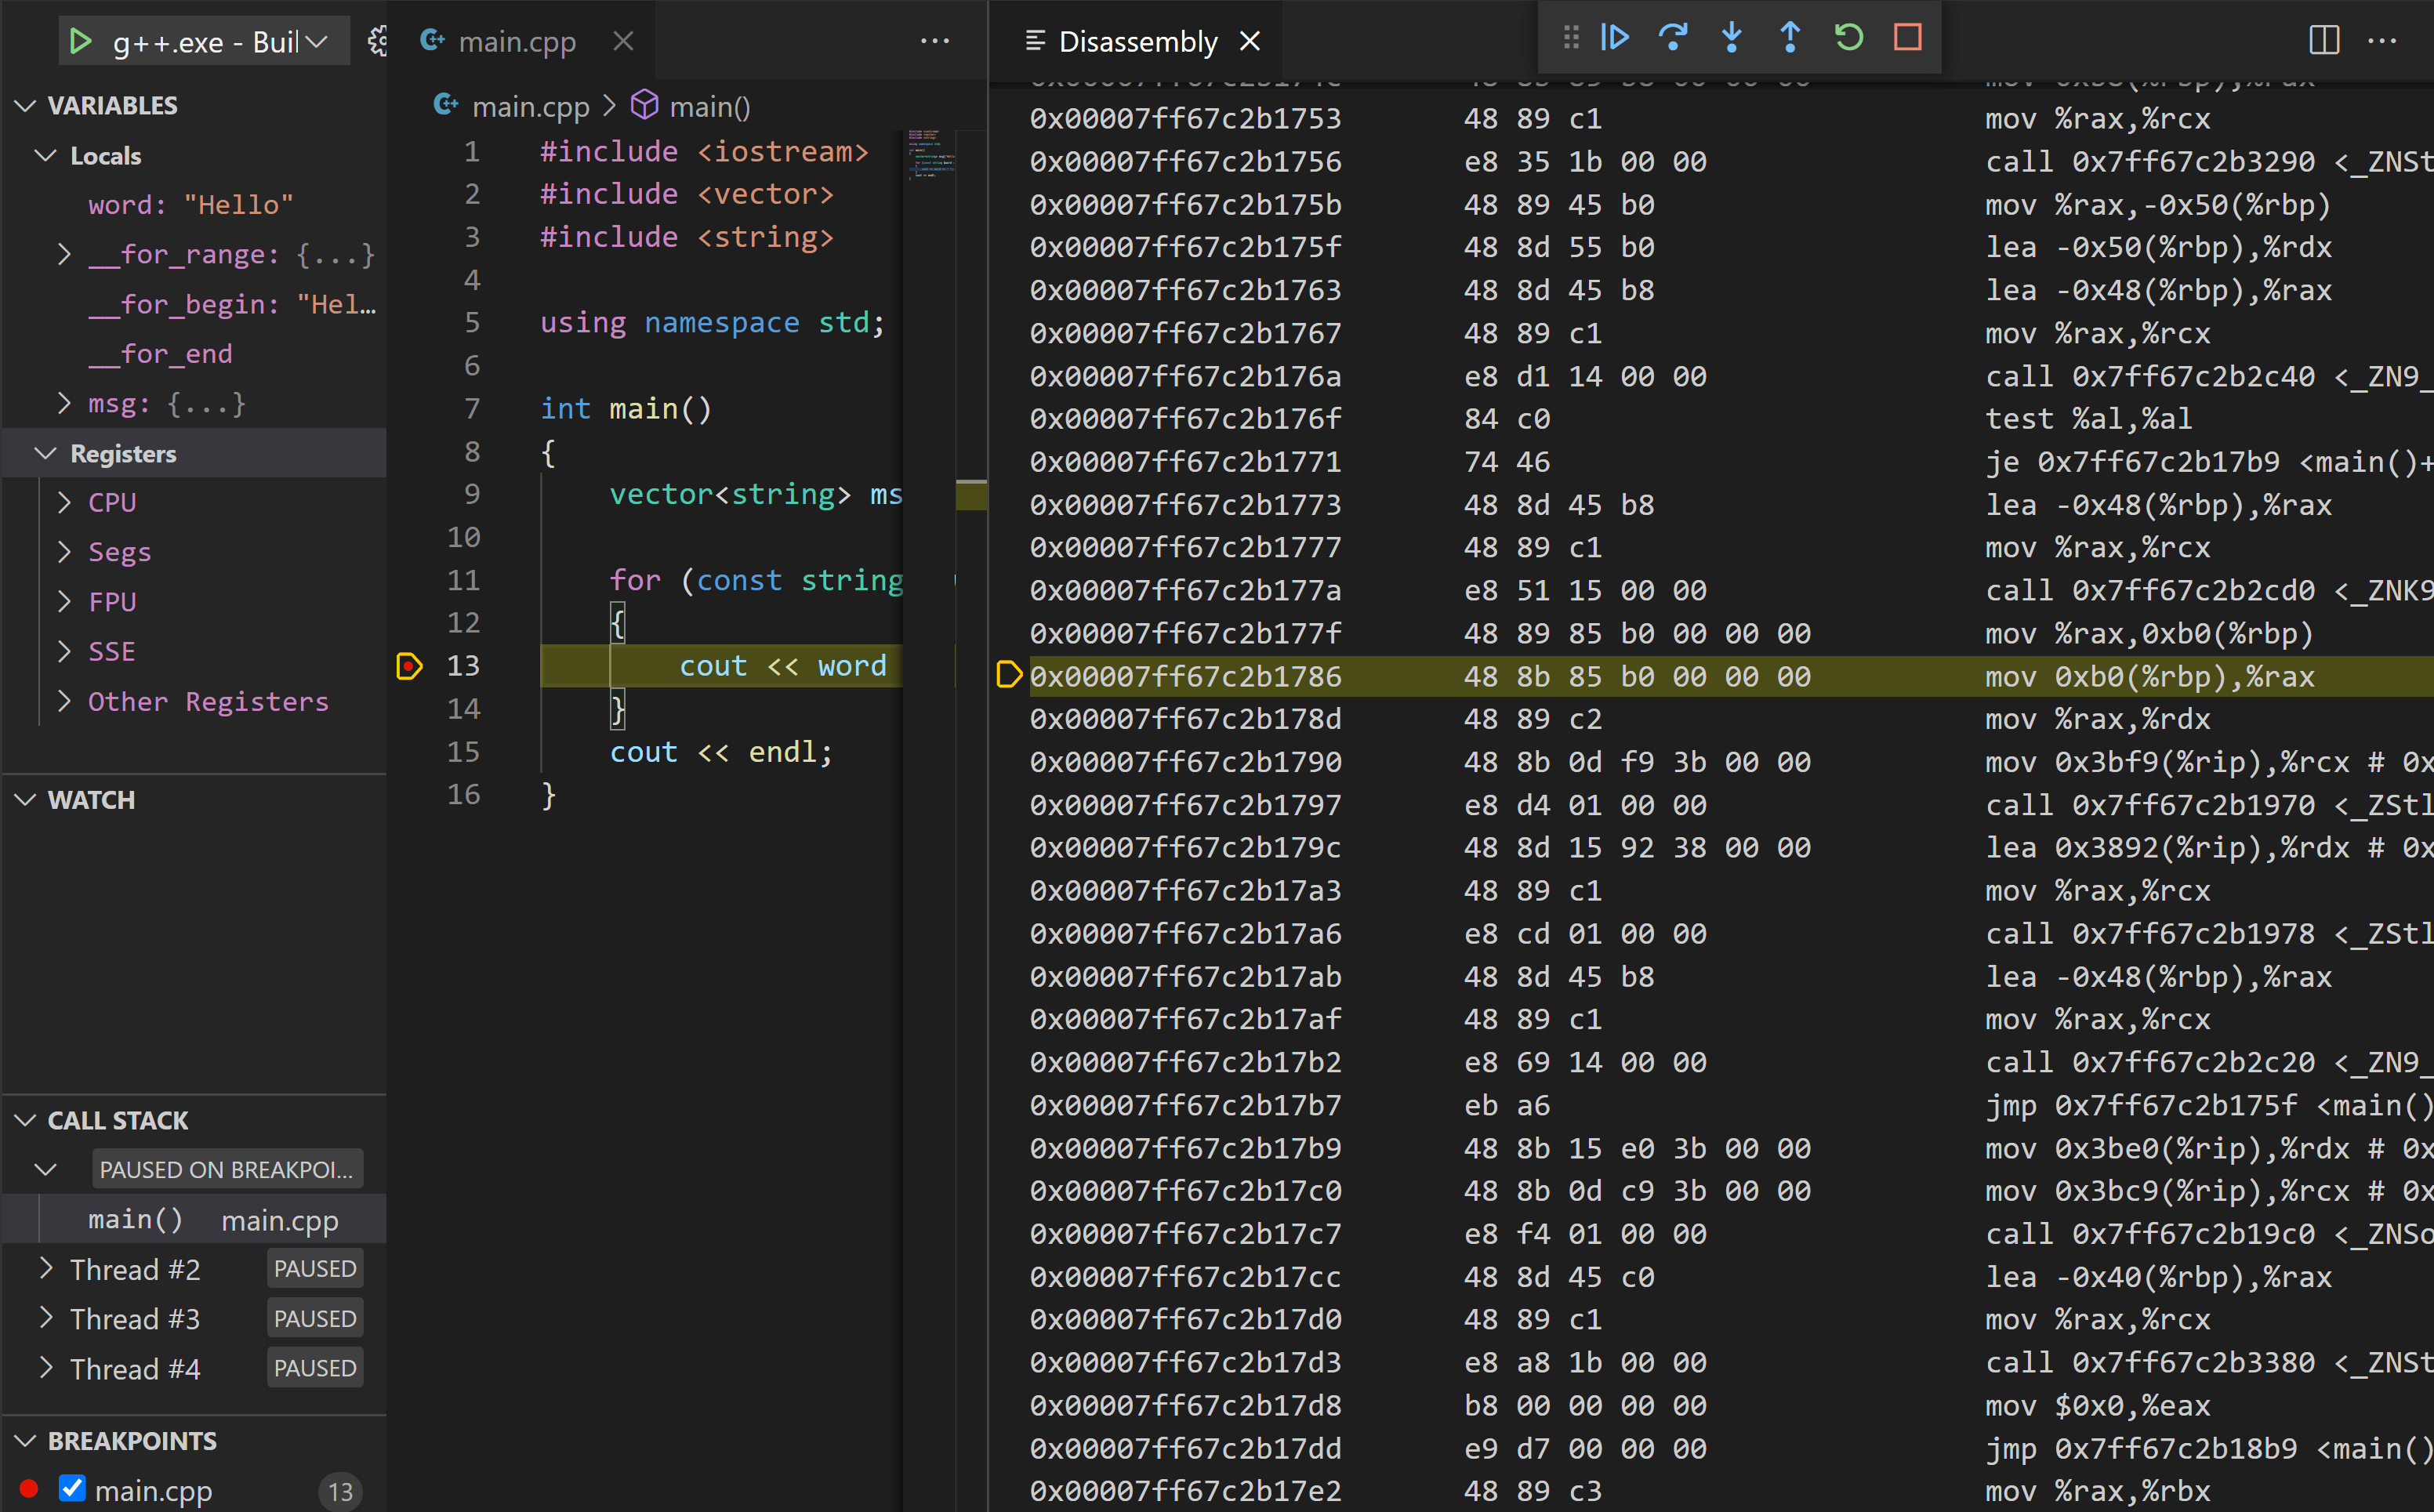
Visual Studio Code C++ July 2021 Update: Disassembly View, Macro Expansion and Windows ARM64 Debugging
The July 2021 update of the C++ extension for Visual Studio Code is here, bringing you brand new features— such as a Disassembly View while debugging, inline macro expansions, and debug support for Windows ARM64 architecture—along with a bunch of enhancements and bug fixes. To find out more about all the enhancements, check out our release notes on GitHub. Disassembly View We’re excited to announce that Disassembly View— our #1 upvoted GitHub issue (#206)— is publicly available in VS Code Insiders! Disassembly View allows you to debug assembly code corresponding to the instructions created by your compiler. It’...
Using C++ Modules in MSVC from the Command Line Part 1: Primary Module Interfaces
In this three-part series we will explore how to build modules and header units from the command line as well as how to use/reference them. The goal of this post is to serve as a brief tour of compiling and using primary module interfaces from the command line and the options we use. Note: This tutorial will focus primarily on dealing with IFC and object file output. Other types of compiler output such as PDB info are not mentioned. Overview Summary of C++ modules options Basics of building a module interface For the content in this section, we will assume that you have an appropriate ...
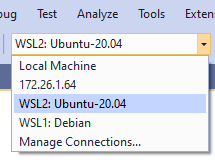
Build and Debug C++ with WSL 2 Distributions and Visual Studio 2022
Visual Studio 2022 introduces a native WSL 2 toolset for C++ development. This toolset is available now in Visual Studio 2022 version 17.0 Preview 2. WSL 2 is the new, recommended version of the Windows Subsystem for Linux (WSL) architecture that provides better Linux file system performance, GUI support, and full system call compatibility. Visual Studio’s WSL 2 toolset allows you to build and debug C++ code on WSL 2 distros from Visual Studio without ever adding an SSH connection. You can already build and debug C++ code on WSL 1 distros using the native WSL 1 toolset introduced in Visual Studio 2019 version 1...
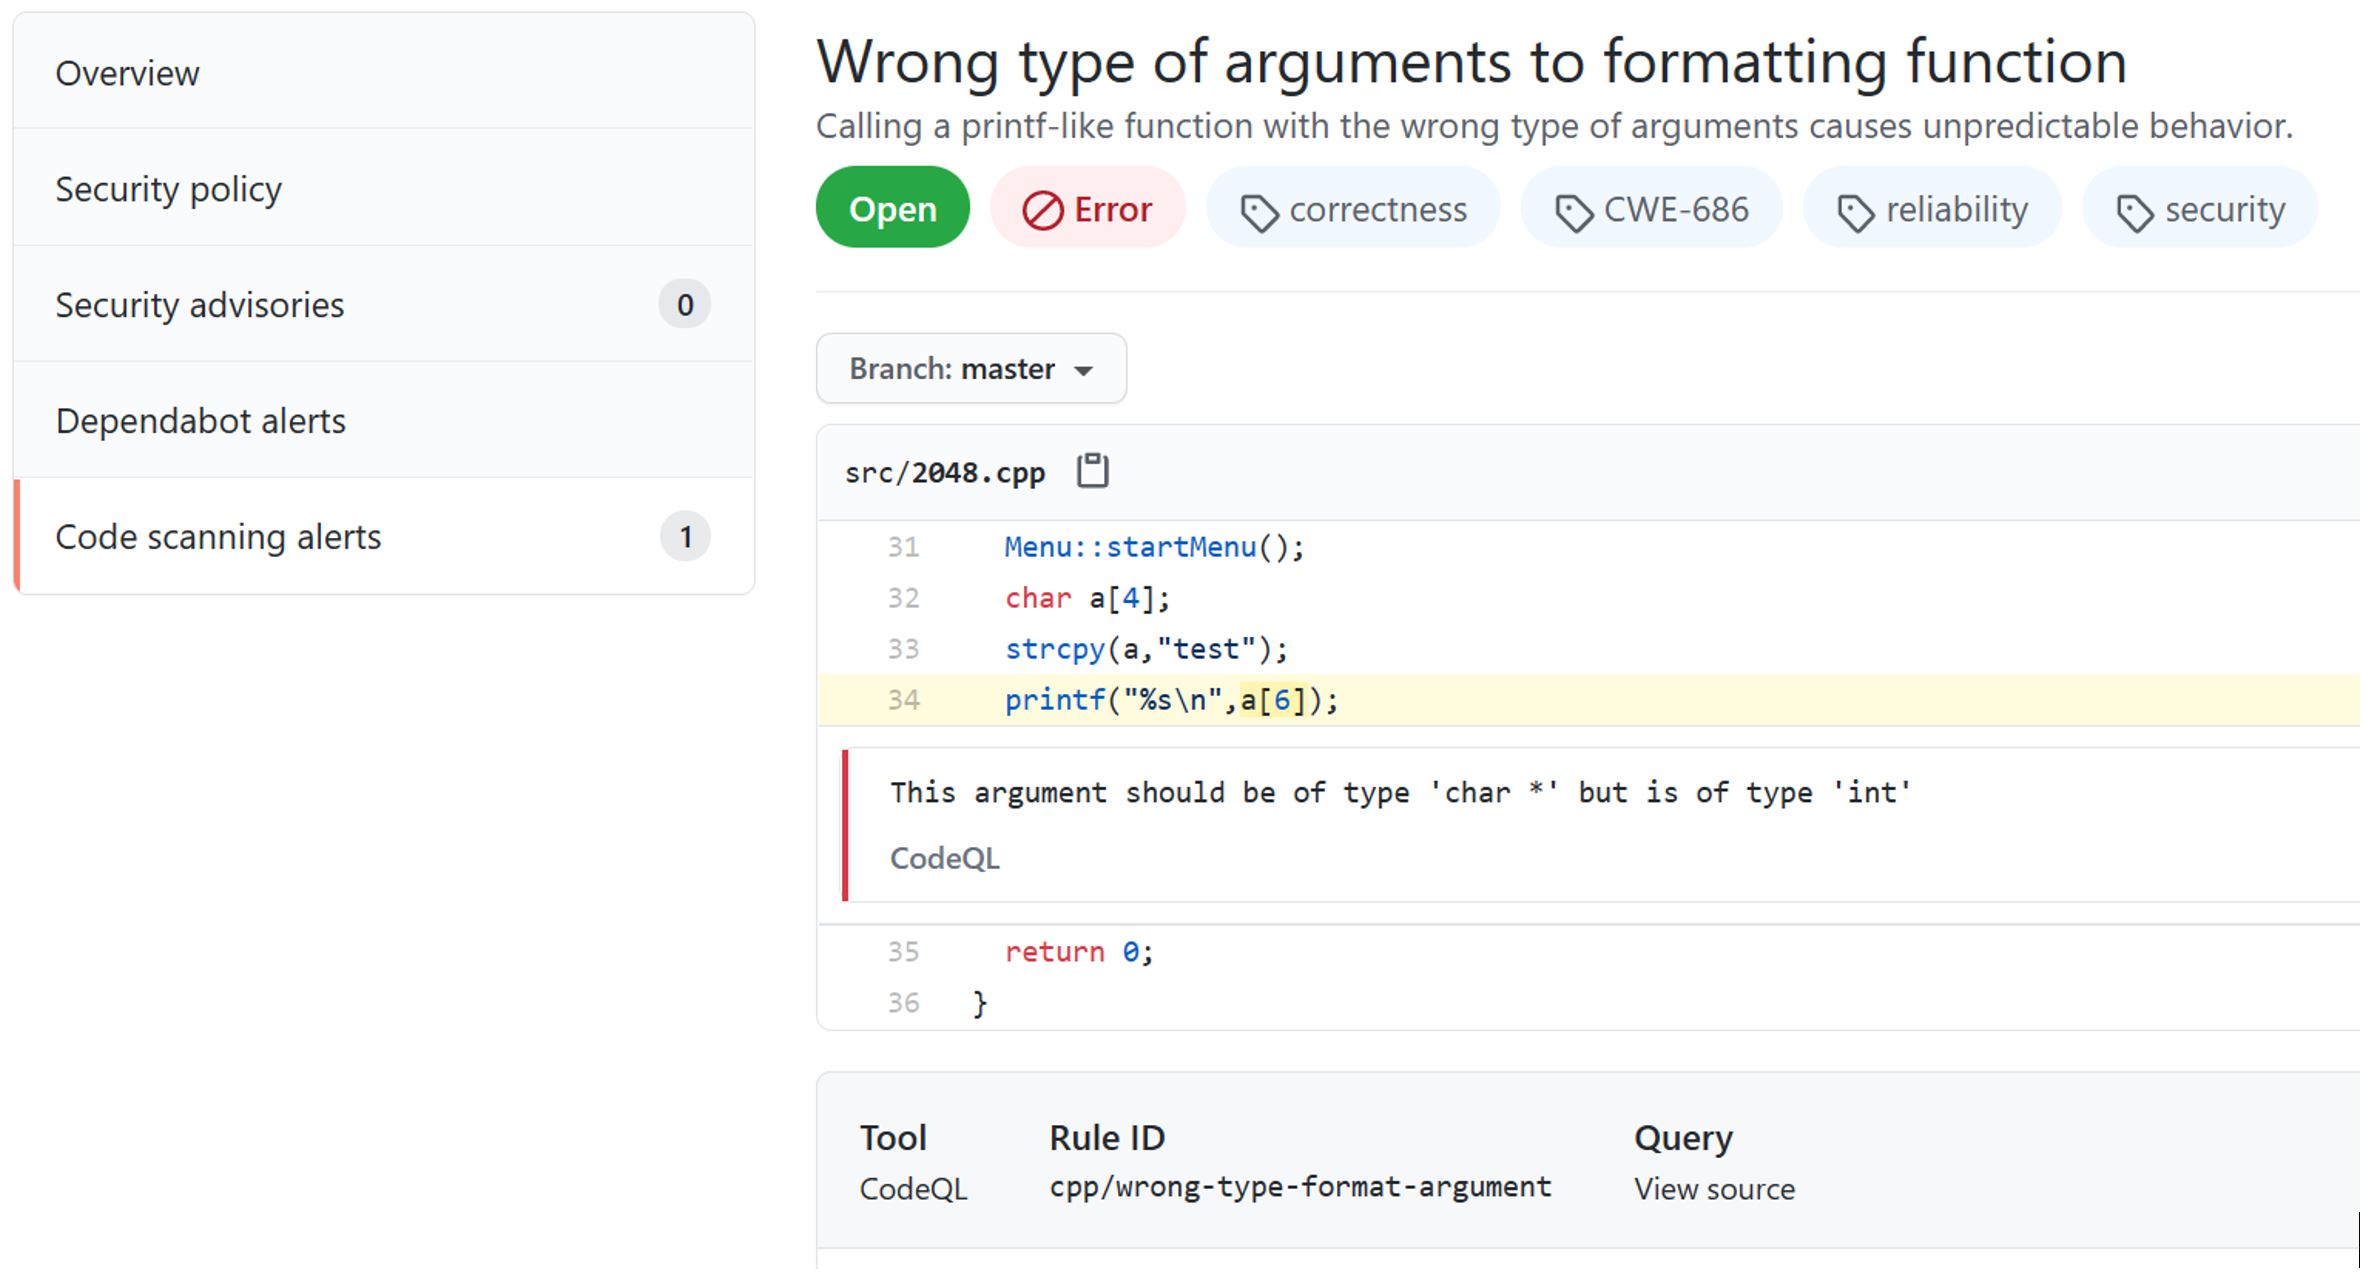
Code Scanning C++ with GitHub Actions

Last year, GitHub released code scanning, which enables developers to incorporate security checks into their CI/CD environment and developer workflow. This post demonstrates the basics of using CodeQL, the analysis engine behind code scanning, with GitHub Actions. What is CodeQL? CodeQL is an analysis engine that automates security checks by running queries against a database generated from your codebase. This CodeQL database is created during the build process and represents the source code in relational form. By default, code scanning runs standard CodeQL queries written by GitHub researchers and the communit...
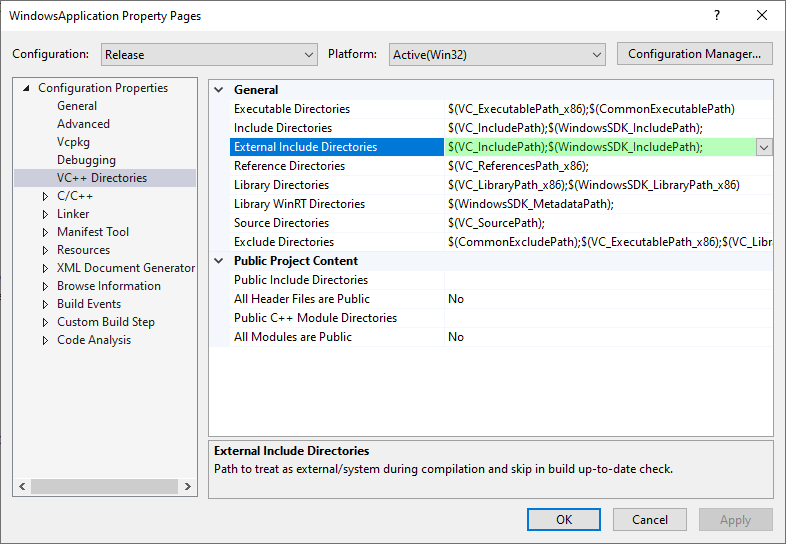
Customized Warning Levels and Code Analysis for External Headers
If you have tried to keep your code clean by selecting strict compiler warning levels or code analysis rulesets, you likely know how frustrating it can be to see these warnings for headers that are not part of your project. To alleviate this, we’ve made it easy to mark headers as external to your project in the latest preview Visual Studio 2019. This is something we have been working on for a while with help and feedback from the community. Some of you may remember our previous post, Broken Warnings Theory, when we added experimental external header support to the Microsoft C++ Compiler. I’m happy to announce tha...
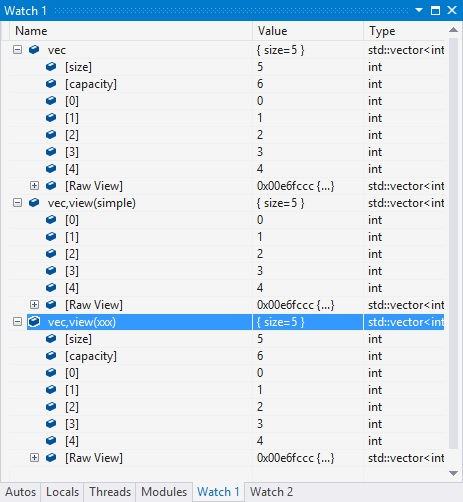
STL Visualizers on GitHub
We are happy to announce that now it’s possible to contribute to the STL Visualizers for Visual Studio's debugger on GitHub. A visualizer is a file with .natvis extension that allows you to manipulate the way native types appear in the debugger's watch window. We've been working on fixing existing issues with the visualizers and augmenting them, but with C++20 coming with new types, they have been falling behind. We decided to open source them so that the community can benefit and collaborate. What’s Available? The file is now in the GitHub repo under stl\debugger\STL.natvis. We also have...

Address Sanitizer Now in “Early Release” for Xbox Developers
Address Sanitizer is now available on Xbox, developers can leverage this powerful technology to help debug memory issues in their titles. Combined with the crash dump changes detailed here, it should provide all the flexibility required to support your automated tests suites and enable you to find issues quickly and easily.
Static Analysis Fixes, Improvements, and Updates in Visual Studio 2019 version 16.10
The C++ static analysis team is committed to making your C++ coding experience as safe as possible. We are adding richer code safety checks and addressing high impact customer feedback bugs posted on the C++ Developer Community page. Thank you for engaging with us and giving us great feedback on the past releases and early previews leading to this point. Below is the compilation of improvements and bug fixes that were made from Visual Studio 2019 versions 16.9 to 16.10 for code analysis and CppCoreCheck. New features: Analysis crash fixes: Bug fixes and optimizations:...
<format> in Visual Studio 2019 version 16.10
C++20 adds a new text formatting facility to the standard library, designed primarily to replace and friends with a fast and type safe interface. The standardized library is based on the existing {fmt} library, so users of that library will feel at home. Before diving into how works I want to thank Victor Zverovich, Elnar Dakeshov, Casey Carter, and miscco, all of whom made substantial contributions to this feature, and were the reason why we could complete it so quickly. Overview To start using you just need to be using Visual Studio 2019 version 16.10 or later and you need to be compiling with . You can...
C++20’s Extensions to Chrono Available in Visual Studio 2019 version 16.10

While the header has been available as part of the STL since C++11, among the changes included in C++20 there were several extensions to chrono including support for calendrical types, time zones, leap seconds, and integration with format. A great deal of innovation and work was required in order to complete these additional features; shipping these new C++20 additions so soon would not have been possible without the amazing support of the open-source community. In particular, I would like to recognize the significant contributions from Matt Stephanson, statementreply, and Daniel Marshall in helping complete our...
Preview of using CMake Presets for Azure Sphere development
We are happy to announce that CMake Presets preview support is available in the Visual Studio 16.10 release as well as CMake Tools version 1.7 for Visual Studio Code. Erika introduced CMake Presets and why you should use them, this post will focus on how they can be used for Azure Sphere development across Visual Studio, VS Code, and GitHub Actions for consistent build settings across your development team and CI system. Azure Sphere is a comprehensive IoT security solution that is beyond the scope of this article. Azure Sphere projects are CMake based, and application development is in C (get started here)...
C++20 Ranges are complete in Visual Studio 2019 version 16.10
We are proud to announce completion of our implementation of C++20 Ranges in the Standard Library in the VS2019 v16.10 release under. We announced the first useful user-visible parts of Ranges in VS 2019 v16.6 in mid 2020, the trickle accelerated into a gushing stream, and the final parts are now in place. This represents a huge body of work with input from multiple open-source contributors over the last two years. Ironically enough, ranges are nothing new to the Standard Library. STL algorithms have always operated on ranges of elements whose bounds are denoted by an iterator that denotes the first element an...
How to start using registries with vcpkg
For many users of vcpkg, the built-in repository of packages is completely sufficient. If you only need public, non-experimental libraries, the default vcpkg registry is completely fine. However, once you go outside of this world - once you have company-internal libraries, or you want to use experimental libraries, the recommended solution is to use a registry. Quite a few people have already set up their own registries, and if you want to learn to set up your own, you can check out the last blogpost. However, if you want to use an existing registry, this tutorial is for you. We also have reference document...
All vcpkg enterprise features now generally available: versioning, binary caching, manifests and registries
We are announcing today that all major vcpkg enterprise features are no longer experimental. The latest vcpkg release makes versioning, binary caching, manifests and registries generally available to any developer, team or enterprise. We have steadily been adding to vcpkg over the years. What started as a small open source project to migrate developers to newer versions of Visual Studio has expanded into a cross-platform C/C++ library manager with over 1600 libraries that can be used in a wide variety of environments to serve the entire C/C++ ecosystem. In this blog post, we go over the latest vcpkg pr...
Microsoft C++ Code Analysis supports SARIF 2.1
Starting with Visual Studio 16.8, MSVC Code Analysis officially supports SARIF 2.1.0 standard. SARIF is an industry standard for representing static analysis logs and we've been one of the earliest collaborators with the SARIF Technical Committee. Behind the scenes, analysis log files in the SARIF format powers Visual Studio IDE to provide a richer experience that was not possible with the legacy XML logs. In this blog post we will present one of those enhanced experiences – code analysis defects with different severity levels in Error List and color-coded squiggles for offending code segments. What is SAR...
OpenMP Updates and Fixes for C++ in Visual Studio 2019 version 16.10
In our previous blog post about improved OpenMP support in Visual Studio, we announced the addition of the -openmp:llvm switch in Visual Studio 2019 version 16.9 to enable compiled programs to target LLVM’s OpenMP runtime library for the x64 architecture. This switch supports all the OpenMP 2.0 directives that -openmp supports, as well as unsigned integer indices in parallel for loops, and a subset of the SIMD directives that are supported under -openmp:experimental. It also enabled a few correctness fixes. Starting in Visual Studio 2019 version 16.10 Preview 2, the -openmp:llvm switch now works for x86 and arm64...
New Static Analysis Rule for Bounds Checking
We have added a new experimental static analysis rule in Visual Studio 16.10 version Preview 3 - C26458, . The new warning is a more precise and less noisy version of warning C26446, . Both warnings analyse standard containers for unchecked element access and they both share the warning message: “Prefer to use instead of unchecked subscript operator (bounds.4).” This new warning, however, uses path sensitive analysis to track buffer size validation calls to provide a less noisy, more targeted warning compared to C26446. Path sensitive analysis is not an inexpensive operation: the complexity and time required ...
Finding Bugs with AddressSanitizer: Patterns from Open Source Projects

AddressSanitizer (ASan) was officially released in Visual Studio 2019 version 16.9. We recently used this feature to find and fix a bug in the MSVC compiler itself. To further validate the usefulness of our ASan implementation, we also used it on a collection of widely used open source projects where it found bugs in Boost, Azure IoT C SDK, and OpenSSL. In this article, we present our findings by describing the type of bugs that we found and how they presented themselves in these projects. We provide links to the GitHub commits where these bugs were fixed so you can get a helpful look at what code changes were in...
2x-3x Performance Improvements for Debug Builds

We have made substantial runtime performance improvements in the x86/x64 C++ compiler for Visual Studio's default debug configuration. For Visual Studio 2019 version 16.10 Preview 2, we measure 2x - 3x speedup for programs compiled in debug mode. These improvements come from reducing the overhead introduced by runtime checks (/RTCs) which are enabled by default. Default debug configuration When you compile your code in debug configuration in Visual Studio, there are some flags that are passed to the C++ compiler by default. Most relevant to this blog post are /RTC1, /JMC and /ZI. While all of these flags...
Ignoring Automatic Initialization for Code Analysis
Reading uninitialized memory is one of the major sources of security vulnerabilities in C and C++ programs. Microsoft developed many tools to find such errors including compiler warnings, static analysis checks, and more recently: code instrumentation. For a more detailed overview of uninitialized memory related vulnerabilities and mitigations please refer to Microsoft Security Response Center’s great blog post. This blog post summarizes the potential interactions between code analysis and code instrumentation and improvements we've made in Visual Studio 2019 version 16.9.1. When we turn on the automatic ini...
Pure Virtual C++ 2021 is Today
Pure Virtual C++, a free one-day virtual conference for the whole C++ community, is starting today (May 3rd) at 14:30 UTC. You can watch it and interact with the speakers at Learn TV. There'll be sessions on C++20 modules, CMake, vcpkg, and code analysis. All of our pre-conference demos, including what's new in C++20 support in MSVC, are now live on YouTube. Hope to see you there!
Pure Virtual C++ 2021 Schedule Available
The schedule for Pure Virtual C++ 2021 is now live on the event website. Remember to sign up to be the first to access our extra on-demand C++ demos and get more virtual surprises. Schedule All times are on Monday 3rd May 2021 UTC. Abstracts and speaker bios are available on the website.
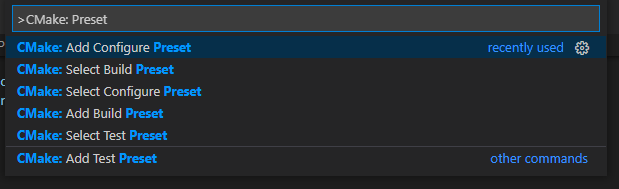
CMake Presets integration in Visual Studio and Visual Studio Code
CMakePresets.json was released in CMake 3.19 and 3.20 and allows users to specify common configure, build, and test options and share them with others. We have added support for CMakePresets.json in Visual Studio and the CMake Tools extension for Visual Studio Code. You can now invoke CMake with the same CMakePresets.json file in Visual Studio, in Visual Studio Code, in a Continuous Integration pipeline, and from the CLI on Windows, Linux, and macOS. Our CMake Presets integration is now available in preview in Visual Studio 2019 version 16.10 Preview 2 and CMake Tools version 1.7. Why should I use CMake Prese...
Visual Studio Code C++ Extension April 2021 Update: CUDA C/C++ IntelliSense and Apple Silicon Support
The April 2021 update of the Visual Studio Code C++ extension is now available! This latest release offers brand new features—such as IntelliSense for CUDA C/C++ and native language server support for Apple Silicon— along with a bunch of enhancements and bug fixes. To find out more about all the enhancements, check out our release notes on GitHub. CUDA C/C++ IntelliSense We’re excited to announce that the C++ extension now provides IntelliSense for CUDA C/C++! CUDA is a parallel programming platform, enabling developers to interact with the GPU. Microsoft and NVIDIA have partnered together to light up the CUD...
MSVC Backend Updates in Visual Studio 2019 version 16.10 Preview 2

In Visual Studio 2019 version 16.10 Preview 2 we have continued to improve the C++ backend with new features, new and improved optimizations, build throughput improvements, and better security. Here is a brief list of improvements for you to review. Do you want to experience the new improvements of the C++ backend? Please download the latest Visual Studio 2019 and give it a try! Any feedback is welcome. We can be reached via the comments below, D...
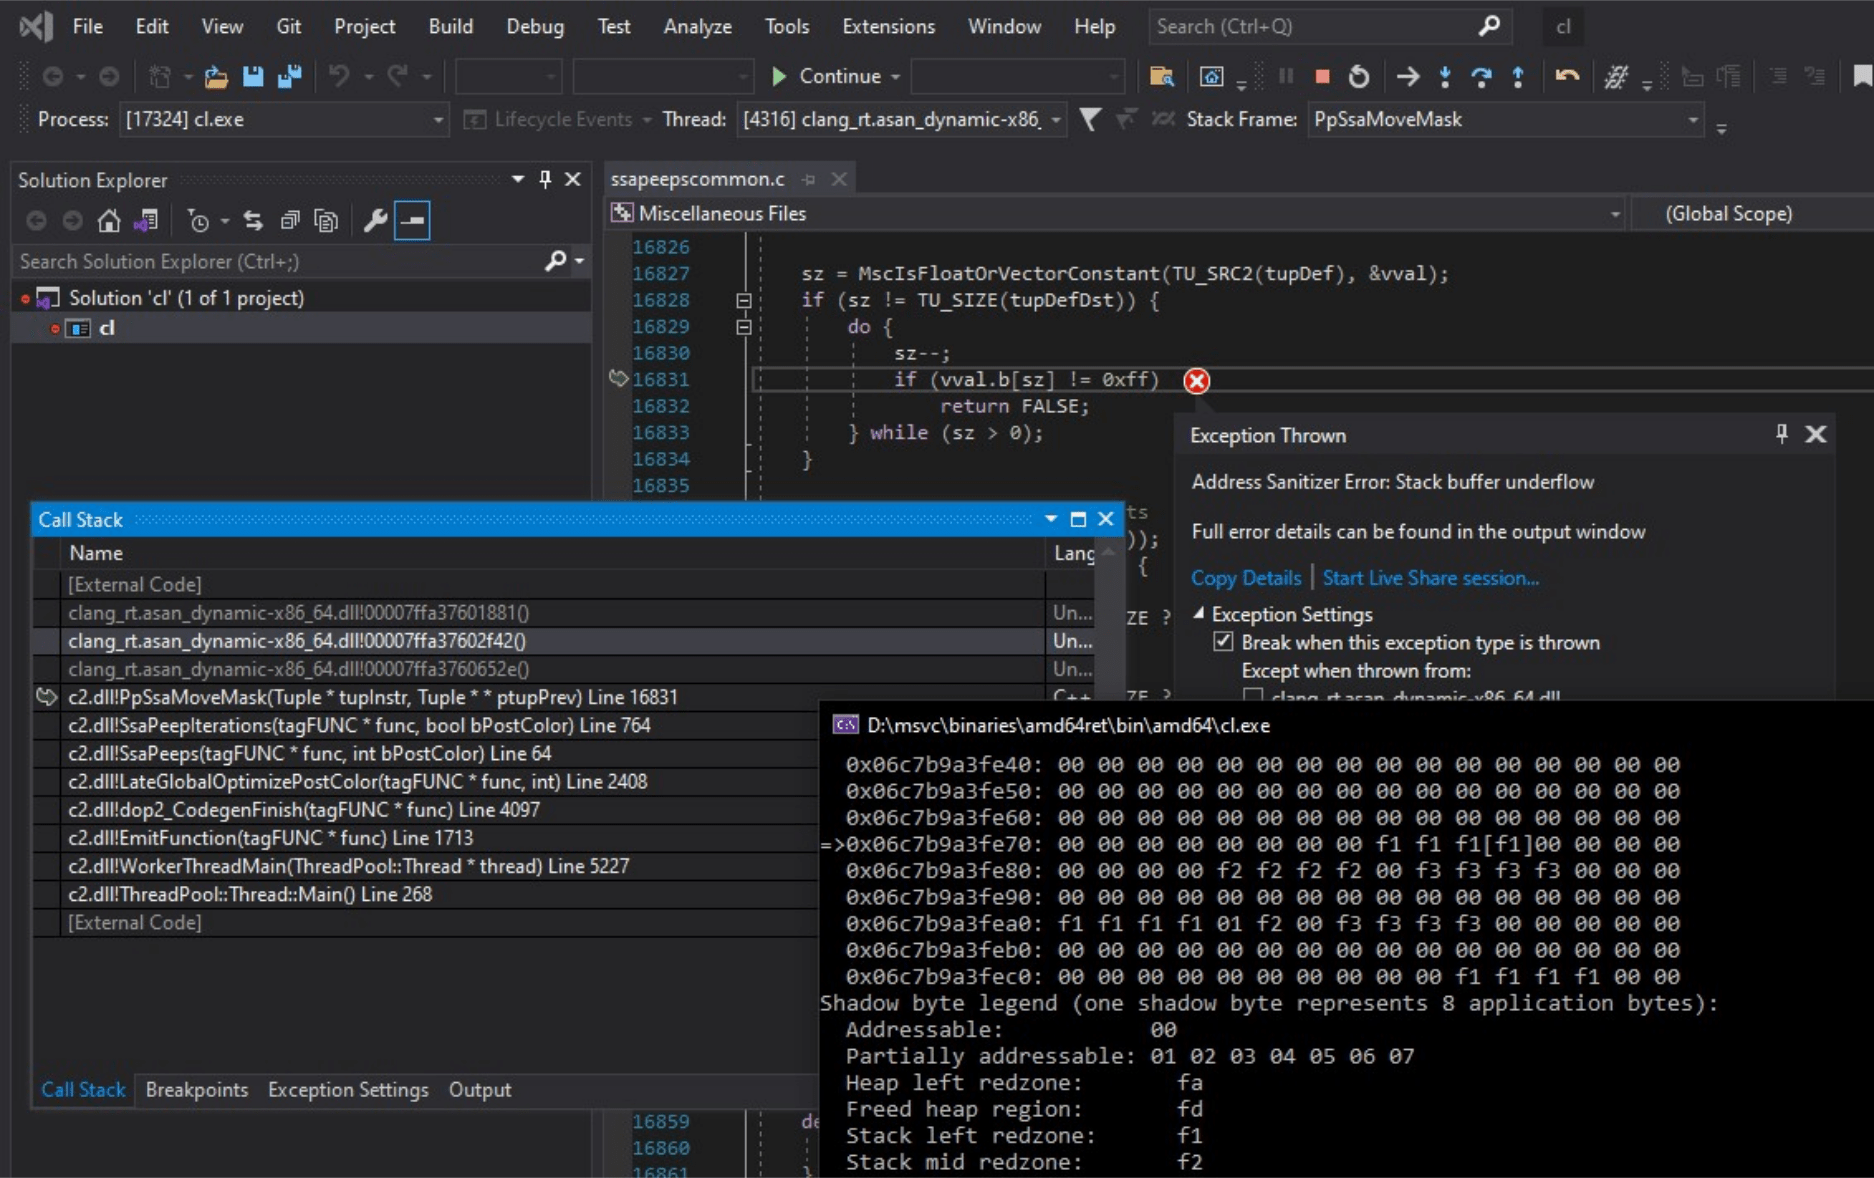
Finding Bugs with AddressSanitizer: MSVC Compiler
Special thanks to Aaron Gorenstein for authoring this blog post. The AddressSanitizer (ASan) is generally available for MSVC since the recently-released Visual Studio 2019 version 16.9. We’ve already shown how easy it can be to find bugs in even production-ready code like EASTL. Here I’ll share an example of how it found a real bug in the MSVC compiler itself. The idea was straightforward: ASan finds bugs, and we’re always interested in finding bugs in the compiler. Just like you can turn ASan on in your projects and run your tests, we’ve been turning on ASan on our project (the compiler) and running it on...