Showing results for Profiling - Visual Studio Blog

Sep 30, 2024
1

Effortless Instrumentation profiling with Persistent Target Selection

Harshada Hole
Harshada Hole

Ever wished to assess your code's performance without repeatedly choosing the target process or executable for each instrumentation profiling session? If so, you're among many developers who find this task cumbersome and prone to errors, especially when profiling the same target repeatedly. We understand your frustration and have a solution: ...

ProfilingVisual Studio Profiler
Feb 12, 2024
1
4

A Look Back: Visual Studio’s Profiling Tool Advancements in 2023

Harshada Hole
Harshada Hole

In retrospect, the past year our team was on a mission to enhance Profiling tools, making them more efficient and user-friendly. We improved instrumentation and our .NET counter tool, broadened platform support, seamlessly integrated unit test profiling, and boosted overall performance. Your valuable feedback via Developer Community was crucial in ...

Visual Studio 2022Developer ProductivityProfiling
Apr 13, 2023
13
10

Improving Visual Studio performance with the new Instrumentation Tool

Nik Karpinsky
Nik Karpinsky

Summary With the release of Visual Studio 2022 version 17.6 we are shipping our new and improved Instrumentation Tool in the Performance Profiler. Unlike the CPU Usage tool, the Instrumentation tool gives exact timing and call counts which can be super useful in spotting blocked time and average function time. To show off the tool let’s use it ...

Debugging and DiagnosticsVisual Studio 2022Developer Productivity
Aug 11, 2022
11
8

Choosing a .NET Memory Profiler in Visual Studio – part 1
Clément Habinshuti
Clément Habinshuti

Summary Visual Studio provides two great tools for analyzing and diagnosing memory issues in .NET applications: the Memory Usage profiler and .NET Object Allocation Tracking tool. While both tools are useful, it may not be obvious for new user to know which one to use when. This article aims to clarify what each tool is good for and how to use ...

Visual StudioDebugging and DiagnosticsProfiling
Jun 9, 2022
5
3

New Profiler feature in Visual Studio

Misty Hays
Misty Hays

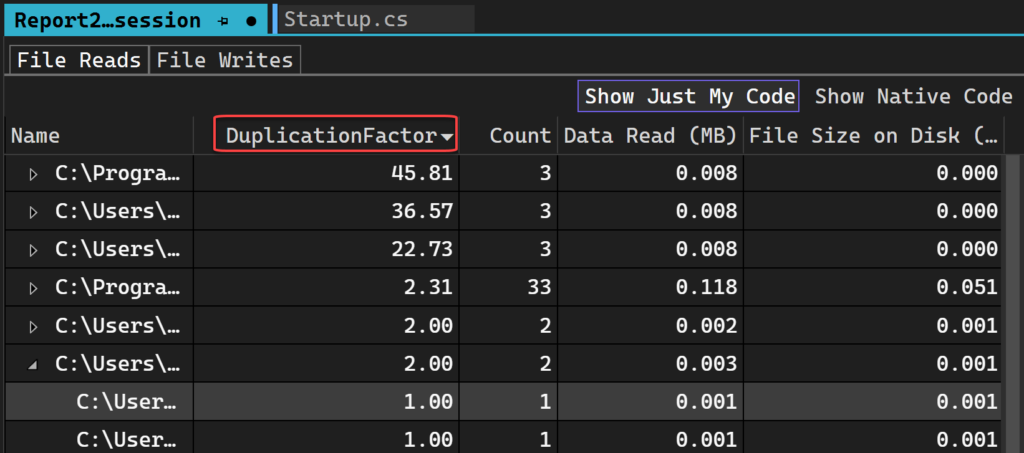
Introducing the new File I/O tool  We just launched a new profiling tool in Visual Studio 17.2 that helps you understand how you can optimize your File I/O operations to improve performance in your apps. If you’re trying to investigate and diagnose slow loading times, the new File IO tool can help you understand how the I/O operations impact ...

.NETPerformanceDiagnostics
Mar 2, 2021
14
0

New Dynamic Instrumentation Profiling for .NET

Sagar Shetty
Sagar Shetty

With the release of version 16.9 of Visual Studio, instrumentation profiling in Visual Studio just got better. Introducing our new dynamic instrumentation tool. This tool shows the exact number of times your functions are called and is faster than our previous static instrumentation tool. It also supports .NET Core instrumentation without...

Visual StudioDebugging and DiagnosticsDiagnostics
Jul 27, 2020
0
1

Database Profiling with Visual Studio

Esteban Herrera
Esteban Herrera

Examine when database queries were executed and measure how long the take using Visual Studio's Performance Profiler.

SQLDiagnosticsProfiling