Introducing the new File I/O tool
We just launched a new profiling tool in Visual Studio 17.2 that helps you understand how you can optimize your File I/O operations to improve performance in your apps. If you’re trying to investigate and diagnose slow loading times, the new File IO tool can help you understand how the I/O operations impact your spent time.
How to use File IO
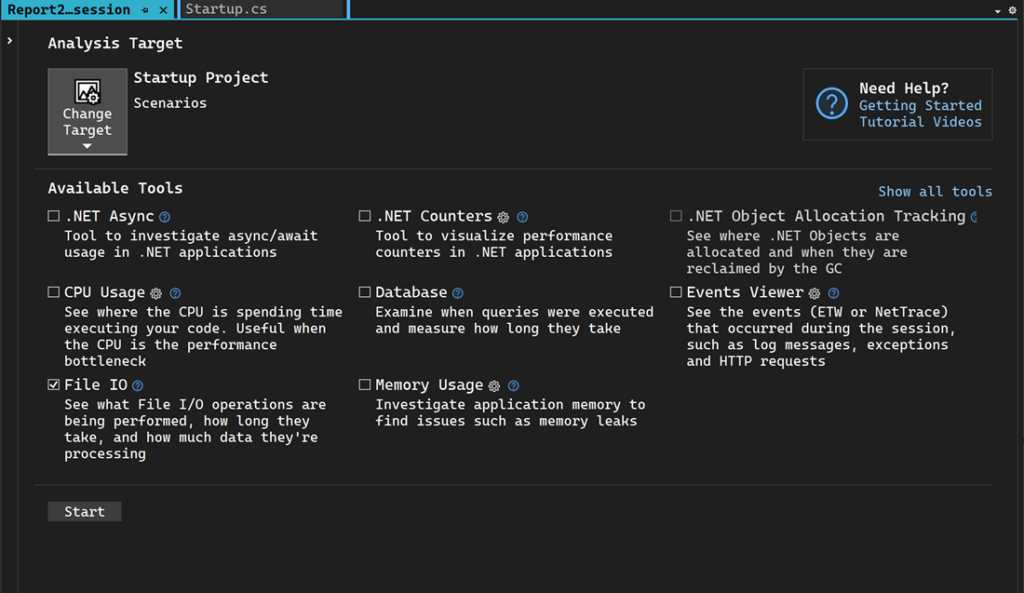
- Select Alt+F2 to open the Performance Profiler in Visual Studio.
- Select the File IO check box along with any other cooperative tools you might need.
- Select Start to run the tool.
- Select Yes.
- After the tool starts running, go through the scenario you want to profile in your app. Then select Stop collection or close the app to see your data.
View file read and write information to improve perf
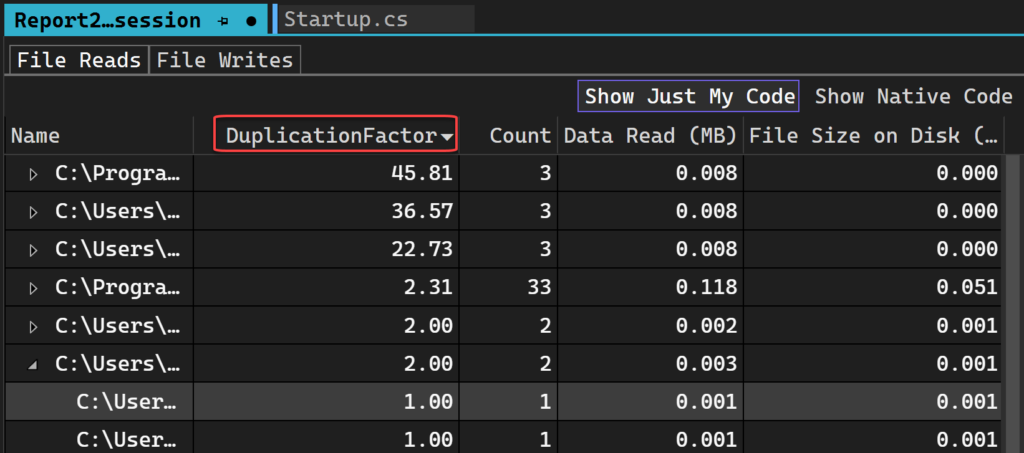
The File IO tool provides file read and write information with files read during the profiling session and can help you diagnose performance issues such as inefficient data read or write patterns. The files are autogenerated in a report after collection and arranged by their target process with aggregate information displayed.
If you right-click on one of the rows, you can go to the source in your code. If an aggregate row was read multiple times, expand it to see the individual read operations for that file with its frequency, if they were read multiple times.
Duplication Factor
The best part of the File IO tool is the Duplication Factor feature because it can help you make informed decisions about where you can reduce the read or processing time. Duplication Factor shows if you’re reading or writing more than what you need to from the file. If you have a duplication factor of 3x, that means the number of bytes you’re reading from the file is 3 times the size of the file itself, which may be an indication that you’re reading, and processing more than you realized. This can indicate a place where caching the result of the file read and processing could improve your app’s performance. 🔥
Backtraces view
Double-clicking any file will cause it to be loaded in the Backtraces view. This view loads for any file in either reads or writes, allowing you to see where the read or write is happening in your code.
Try it
We would love to get your feedback on File IO so please try it and let us know what you think via this suggestion ticket. Let us know how it could help your app’s performance in the comments.
You can also leave us feedback on other profiling tools in this survey.
Learn more about other Performance Profiler improvements in our recent blog post and how we doubled performance in under 30 minutes in this case study.


Hey just tried this out, we have some very high duplication scores showing up, but I can't make sense of them versus what I see while debugging
DuplicationFactor Count Data Read (MB) File Size on Disk (MB)
114,688.00 8 0.438 0.000
The stacks are showing as 8 individual calls to fread for this file, but break pointing it there are only 2.
First one reads 4 bytes (its a 4 byte file!)
Second one reads 0 as the file is over (slight oddity with our code as perhaps it shouldn't try the second time, however I'd expect fread should realise itself and not really do anything?)
So none of that...
We request big chunks at a time as part of a generic buffering system 64KB a pop, that seems to be affecting the outcome – if I drop it to 16 bytes the numbers go down, although it still comes out as – well 7 requests now, so down one but still seems odd.
I assume its a bug as if we request 64KB of a 4 byte file surely it should really be reading more than 4 bytes still?
It is difficult to give you a solid answer without any source code / repro but from own experience using ETW (most of Visual Studio's profiling tools use this so I am going to assume this new tool does so I apologize if this is not the case) a single "read" when using a 3rd party lib (C Runtime/.Net etc) will show a bunch of opens/reads that the library does underneath and assume that these guys are a lot smarter than I am so always just thought maybe the library was doing a bunch of buffer/pointer checking and other convenience...
sorry that was just a typo meant to say “shouldn’t really be reading more than 4 bytes still”
Nice one ! I just published a new book about performance and profiling in the .NET world with VS 2022. Too bad this feature come that late, I could have include it in the book. Maybe for next edition !
Keep up working on profiling tools, they worth it !