

Summary
Visual Studio provides two great tools for analyzing and diagnosing memory issues in .NET applications: the Memory Usage profiler and .NET Object Allocation Tracking tool. While both tools are useful, it may not be obvious for new user to know which one to use when. This article aims to clarify what each tool is good for and how to use them effectively.
First, let’s briefly explain what each tool does.
.NET Object Allocation Tracking tool
This tool helps you track how many instances of each type are allocated to the heap and their aggregate size and the methods they are allocated from. It helps you answer the questions: Where was this type allocated from? How many instances of this type are allocated? Which method accounts for the most allocations? etc. It also collects information about each garbage collection that occurs, such as which types were freed, and which ones survived.
This can be useful when you want to understand allocation patterns in your .NET code. It can also help you optimize your app’s memory usage by tracking down the methods that are most expensive in terms of memory allocations.
The tool shows us where things are allocated from. But it does not tell us why an object is still in memory.
Memory Usage tool
This tool allows you to take heap snapshots while your app is running. Each snapshot contains information about objects that were alive at that time and which objects hold references to them. It also displays diffs between different snapshots. This allows you to see what has changed between two points in the app’s execution: which types of objects were garbage collected, which new objects were allocated, etc.
This tool is helpful when investigating memory leaks. It helps you answer questions such as: Which objects were alive on the heap at a certain point in the app’s execution? What are the references keeping this instance alive? Did this object survive a garbage collection run?
However, the tool does not tell you exactly where objects were allocated from.
To illustrate the usage of these tools, we’ll go through some practical examples using sample applications and use cases.
Note on managed memory
The tools in this article focus on the managed heap. This is memory that is automatically managed by .NET the garbage collector. When you create a new instance of a class, it gets stored on the managed heap. This contrasts with the unmanaged heap which is not tracked by the garbage collector, it’s mostly used by native code or code that interacts directly with the operating system. Whenever this article mentions the “heap”, it refers to the managed heap. For more information about memory management in .NET visit this page.
Sample investigation
In this first example, we have a demo application that stores a list of orders in memory and exposes an API endpoint that returns the total and average sales from orders from a particular region and category.
You can find the full source code in this GitHub repository.
You can clone the repository locally and switch to the CachedOrderStatsSample directory to follow along with this section. Inside the repository, navigate to the CachedOrderStatsSample directory and open the CachedOrderStatsSample.sln in Visual Studio.
The code defines a StatsService class which implements a GetStatsByRegionAndCategory() method that returns statistics for a specific region and category. The statistics are computed from an in-memory collection of orders that are returned from the DataStore class. After computing the statistics for a region-category group the first time, the values are stored in an in-memory cache so that they won’t have to be computed the next time they’re requested. The cache is implemented by the OrderStatsCache class, and it uses an object that comprises of the region and category values as key.
Let’s run the server to test it. Once the server is running, we make the following requests from a web browser or HTTP client like Postman:
- http://localhost:5108/orders – this returns a list of orders
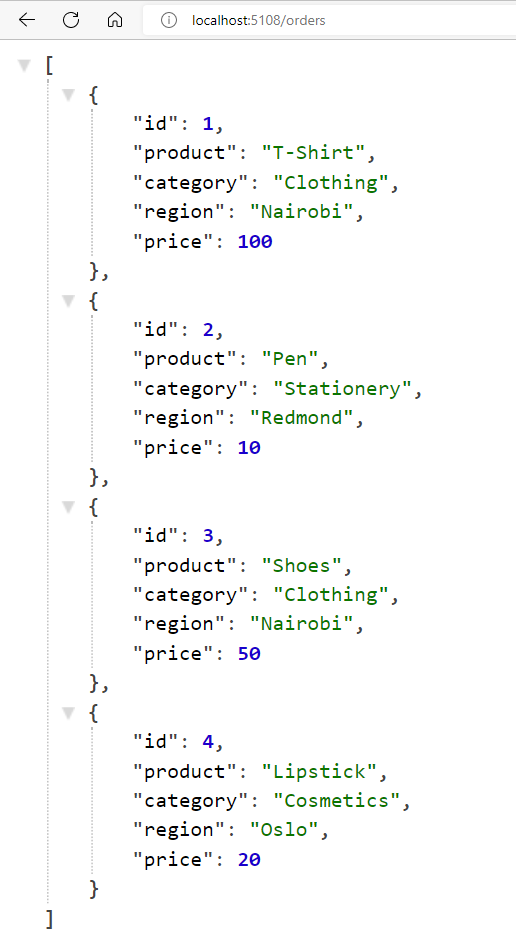
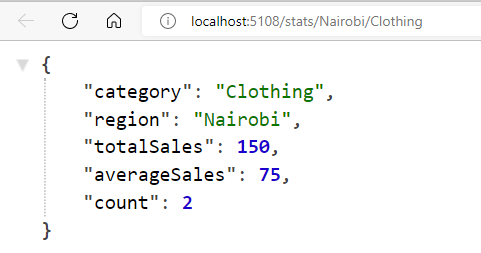
- http://localhost:5108/stats/Nairobi/Clothing – this will return statistics for all the orders made from Nairobi under the Clothing category
But we have received reports that the server’s memory usage grows over time until the server runs out of memory and crashes. We have been asked to investigate this issue.
First, let’s try to reproduce this issue locally to understand what’s happening. Sending a single request to the server might not be enough to observe any strange behavior. There are tools that we can use to send many requests to a server for load testing. For this example, I created a simple Console application for demonstration purposes and included it in the demo repository.
To run the application: while the server is still running, open a terminal window, then navigate to the root of the repository that you cloned, then navigate to the subfolder: CachedOrderStatsSample/TestClient and then run the following command:
dotnet run
![]()
This sends 10,000 requests to the server.
Now let’s stop the server and proceed to the profiling.
We would like to see how memory usage evolves over time as the application is running, whether it increases indefinitely as reported. This makes the Memory Usage profiler a suitable tool to use.
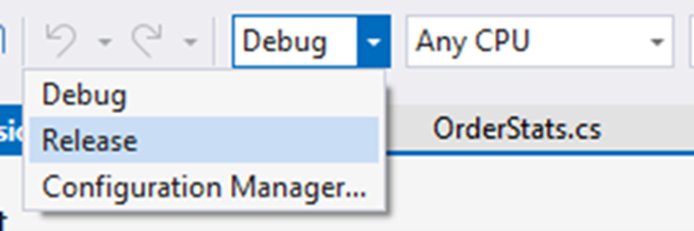
Before we start profiling, it is recommended to set our project configuration to Release mode instead of Debug mode. When an app is built in Release mode, the compiler performs optimizations that might affect the results reported by profiling tools. Profiling our app in Release mode therefore leads results which more accurately reflect how our app behaves in production.
To start the Memory Usage profiler, go to the top menu then click Debug -> Performance Profiler

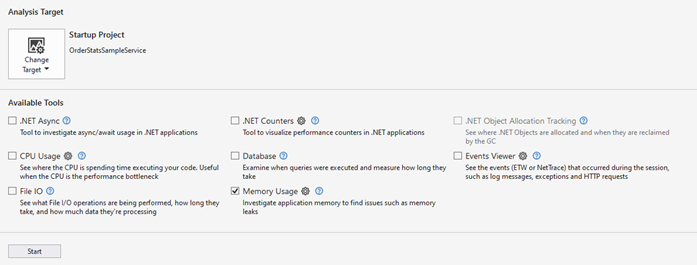
This will open a tab that allows us to select the profiling tools we want to run the target application we want to profile. The Visual Studio profiler allows you to profile a running application or launch an executable, but we’re currently just interested in profiling our open project. Make sure the Analysis Target is set to Startup Project (OrderCachedStatsSample). Then we select Memory Usage from the list of available tools.
Click the Start button. This will launch our application with the profiler attached to it. Visual Studio will open a diagnostics session tab that displays real-time information about the memory usage of your app.
- Before making any requests, take a snapshot by clicking the “Take Snapshot” button with the camera icon
- Run the client tool to send a bunch of requests to the server
- Take another snapshot
- Send more requests
- Take another snapshot
Now let’s stop the collection by clicking the Stop Collection button at the top of the diagnostics pane. This will also stop the server. Visual Studio will process the results then present a report like the one below:
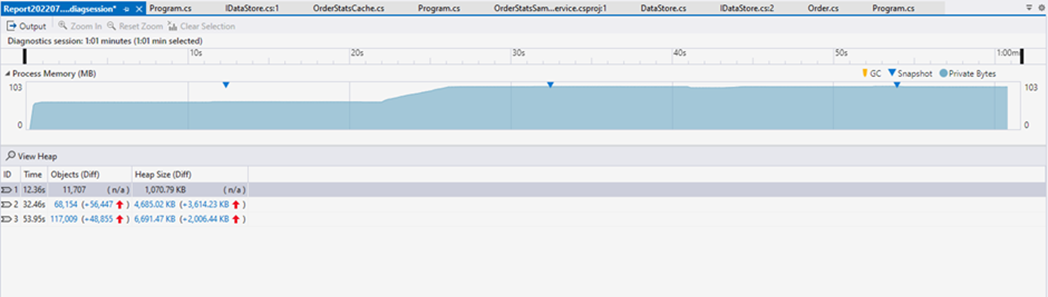
At the top, we have a timeline graph that shows how much memory the application used over time. Note that this is the overall memory and not just the managed heap. The blue markers indicate at which points we took snapshots of the heap. If garbage collection occurred, it would be indicated by yellow marks. Nevertheless, taking a snapshot also induces a full garbage collection. Consequently, in our case we had at least 3 garbage collections.
The bottom part displays a table that contains a summary of each snapshot taken. Each row represents a snapshot and contains the following fields:
- ID: The identifier of the snapshot
- Time: The moment at which the snapshot was taken relative to the start of the profiling session
- Objects (Diff): The number of objects on the managed heap when the snapshot was taken. The number between brackets is the difference between this snapshot and the previous snapshot. A positive number followed by a red upward arrow means there were more objects on the heap than in the previous snapshot. A negative number followed by a green downward arrow means there were fewer objects on the heap.
- Heap Size (Diff): Shows information similar to the Objects (Diff) column, but this is based on size of the heap rather than a count of objects.
Each snapshot allows us to inspect the types of objects on the managed heap at that point. Let’s inspect the objects in the second snapshot. Clicking on the number of objects in the first snapshot will open a new tab that looks like the screenshot below:
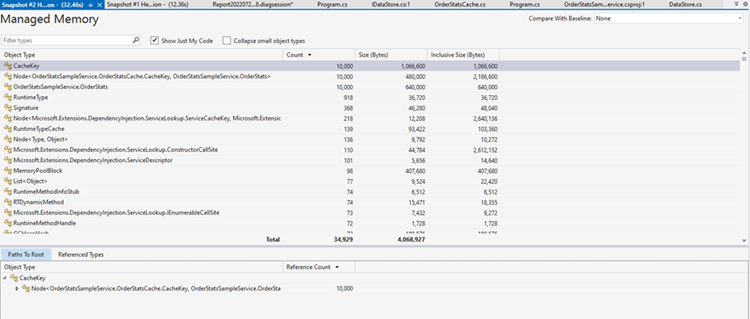
The main part of the window is a table that contains information about each type of object on the heap. Each row has the following columns:
- Object Type: The name of the type or class of the object
- Count: The number of instances of that type on the heap
- Size (Bytes): The total size in bytes occupied by instances of this type on the heap (i.e., the size of a single instance multiplied by the number of instances). This does not include the size of objects referenced by these instances.
- Inclusive Size (Bytes): The total size occupied by instances of this type, including the size of objects that they reference. For example, the
Node<CacheKey, OrderStats>type holds a reference to aCacheKeyandOrderStatsobjects. And this accounts for allCacheKeyandOrderStatsinstances in memory. This means that the total inclusive size ofNode<CacheKey, OrderStats>should be equal to its own (exclusive) size plus the total size of theCacheKeyandOrderStatsinstances it references. And it adds up: 2,186,600 = 480,000 + 1,066,600 + 640,000
For more information about the controls provided by this tool, visit the documentation.
We see that the top type is a class called CacheKey. This is a class defined in our application that’s used as key to store computed statistics data in a ConcurrentDictionary that backs our cache. The CacheKey is a simple class that contains the properties Region and Category. OrderStats is the class that stores the computed statistics for each region-category group.
Now, click the CacheKey row. This will reveal two tabs on the bottom pane: Paths To Root and Referenced Types.
Paths To Root is a tree view that displays the chain of objects that have a reference to the type we clicked. If you expand the nodes on the tree, it will eventually lead to a “GC root”. Roots include static fields, local variables on the stack, CPU registers, GC handles and the finalize queue (visit this page to learn more). The garbage collector will not free an object so long as there’s a path of references from a root to that object. If an object has no chain of references linking it to a GC root, then it’s considered unreachable, and its memory will be freed by the garbage collector. Therefore, this tree view allows us to see what references are keeping objects alive and is a valuable resource for investigating memory leaks.
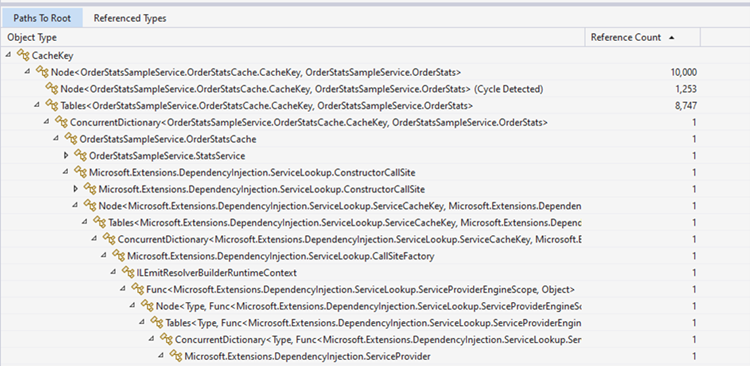
In the case of the CacheKey, all instances are referenced by Node objects inside of a ConcurrentDictionary. The dictionary is part of our custom OrderStatsCache, which is used by the StatsService to store statistics. The StartService is registered in the dependency injection service container as a singleton:
builder.Services.AddSingleton<IDataStore, DataStore>();
builder.Services.AddSingleton<IOrderStatsCache, OrderStatsCache>();
builder.Services.AddSingleton<IStatsService, StatsService>();
The Referenced Types tab shows a tree view that displays all the types that the selected references. It’s basically the inverse of the Paths To Root. The CacheKey has only 2 string properties which account for all its outgoing references:

Registering the cache as a singleton means the instance will remain alive in memory for the entire lifetime of the process. This also means any object it references (directly or indirectly) will also remain in memory. This is expected. And since our application does not implement any eviction logic, it’s also expected that cached items will remain indefinitely in memory. However, that does not explain why we have 10,000 instances each of CacheKey and OrderStats.
The cache stores statistics by region and category. The orders in our data store only span 3 unique region-category groups. So, we should have at most 3 entries in the cache: 3 instances of CacheKey and 3 instances of OrderStats regardless of how many requests we make.
After making 10,000 requests, we had 10,000 entries in the cache. It seems like each request inserts a new entry. Let’s look at the final snapshot. If this trend is consistent, then the 10,000 entries should still be in memory, and we should have 10,000 additional entries from the second batch of requests.
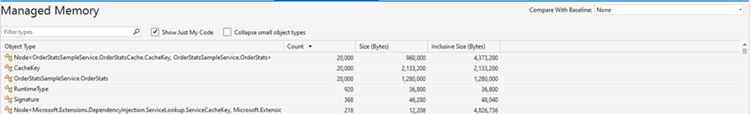
As expected, we have 20,000 total instances. We can compare this snapshot with the previous one by clicking the Compare with Baseline dropdown and selecting the target snapshot ID (Snapshot #2 in this case). This will display a diff report:
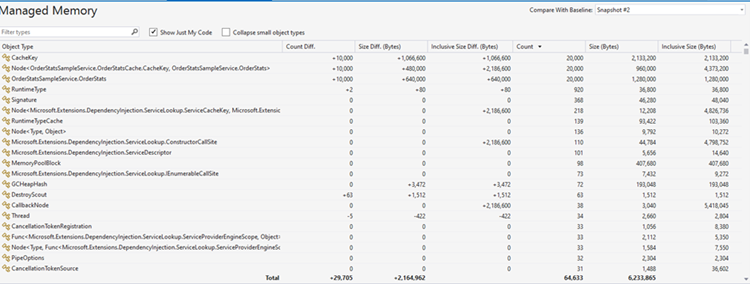
We can see most of the change is in the types in the cache. They have all increased by 10,000 instances. There’s not been much change in the remaining types, some even have reduced instance count from garbage collection.
We now have a decent idea where the issue comes from. Now we need to dig deeper to figure out the root cause and how to fix it. If we make multiple requests to the same endpoint, e.g., http://localhost:5018/stats/Nairobi/Clothing, we always get the same response. This is the expected behavior. Let’s look at the code that handles that request:
public OrderStats GetOrderStatsByRegionAndCategory(string region, string category)
{
    OrderStats? stats = null;
    if (!cache.TryGetStats(region, category, out stats))
    {
        stats = ComputeStats(region, category);
        if (stats.Count > 0)
        {
            cache.SetStats(region, category, stats);
        }
    }

    return stats!;
}
It tries to fetch data from the cache first, and if it doesn’t find it there, it computes the data manually then stores it in the cache. This looks okay. Since our cache is growing, we must be hitting the cache at some point. We might be storing duplicate data. Let’s look at our cache implementation in OrderStatsCache:
public class OrderStatsCache : IOrderStatsCache
{
    private readonly ConcurrentDictionary<CacheKey, OrderStats> cache = new();
    public void SetStats(string region, string category, OrderStats stats)
    {
        cache.AddOrUpdate(new CacheKey(region, category), stats, (key, existingStats) => stats);
    }

    public bool TryGetStats(string region, string category, out OrderStats? stats)
    {
        return cache.TryGetValue(new CacheKey(region, category), out stats);
    }

    private class CacheKey

    {
        public CacheKey(string region, string category)
        {
            Region = region;
            Category = category;
        }
        public string Region { get; }
        public string Category { get; }

        public override int GetHashCode()
        {
            return HashCode.Combine(Region, Category);
        }
    }
}
Do you see anything wrong with the code above? In the SetStats method, we create a new instance of CacheKey from the region and category to update the cache entry. In TryGetStats we also create a new CacheKey to look up the cache. Two keys with the same region and category should be considered equal and should be matched in the cache. But that’s not what’s happening. Have you seen why?
Well, we have not defined any equality logic for the CacheKey class, so the default object equality semantics are used. By default, objects are considered equal only if they refer to the same object in memory. So different instances of CacheKey will result in different entries in the cache even if they contain the same data. This is an issue that’s easy to fix. Here are a couple of approaches we can take:
- We can implement a custom
Equalsmethod that overrides the defaultObject.Equalsmethod - We can define our class as a
recordinstead (C# 9 and later). Records implement value-equality semantics out of the box. The compiler generates custom equality comparison methods that compare each field of the records. - We can define the
CacheKeyas astruct. Structs also use value-equality semantics by default. They have the added advantage that they’re allocated on the stack when instantiated, instead of the heap. This may be convenient for small objects that are allocated frequently. Using structs in such scenarios can help reduce the pressure on the garbage collector. - We can define the
CacheKeyas a record struct (C# 10 and later)
Before we go ahead and fix the code. Let’s use .NET Object Allocation Tracking tool to compare the type of reports and insights that we would get from both tools in this scenario. We go back to the Performance Profiler page, but this time select .NET Object Allocation Tracking and click Start.
![]()
This will launch the app and a profiling session. Like before, we use the client app to send requests to the server. When we’re done collecting data for the scenario, click the Stop collection to view .NET Object Allocation data.
![]()
This will process the data then display a report like the following:
![]()
The top pane has 3 graphs. The Live Objects chart shows the number of live objects in the heap over time. The second chart shows the percentage increase in the number of objects at different points in time. We can see we have noticeable increases when we make a request then it flattens. The red bar indicates that a garbage collection occurred at that point, between the first and second wave of requests. Notice that this coincides with a drastic drop in the number of live objects. The Private Bytes (MB) shows how much memory the app uses over time, like what we had in the Memory Usage report.
This tool does not allow us to take snapshots of the heap. It allows us to see which types were allocated within a specific time range. It can also tell us which types were cleaned up by garbage collection and which ones survived. But it does not tell us which types were on the heap at a specific point in time.
The bottom pane contains tabs with the different tabular report. The Allocations tab shows how many instances of each type were allocated on the heap.
We see that there were 40,000 instances of CacheKey allocated. We allocate a new CacheKey in both the SetStats() and TryGetStats() methods of StatsCache. But the instances we create in TryGet() get garbage collected. That’s why the Memory Usage tool only reported 20,000 instances. When you double-click the CacheKey entry, it opens a tree view on the right pane that back-traces the methods that allocate that type.
![]()
This information proves to be valuable when we’re trying to track down allocations to reduce memory usage or GC pressure. We will explore more of what this tool offers in the next part of this series. For now, let’s go back to fixing our memory issue.
Let’s go with the simplest fix: turn our class into a Record. We simply change the definition of the CacheKey class to the following:
private record CacheKey(string Region, string Category);
Now let’s re-run the Memory Usage profiler and re-run the same experiment: collecting snapshots after each wave of requests. I got the following report:

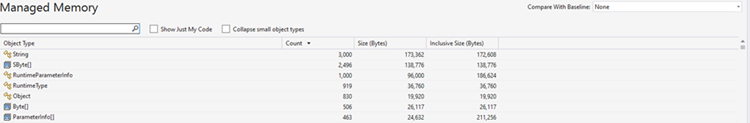
At first glance, we can see that the number of objects in the last 2 snapshots has significantly reduced from the first report we got earlier. When we open the second snapshot, we see that our CacheKey or dictionary Node are no longer among the top types:
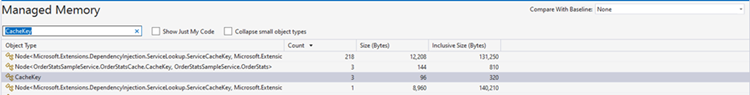
We can use the filter search box to find the field: We only have 3 instances of CacheKey and only 3 nodes in the cache. That’s because we only have 3 unique region-category groups:
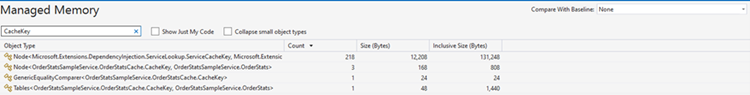
When we look at the diff report of the last snapshot, we see that the number of instances for CacheKey has not changed:

If we collected .NET Object Allocation data, we would not see a difference in the number of allocations for the CacheKey. We’re still allocating just as many instances on the heap when we call new CacheKey(…). But most of them get garbage collected. To do away with the heap allocations altogether, we can define the CacheKey as a struct. The easiest way to do this would be to declare CacheKey as a record struct if you’re usig C# 10 or later:
private record struct CacheKey(string Region, string Category);
If we were to define the struct manually, we could do it as follows:
private struct CacheKey : IEquatable<CacheKey>
{
    public CacheKey(string region, string category)
    {
        Region = region;
        Category = category;
    }

    public string Region { get; }
    public string Category { get; }

    public bool Equals(CacheKey other)
    {
        return Region == other.Region && Category == other.Category;
    }

    public override bool Equals([NotNullWhen(true)] object? other)
    {
        if (other is CacheKey otherKey)
        {
            return Equals(otherKey);
        }

        return false;
    }

    public override int GetHashCode()
    {
        return HashCode.Combine(Region, Category);
    }
}
Implementing IEquatable<CacheKey> and custom equality logic improves performance and avoids boxing, which would cause the struct to be allocated on the heap when treated as Object.
Now when we re-run our Memory Usage experiment and look at a snapshot that was taken after making requests, we find that there’s no instance of CacheKey on the heap. We still have dictionary Node instances on the heap, and the CacheKey values are now “embedded” inside the Node instances instead of being stored as separate objects on the heap.
For comparison, let’s collect a report using the .NET Object Allocation Tracking tool. We find that the CacheKey is no longer listed because it has not been allocated to the heap. Calling new CacheKey(…) now allocates the instance on the stack, and it’s automatically freed when the method goes out of scope. If we had not implemented IEquatable<CacheKey> we would see many CacheKey instances allocated on the heap.
If you’re consider using structs in your own code, I recommend going through the following guidelines first.
Conclusion
We have seen how we can use the Memory Usage profiler to diagnose a memory leak in a sample .NET application. We have also briefly compared the reports returned by the Memory Usage and .NET Object Allocation Tracking profilers. The scenario in this demonstration was contrived, the application was simple, and the issue was relatively easy to diagnose and fix. In the real world, the problem will likely be more challenging. Depending on the scenario and the problem being diagnosed, one tool may be sufficient to figure out where the problem is. In other cases, you may need to look at data from different reports and tools to get the full picture of what the problem is. Nevertheless, familiarity with the profiling tools will hopefully make the task easier. In the next part, we will explore more scenarios to better understand where each tool shines.
Not sure what, if anything I’m doing wrong, but CacheKey doesn’t show up anywhere in my Managed Memory list. I see ServiceCacheKey mentioned; as in: “Node”
Am I missing something?
Thanks,
Scott
Missing some text, unless I’m reading this .. wrong.
“It has the added capability of being able individual instances of a specific type in a heap snapshot.” “…of being able individual instances…” being able tooooo??
If we manually create a class with new in a singularly registered service, will there be a memory leak?
The singleton service will remain alive throughout the program and will manually create a class with new inside each time it is called.
public class SingletonService
{
    public void Method
    {
        var list = new OtherClass();

        // bla bla bla
    }
}
In the above example, the OtherClass instance is manually created inside a service registered as Singleton. Will this cause a memory leak?
First, just wanted to clarify, that in this context when I talk of memory leak, I refer to cases where an object remains in memory and doesn't get garbage-collected even after it's no longer needed.
Now for your specific question, I assume that the `list` object is not intended to remain alive throughout the program, right? In the case, I would say probably not. At least from the snippet above, it doesn't seem to be the case. But it really depends on what happens next after the object is allocated. Let's explore a few simple scenarios.
<code>
When SingletonService.Method() is called, a...
wow that’s a great answer! thank you very much.
Great article which combines the theory of profiling with a hand-on sample to demonstrate the reality. Good job!
Thanks for the feedback.