

Unlock New Heights in Developer Productivity: Optimized C++ Support, Enhanced Enterprise Capabilities, and Full .NET 8 Integration
The latest update (17.8) for Visual Studio 2022 is now generally available! Offering a comprehensive suite of enhancements that span productivity, programming languages, and enterprise management, this general release is a monumental step forward. Developed with extensive user feedback, this version is fully compatible with .NET 8, which is also generally available as of today.
Let us know your favorite feature!
This release is a big deal not just for its extensive list of features but also for its emphasis on community-driven enhancements. The above features are the top-ranking improvements, voted by customers themselves. For enterprises, this version simplifies client initialization and adds new management features, ensuring that development teams can operate efficiently. Advanced debugging controls and expanded Test Profiling options are part of this release, providing crucial metrics for application performance optimization.
Productivity
GitHub Copilot
Supercharging your productivity with Visual Studio gets a lot easier in the newest release of Visual Studio. GitHub Copilot autocomplete is now available as an optional component, making it far easier to install along with a new Visual Studio. A GitHub Copilot subscription is required to activate features; free trial is available.
Component details here: Visual Studio Enterprise workload and component IDs | Microsoft Learn.
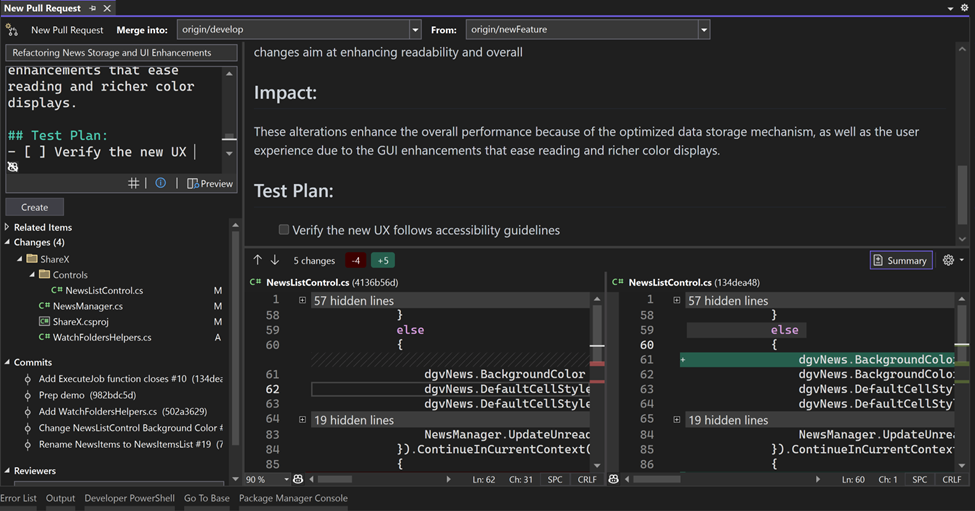
Create a Pull Request – Add reviewers and edit descriptions with Markdown all in Visual Studio
We see lots of engagement on this Developer Community ticket. In response, you can now create a Pull Request, completing the entire inner workflow, in Visual Studio. Enter the New Pull Request window by clicking the link in the notification banner in Git Changes after pushing, or from the top-level menu via Git > GitHub/Azure DevOps > New Pull Request. In each preview version of Visual Studio since 17.7 preview 2, we’ve shared new updates on this experience, and we’re excited to make this available as a feature to general audiences.
Take this survey to let us know what you think.
Case Preserving Find and Replace
When you do a Replace, you can now preserve the original casing of each match in your code. Note that to get Pascal case and Camel case, your Replace string must also be in Pascal case or Camel case.
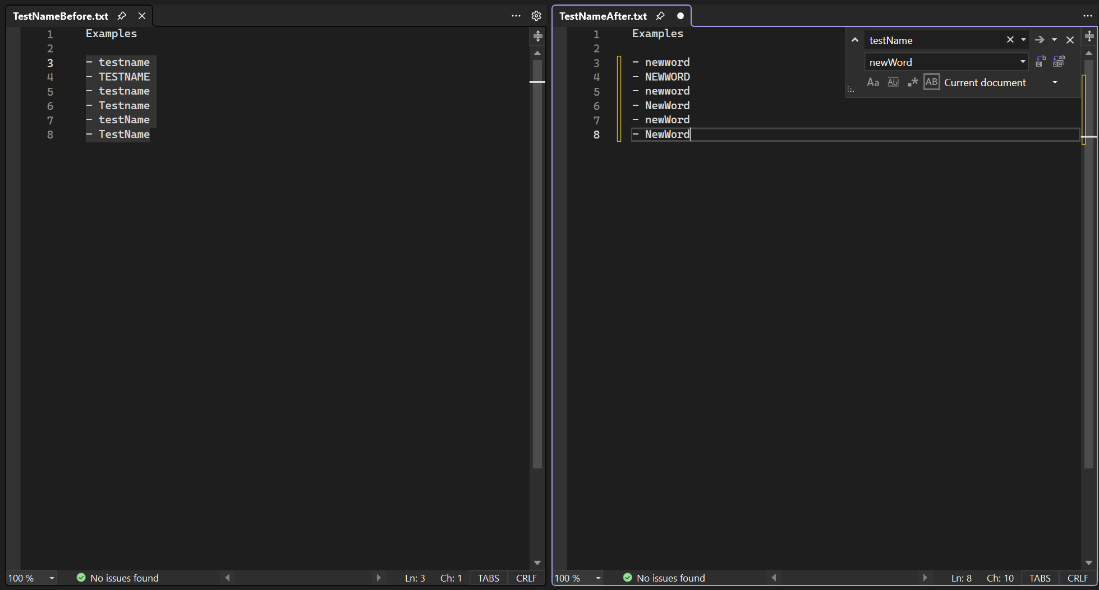
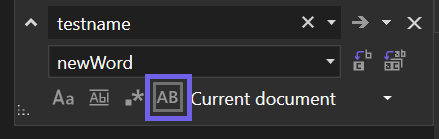
Toggle case preservation in the Replace window with ‘Alt+V’ or by clicking on the ‘Preserve case’ option.
Quick Replace (Ctrl+H):
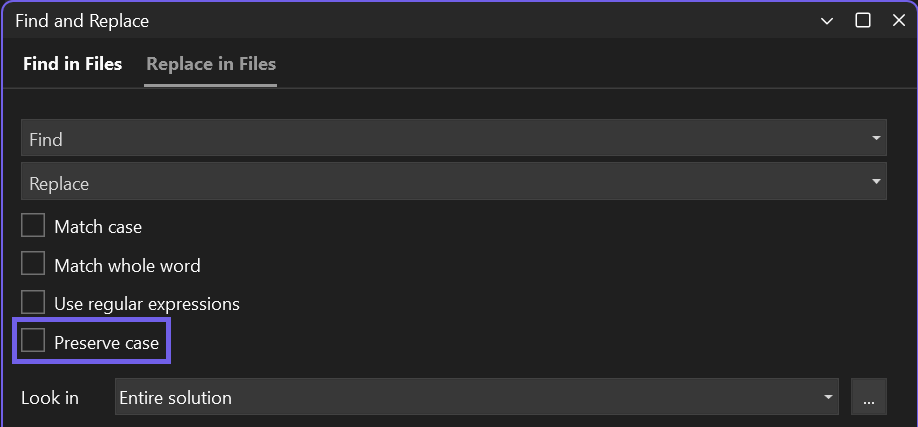
Replace in Files (Ctrl+Shift+H):
Share your thoughts on the case preserving replace experience on this Developer Community ticket.
Multi-Repo Limit Increase
As more of you are using our Multi-repository features, we heard on this Developer Community suggestion ticket that many of you needed the number of active repositories to be more than 10. You can now work with up to 25 repositories at once in your solution.
Summary Diff (and Improvements!)
Leverage the new summary difference view to focus on the changes in your code.
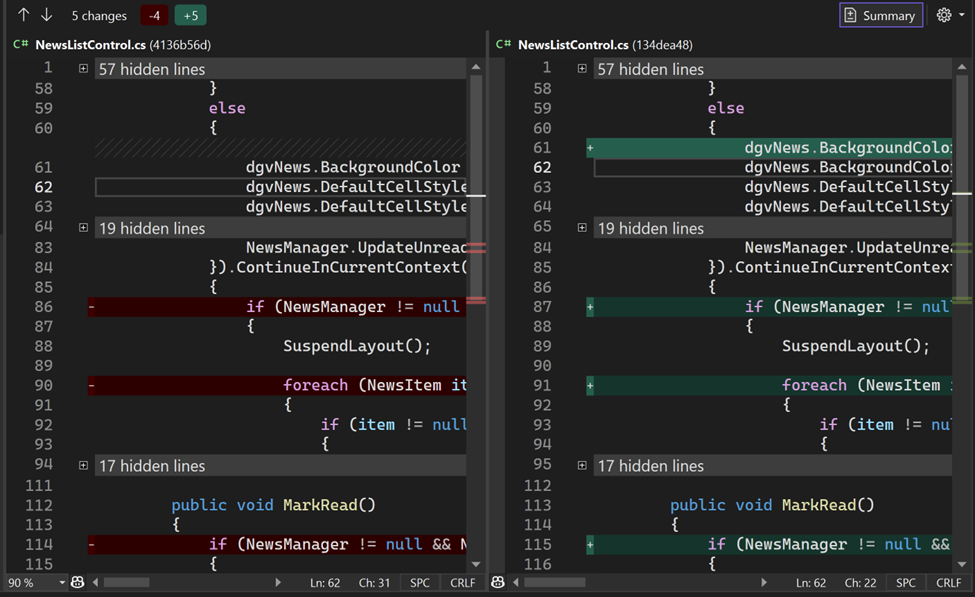
Enabled in every comparison view, the new summary difference view allows you to toggle the context lines to do file comparison faster. We’ve also implemented the Summary view in the diff and compare views. This new option allows you to see only the changes in the file with a few lines of context, making reviewing your changes in a commit or the comparison between two files much more efficient.

Let us know what you think of this feature by sharing your feedback here and engage with us on the suggestion ticket in Developer Community.
Remote Linux Unit Test Support
We have added support so that you can run CTest and GTest tests on your remote Linux machines from Visual Studio’s Test Explorer, just like you would any local tests.
Make Global Function Static
Visual Studio now prompts you to mark global functions as static. When you encounter a global function without a forward declaration, Visual Studio will offer a quick fix, represented by a screwdriver icon.
You can customize the setting for this feature under Tools > Options > Text Editor > C/C++ > IntelliSense. To learn more about this feature and Make Member Function Const, visit our Make Member Function const and Global Function Static in Visual Studio Blog.
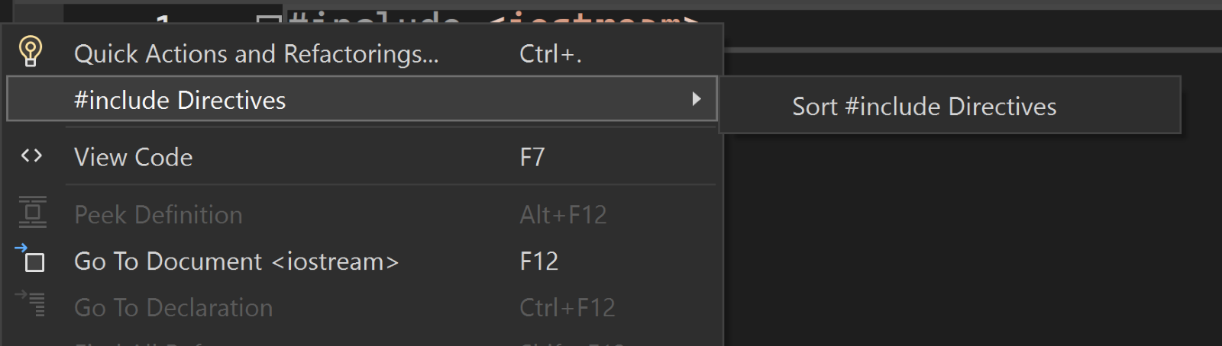
Clean Up and Sort #include Directives
You can now sort and clean up your #include directives automatically.
Unused #include directives will be dimmed in the editor. You can hover over a dimmed include and use the lightbulb menu to either remove that include or all unused includes.
There is now also the option to add #include directives for entities which are currently indirectly included via other headers. For example, if you use std::string in your code but don’t #include <string>, the code will still work if some other header you include transitively includes the correct header. This makes the code fragile to changes in other headers. If #include cleanup detects indirect headers, a quick action (indicated by three dots in the default view) will appear. Hovering over it will inform you that content from that transitive include is being used. Then, you have the option to either add the direct include individually or add all transitively used includes.
Find out more about this feature at Clean up C/C++ #includes in Visual Studio.
To automatically sort #includes, right-click on any #include statement. Then, hovering over the #include directives option in the context menu will reveal “Sort #include directives.”
You can also configure transitive include cleanups and include sorting through the Code Cleanup entry. First, open the Code Cleanup configuration menu through Analyze > Code Cleanup > Configure Code Cleanup, or by clicking the arrow next to the broom icon in the bottom status bar and selecting Configure Code Cleanup. Add the desired features to the Included fixers section, then click the broom icon to run them.
You can configure include cleanup and sorting at Tools > Options > Text Editor > C/C++ > Code Cleanup.
Visual Studio Update Notification
Noticed something new? For Visual Studio 2022, we added an overlay to the VS task bar icon to help you know when VS will update. When there is an update available and you have enabled the “Update on Close” option, the icon will appear. Once you close VS, an update will immediately start and as a result the icon will also disappear. For more information on Update on Close, please visit VS Update on Close.
![]()
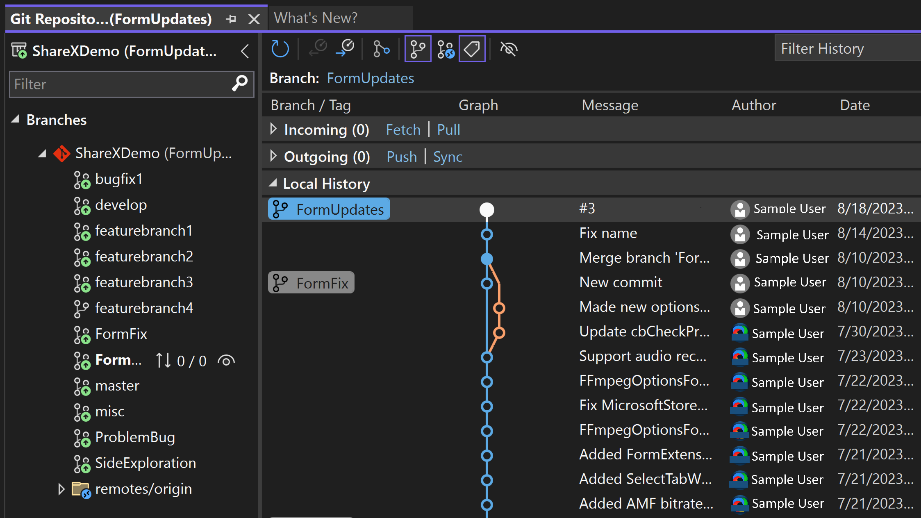
GitHub Avatars added to Git Repository Window
See your GitHub avatars in the multi-branch graph in the Git Repository Window.
Teams Toolkit
You can now create even more types of apps for Microsoft Teams using the new options released in the Microsoft Teams App project template. Included in Teams Toolkit are now the options to create:
- Echo Bot – a simple bot project that echos user input and can be customized
- Link Unfurling project – a message extension to render URL links as Adaptive Cards
- Custom Search Results – a message extension to run custom search queries from the chat compose area and display results as Adaptive Cards
- Collect Form Input and Process Data – an action-based message extension that shows how to get user input, perform some action, and send results back to the users.
Install the “Microsoft Teams development tools” component in the ASP.NET workload to get started or visit the documentation to learn more.
Performance Enhancements
Improved Razor/Blazor Responsiveness
Solutions using Razor and Blazor will experience better responsiveness. We achieved this by significantly reducing memory allocations during cross-process communications between Visual Studio and Roslyn. We tested the OrchardCore solution, and the results are impressive. To open the solution and get Razor intellisense ready, we allocate about 1.4GB less memory. Fewer heap allocations mean less work for the garbage collector, which results in improved responsiveness.
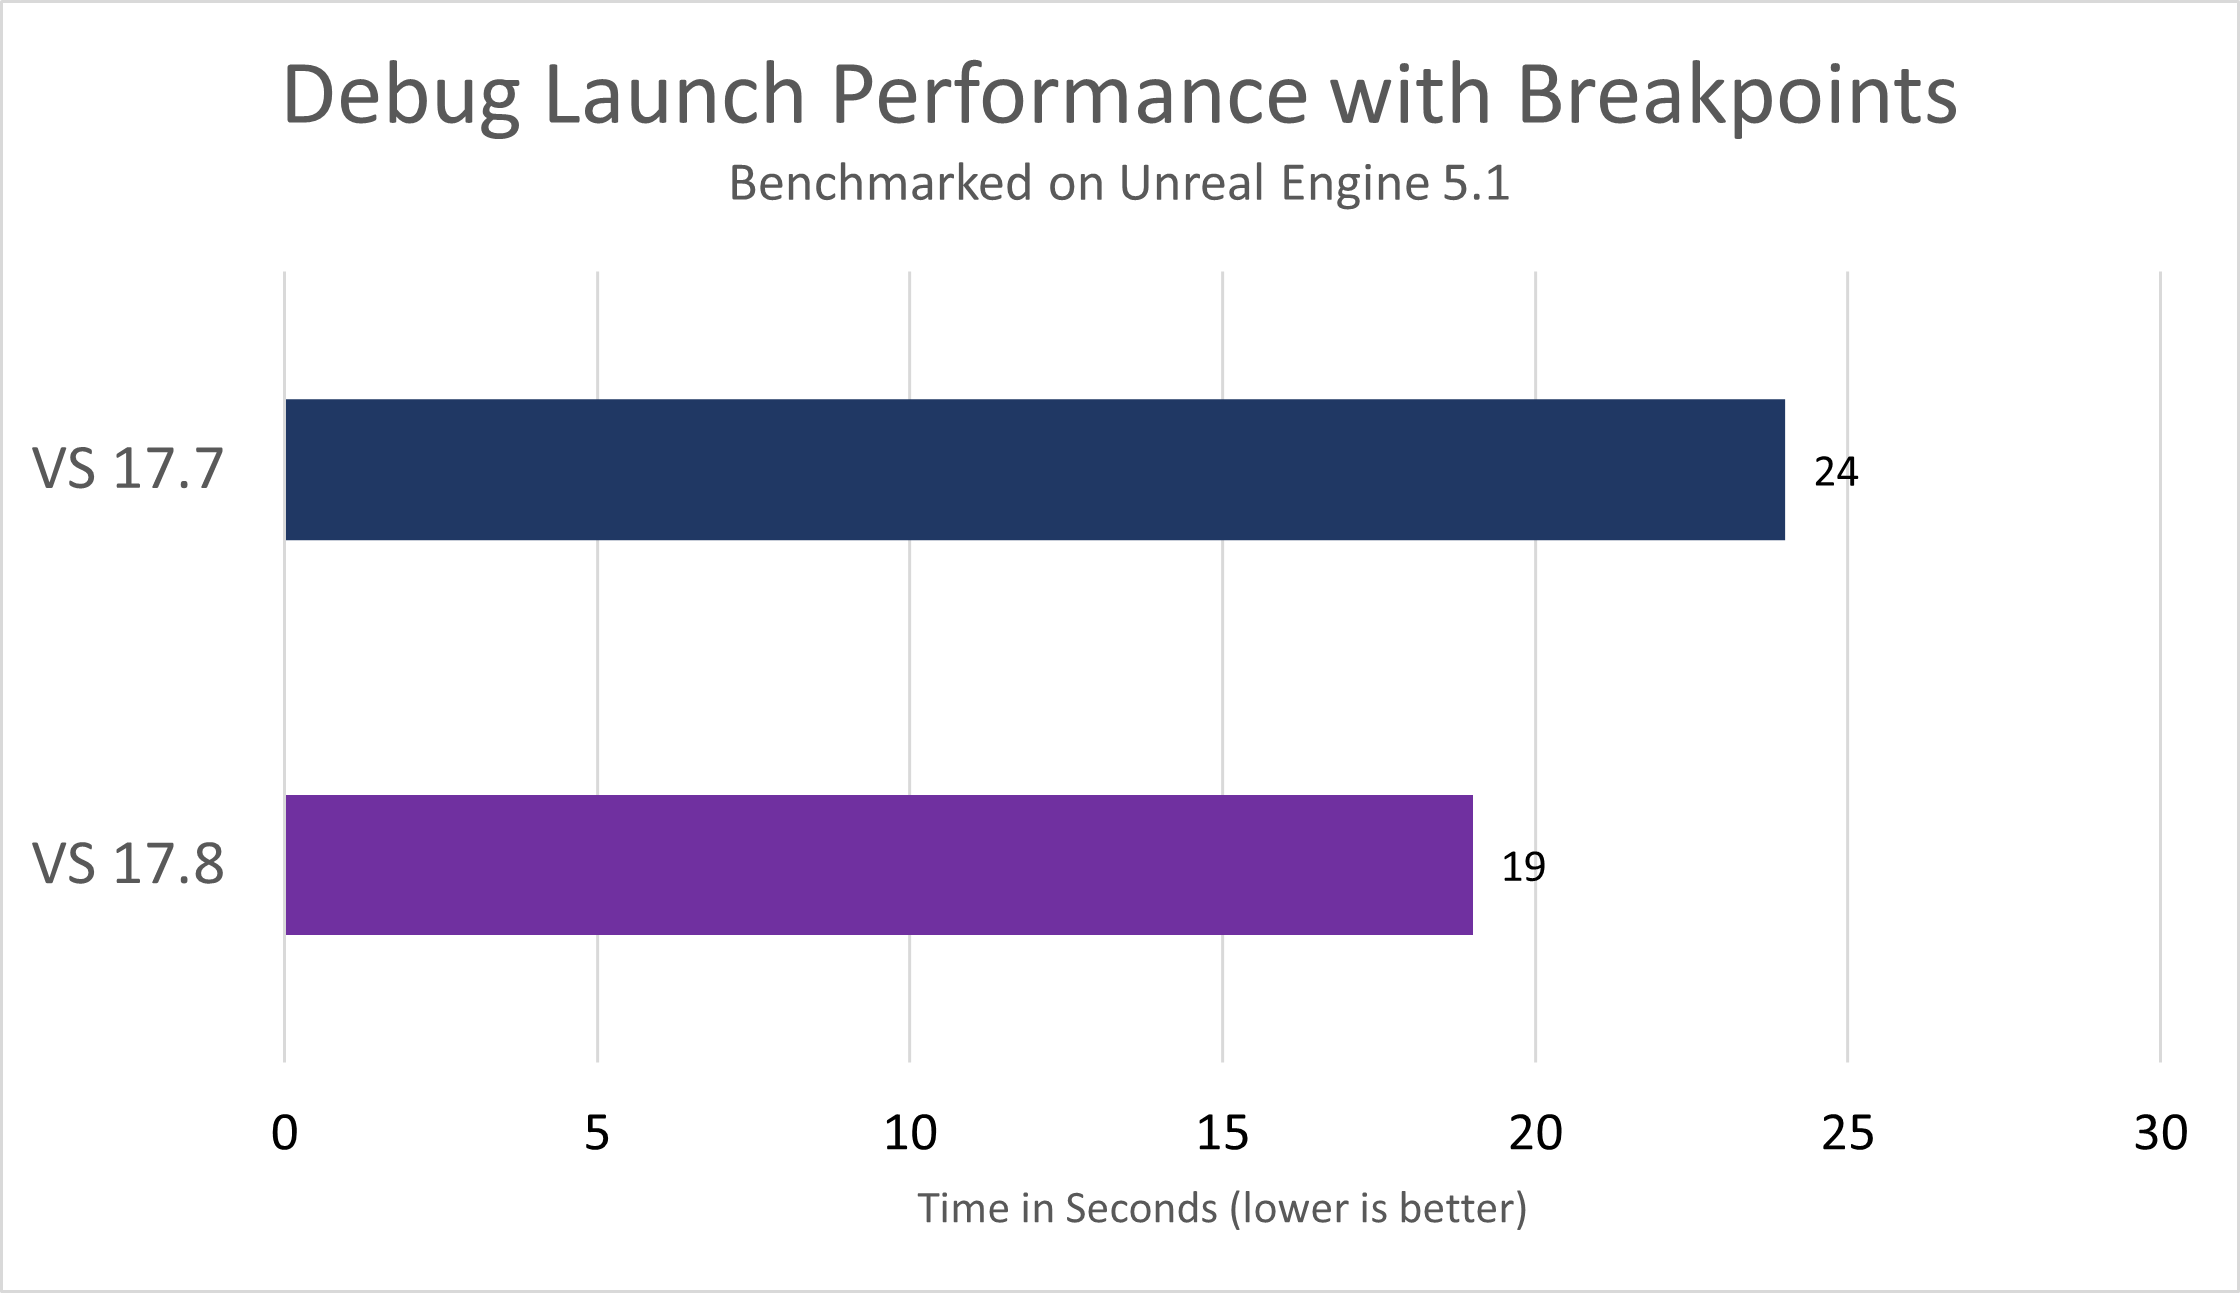
Enhanced F5 Speed
We’ve substantially enhanced F5 performance for native projects by optimizing how breakpoints get set up. The improvements seen by any given project depends on the number of files with breakpoints, the number of DLLs with symbols, etc. Additionally, we’ve optimized the PDB loading process for Windows applications, reducing the time required to load a PDB once it’s located. In our testing, these optimizations delivered a remarkable 20% speed improvement for Unreal Editor projects.
Optimized IntelliSense for C++ Unreal Engine
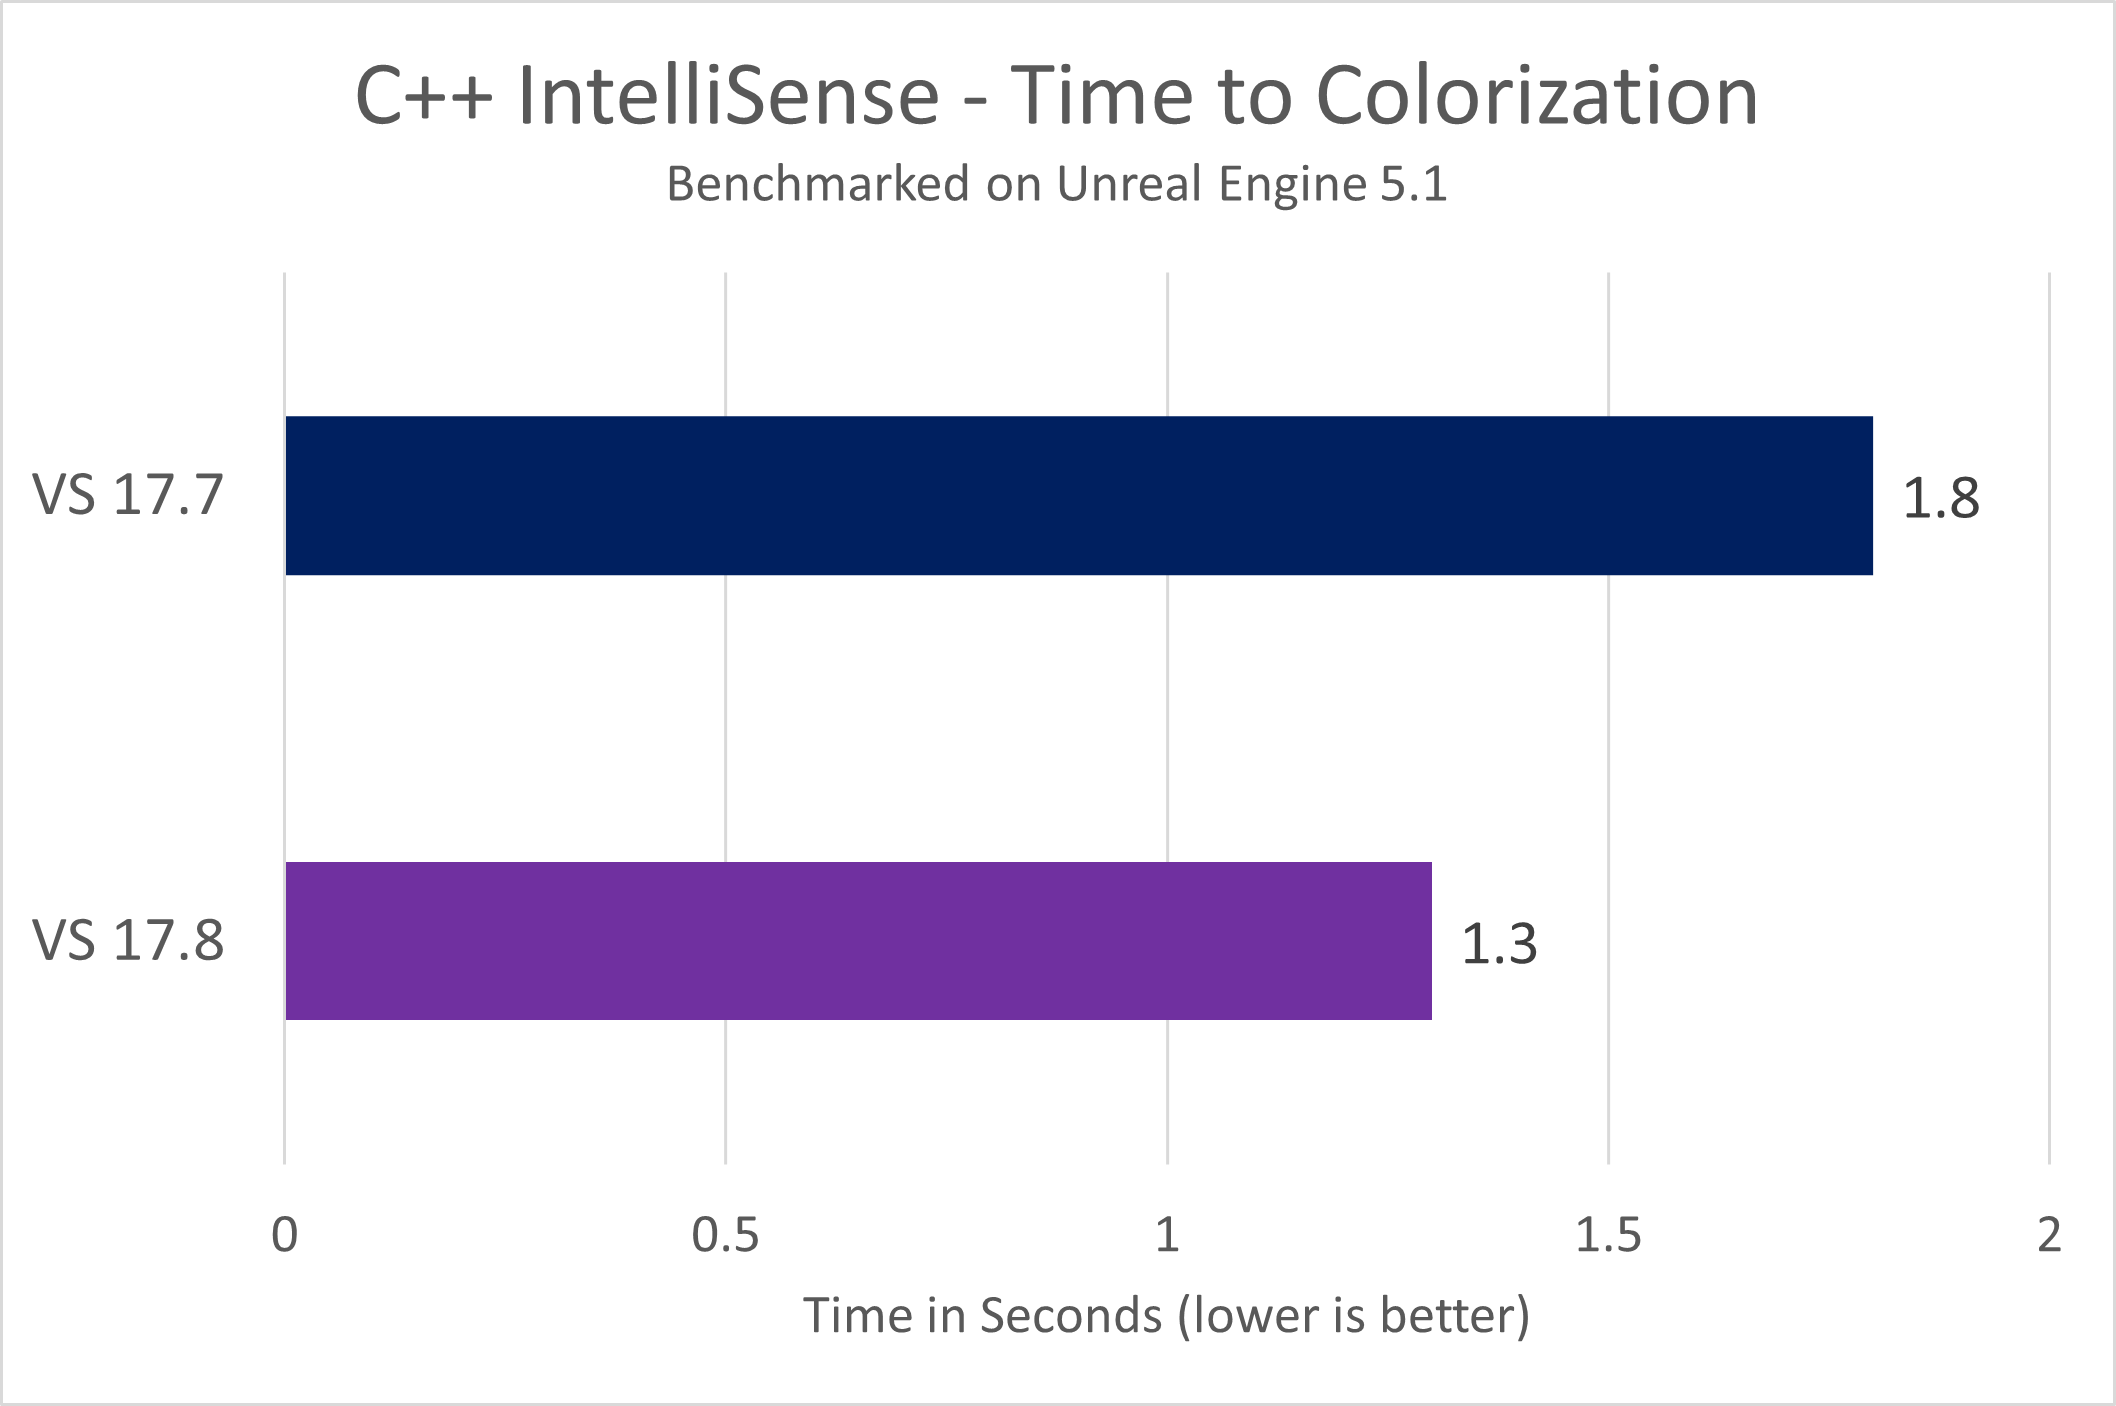
We’ve made improvements to the speed with which IntelliSense and colorization become available after opening a previously opened C++ file. We have always cached IntelliSense state for an opened file. In 17.8, we’ve restructured the reading from cache, such that the most critical information, including colorization and the highlighting of selected references, are computed first. This optimization helps you get productive sooner.
Build Acceleration for Non-SDK style .NET Projects
Visual Studio 17.8 extends Build Acceleration to managed applications targeting the non-SDK style projects (e.g. projects targeting .NET Framework 4.8 or lower) providing a substantial impact on build times. To enable, set an msbuild project property as follows:
<Project>
<PropertyGroup>
<AccelerateBuildsInVisualStudio>true</AccelerateBuildsInVisualStudio>
</PropertyGroup>
</Project>
This builds on the success introduced in 17.5 for SDK-style projects, reducing incremental build times significantly.
In our internal testing with in-house solutions, we noticed up to a 50% improvement in incremental build times. However, the actual improvement depends on the state of projects when the build begins. Specifically, the fewer the projects that have been modified in comparison to the total projects in the solution, the greater the improvement. The actual extent of improvement you experience will depend on the specific characteristics of your project and its modifications.
C++ Game Dev
C++ Structured Diagnostics
Massive compiler errors which seem impossible to navigate are the bane of many C++ developers’ lives. It’s up to tools to provide a better experience to help you comprehend diagnostics and understand how to fix the root issue.
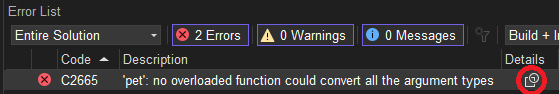
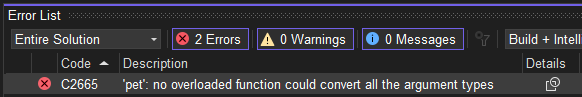
To aid this, you can now view structured diagnostics in the Output window and new Problem Details window. Error List entries which have additional information available will show an icon in the new Details column.
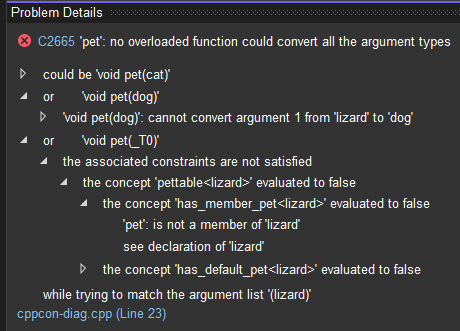
Clicking this will open these details in the Problem Details window, allowing you to navigate through the associated information of the error:
This nested structure is also reflected in the Output window:
1>Source.cpp(18,6):
1>or 'void pet(_T0)'
1>Source.cpp(23,5):
1>the associated constraints are not satisfied
1> Source.cpp(18,10):
1> the concept 'pettable<lizard>' evaluated to false
1> Source.cpp(16,20):
1> the concept 'has_member_pet<lizard>' evaluated to false
1> Source.cpp(10,44):
1> 'pet': is not a member of 'lizard'
1> Source.cpp(20,8): ra
1> see declaration of 'lizard'
1> Source.cpp(16,41):
1> the concept 'has_default_pet<lizard>' evaluated to false
1> Source.cpp(13,30):
1> 'is_pettable': is not a member of 'lizard'
1> Source.cpp(20,8):
1> see declaration of 'lizard'
Find out more about this feature at Structured Diagnostics in the New Problem Details Window.
CMake Targets View Improvements
To make the CMake Targets View more usable, we have implemented a few new improvements to make it easier than ever to navigate your CMake targets. This includes improved navigation to the CMake Targets View, a new, more simplified CMake Targets View, and the ability to exclude specified CMake items from the Targets View.
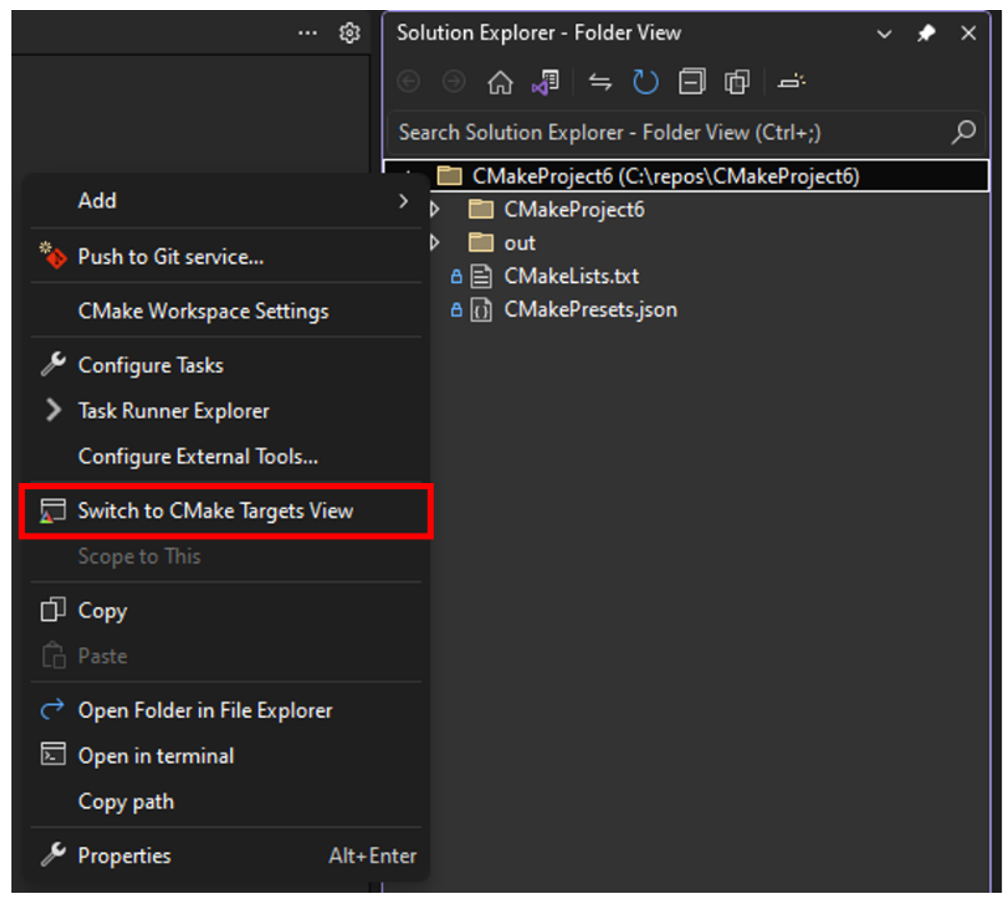
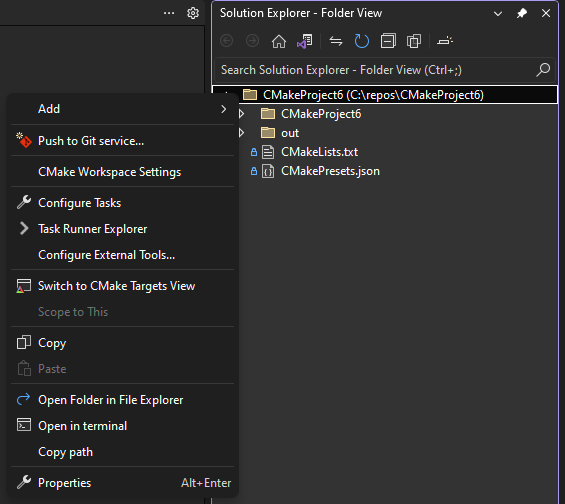
Now, you can right-click anywhere in your Solution Explorer and simply navigate to the CMake Targets View from the context menu.
The CMake Targets View has been further simplified so that users don’t have to click through folders without buildable executables to get to their desired target.
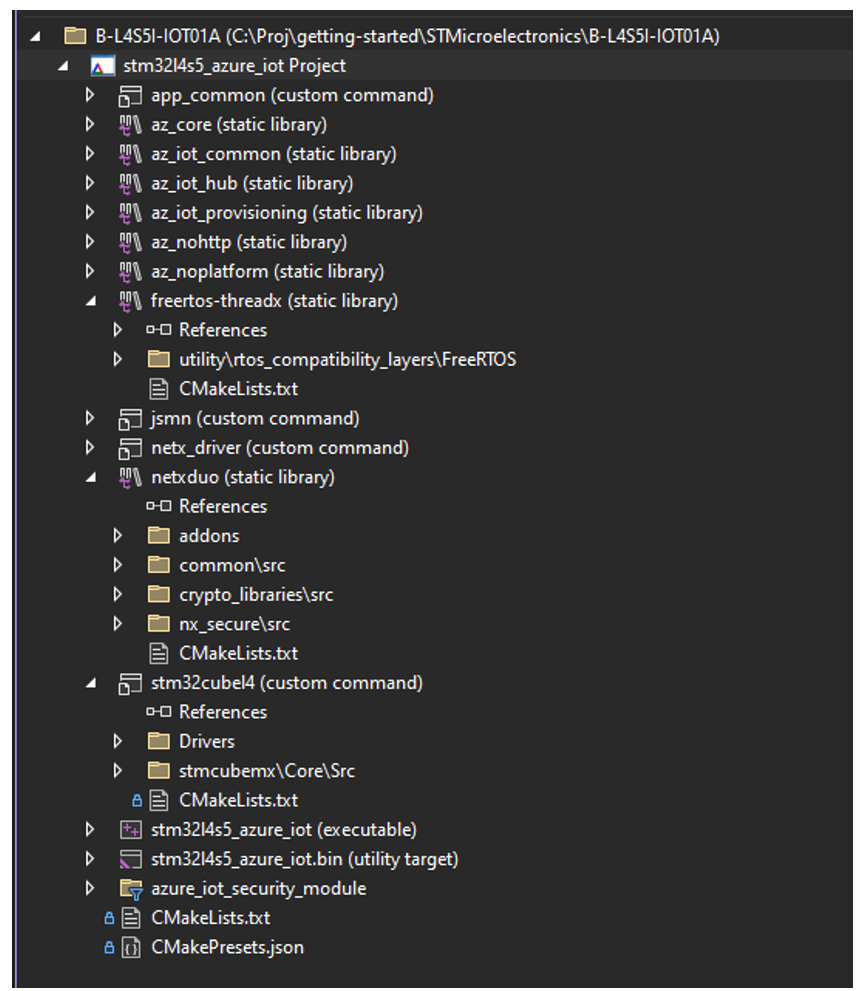
You can also now define in your VSWorkspaceSettings.json items to exclude from the CMake Targets View using the new CMakeTargetsViewExcludedItems field, which is an array of strings.
To view more details, please see this blog post Enhancing the CMake Targets View in Visual Studio – C++ Team Blog
You can also simply navigate to the CMake Targets View by right-clicking anywhere in your Solution Explorer and selecting Switch to CMake Targets View
 ’
’
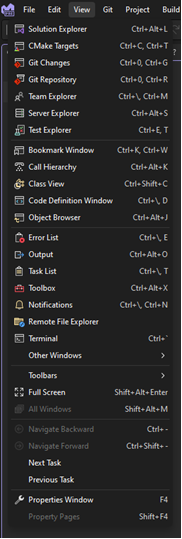
You can also access the CMake Targets View by selecting it from the View dropdown now.
Additionally, the CMake Targets View has been simplified so that users don’t have to click through folders without buildable executables to get to their desired target.
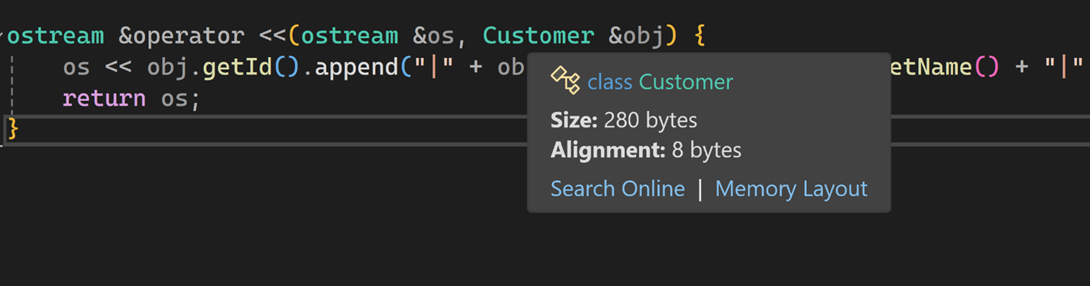
Size and Alignment of C++ Classes, Structs, and Unions
Based on feedback from you, we have introduced a Size and Alignment feature. This feature enables you to visualize the size and alignment of your data types, such as classes, structs, unions, base types, or enums, without compiling your code. To check the size and alignment, hover over the identifier and a Quick Info tooltip will display the information. To use this feature, hover over the identifier and a Quick Info tooltip will display the details.
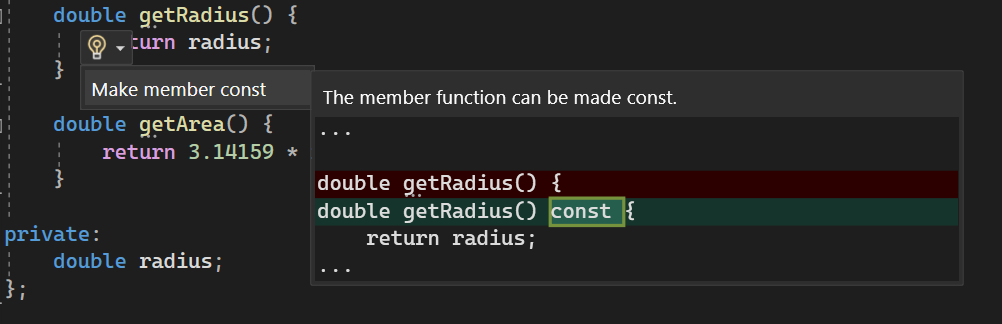
Make member function const hints
You can now use this new feature that suggests making a member function const if it logically should not modify the object’s state. The use of const member functions is crucial for achieving const-correctness in C++ code. When a member function is declared as const, it can be safely invoked on const objects, enabling you to create const-correct code and avoid unexpected side effects when working with immutable objects.
One of the advantages of utilizing const member functions is the enhanced safety and predictability they bring to the codebase. By clearly distinguishing between functions that modify the object’s state and those that do not, it becomes easier to reason about the behavior of different member functions.
By hovering over a member function and clicking the light bulb icon, you can quickly access suggestions to mark the function as const.
By default, this feature is set as a suggestion, indicated by three dots below the function. To configure the setting, navigate to Tools > Options > Text Editor > C/C++ > Code Style > Linter.

C++ Standard Library
The Standard Library Modules standardized in C++23 are now available in C++20 mode. This is a cross-vendor extension, planned or supported also by libstdc++ and libc++.
We have also implemented several new C++23 and C++26 features, including augmented support for Freestanding implementations and support for std::stacktrace in std::format. Read all the details in the STL Changelog.
Unreal Engine Test Adapter
Special thanks to the folks at Rare who contributed tremendously to this feature.
Streamline your testing process without leaving the IDE with Unreal Engine Test Adapter. You can now discover, run, manage, and debug your Unreal Engine tests. In Visual Studio 2022 version 17.8, your Unreal Engine Tests will automatically show up when you open Visual Studio. To see your tests, you can open Test Explorer with View > Test Explorer.

The latest version of our free Visual Studio Tools for Unreal Engine is required to use Unreal Engine Test Adapter. In addition, ensure the “Unreal Engine Test Adapter” component in the “Game development with C++” workload is enabled in the Visual Studio Installer.
Unreal Engine Code Snippets
Write code more efficiently with Unreal Engine Code Snippets. In Visual Studio 2022 version 17.8, you can find common Unreal Engine constructs as snippets in your member list. To get started, type any Unreal Engine construct name, for example uclass. Press Tab or Enter to expand the snippet.
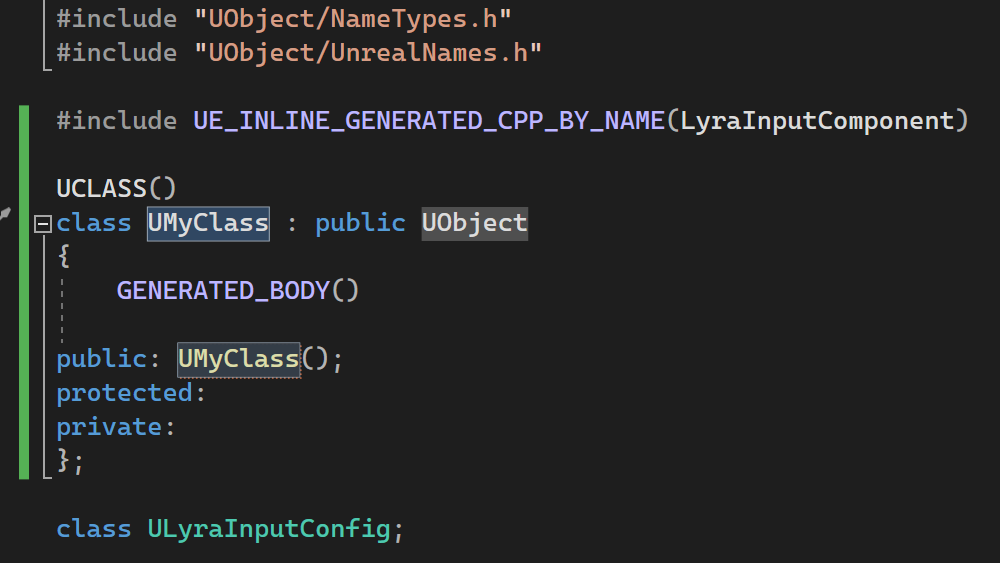
We have also included exported versions of UCLASS (uclass, uclassexported), UINTERFACE (uinterface, uinterfaceexported), and USTRUCT (ustruct, ustructexported) for those working with exported APIs and plugins. In addition, we have included macros such as SWidget (swidget), TActorRange (tactorrange), TObjectRange (tobjectrange), and WITH_EDITOR (witheditor) based on your feedback.
List of Supported Snippets
- uclass
- uclassexported
- uenum
- ufunction
- uinterface
- uinterfaceexported
- uproperty
- ustruct
- ustructexported
- uelog
- swidget
- tactorrange
- tobjectrange
- witheditor
Unreal Engine Macro Specifier Suggestions
This is currently an experimental feature and will be gradually made available to Unreal Engine developers in the coming weeks.
One of the top feedback items we commonly receive is suggesting Unreal Engine macro specifiers. We are happy to share that macro specifiers will start appearing in your member list suggestions for reflection macros in Visual Studio 2022 version 17.8. This feature will help you quickly access all possible specifiers for respective macros without relying on memory or switching back and forth between Visual Studio and documentation.

Build Insights Functions View
Build Insights is now integrated with Visual Studio 2022 and works with MSBuild and CMake projects using MSVC. In Visual Studio 2022 version 17.8, you can now see additional information relating to function generation. The new Functions View will provide you with how long a function takes during compilation as well as the number of ForceInlines associated.
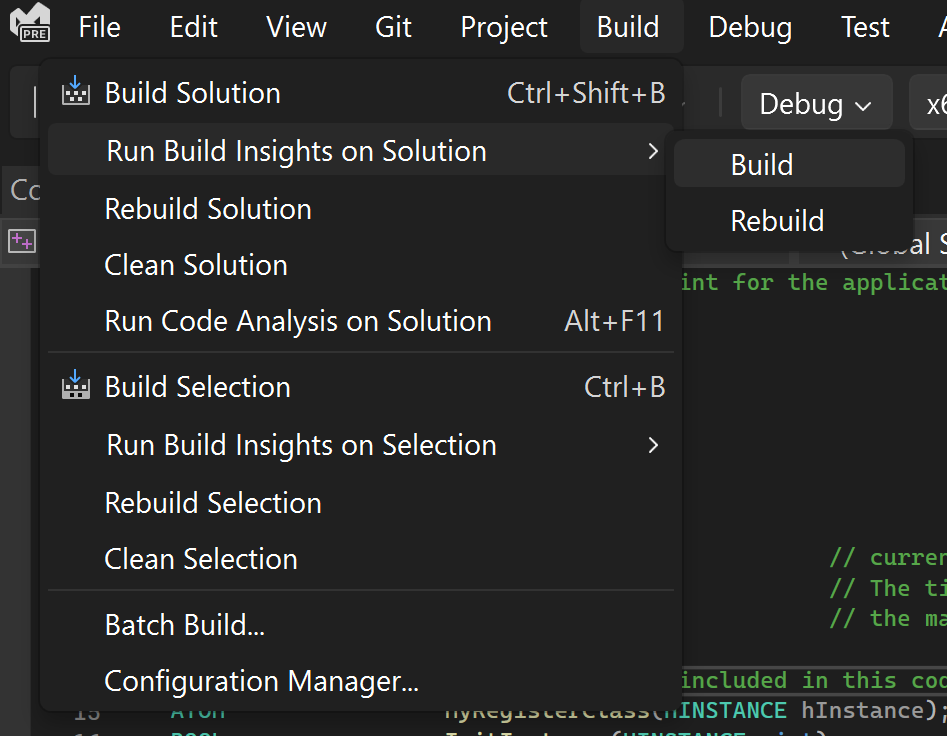
Start your Build Insights .etl trace capture by going to the Build Menu.
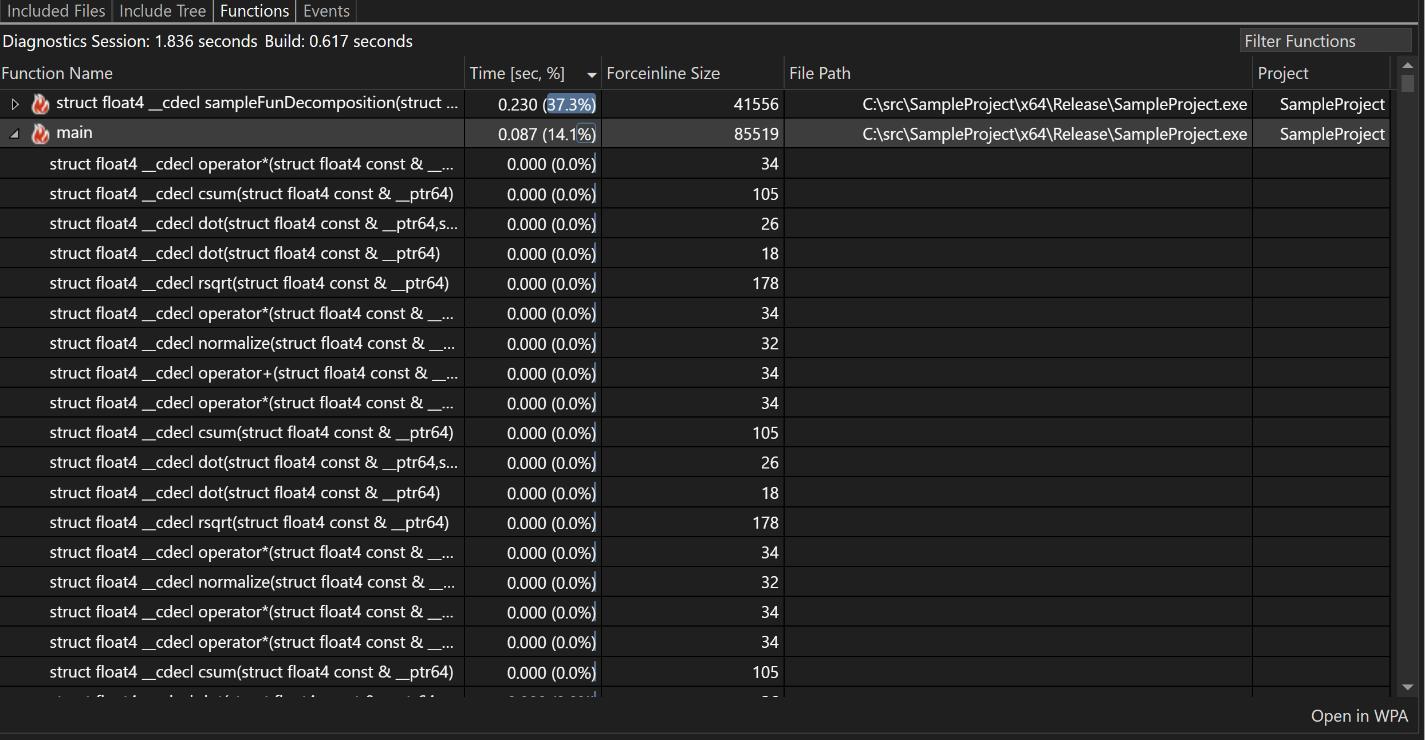
After compilation, Build Insights will create a diagnostic report that shows you function generation time as well as ForceInlines.
Structured Diagnostics
C++ compiler errors can be long and unwieldy. To address this, we’ve created a new Problem Details window which allows you to navigate compiler errors in a structured way. The Problem Details window can be opened by clicking the Details icon for an entry in the Error List.
Entries in the Problem Details window can be expanded to view nested information about the error from the compiler.
C11 Threading Support
We have now implemented support for the optional C11 threads library.
Unlike with C11 atomics there is no compatibility between C11 threads and C++ threads, but C++ programs can include the C11 threads header and call the functions just like any C program. The implementations are distinct.
C11 contains support for threads and a variety of supporting concurrency primitives including mutexes, condition variables, and thread static storage. (All of which are implemented)
Remote File Explorer Updates
Now, in the Remote File Explorer you can view and edit your remote files by double clicking on them, editing, and saving them like you would normally through the Solution Explorer.
Size and Alignment Hints
With this feature, you can effortlessly check the size and alignment of classes, structs, unions, base types, and enums right within your code editor, without the need to compile your code. When you hover over these elements, Quick Info will display their size and alignment information. You have the flexibility to hover over the names of classes, structs, or unions anywhere they appear in your code, not just at their declarations. This eliminates the need to scroll and search for their declarations, allowing you to effortlessly access their size and alignment information from any part of the codebase.

F#
New code fix
We introduced a code fix that changes equals (`=`) to a colon (`:`) in record field definitions. This mistake is especially common among newcomers to F#.
Improved autocompletion
F# autocompletion is now enhanced in various scenarios. This includes:
- Anonymous record fields
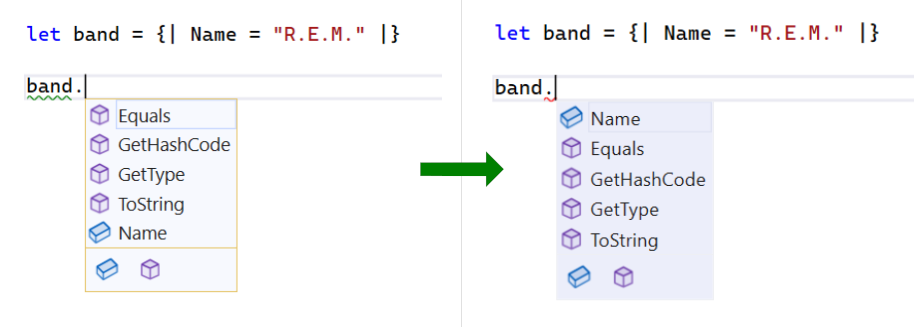
- Union case fields

- Discriminated union case fields
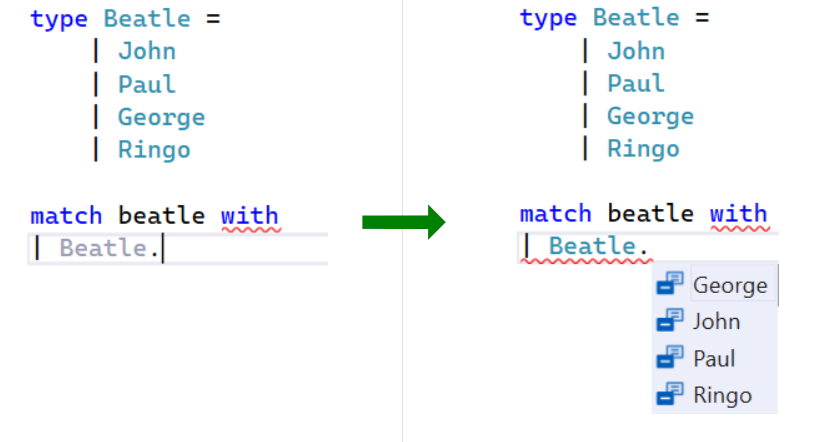
- Enum case value expressions
![]()
Reduced noise in parameter name hints
Now, the hints are hidden for argument names that match discriminated union fields. This contributes to the hints’ goal to only show the information which is not obvious otherwise.

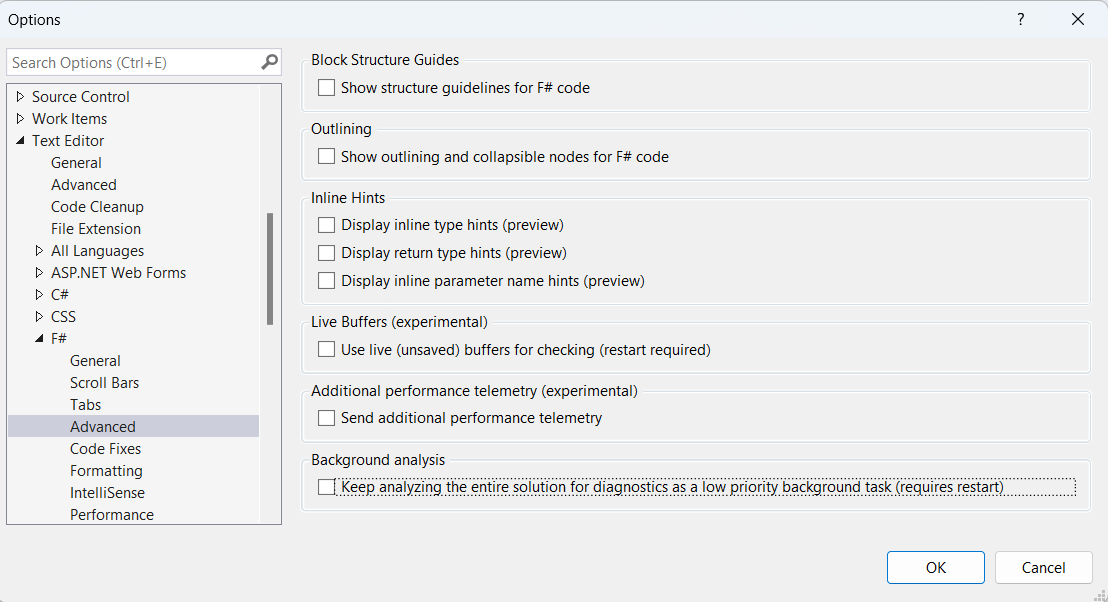
Diagnostics for unopened files
We implemented an option to activate diagnostics for unopened files. This is turned off by default for performance considerations (read details here). You can enable this capability in the Tools > Options > Text Editor > F# > Advanced > Background Analysis:
.NET/C#
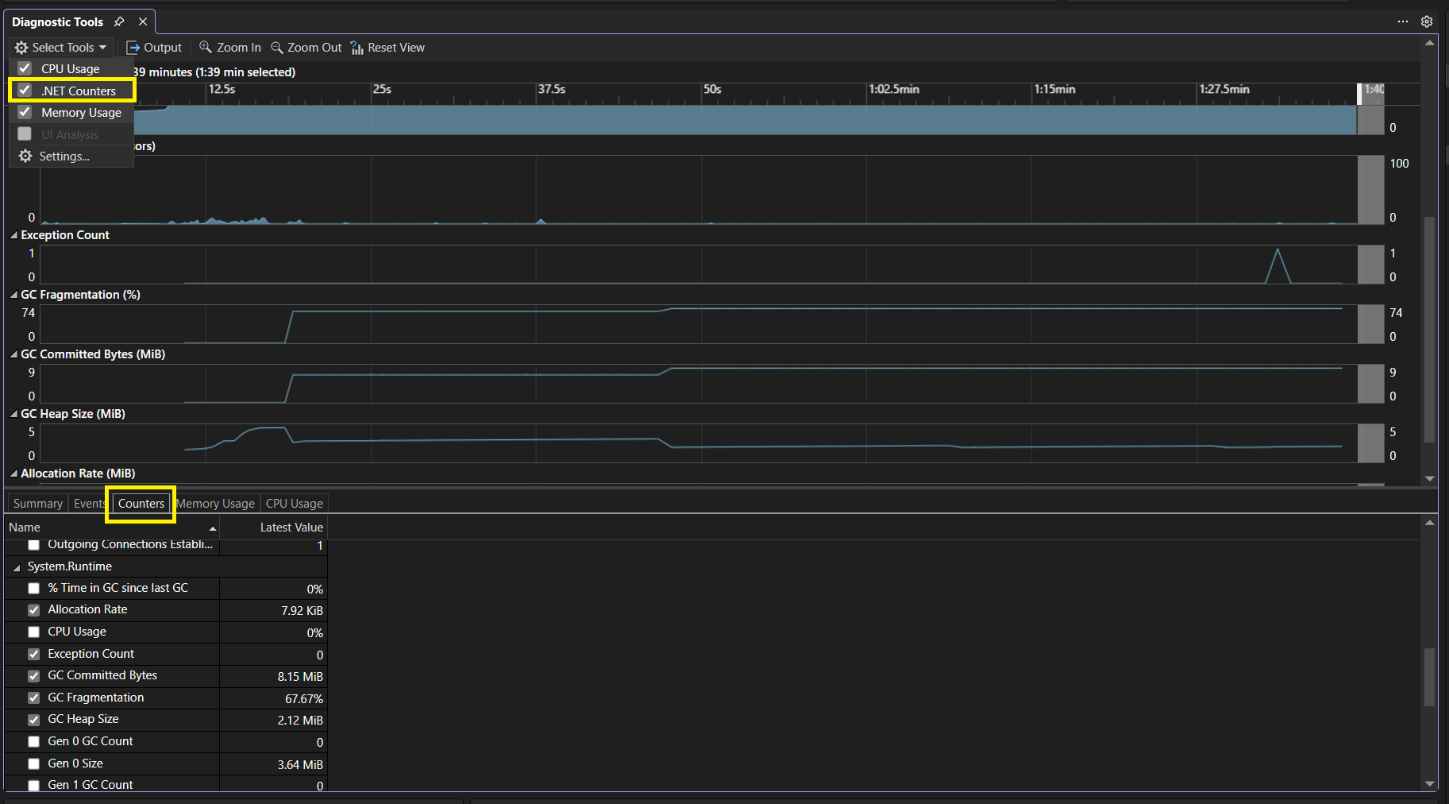
.NET Counters Tool in Debugging Scenario
The .NET Counter tool is now available within the diagnostics window now.
This means even during debugging sessions; you can still leverage the power of .NET Counters to monitor and analyze critical performance metrics. Simply Select the “.NET Counters” option under the “Select Tool” dropdown to enable it.
The tool’s seamless integration in both Performance Profiling and Debugging environments provides comprehensive insights and enhances their ability to optimize application performance effectively.
Safely use secrets in HTTP requests
When developing Web APIs in many cases you may need to use a secret value. We have added support for safely using secrets with HTTP files in Visual Studio. The support includes storing secrets in three different secret providers. For more info see the Safely use secrets in HTTP requests in Visual Studio 2022 – Visual Studio Blog.
.Net Counter Support for New Instruments via Meters API
The latest version of the .NET Counters tool introduces expanded functionality with the integration of the .NET Meters API, encompassing new instrument options including “Counter” and “ObservableCounter”
The “Counter” keeps track of a value changing over time, with the caller reporting updates using “Counter<T>.Add.” In contrast, the “ObservableCounter” is like the Counter but the caller takes care of keeping track of the total value. Currently .NET Counters tool reports the rate of change in the total.
You can find these metrics in the list of the .NET counter metrics roster, offering enhanced visibility into system performance and resource utilization.Furthermore, we’re actively planning to introduce additional instrument options in the future to enhance this capability even further.
BenchmarkDotNet IDiagnosers
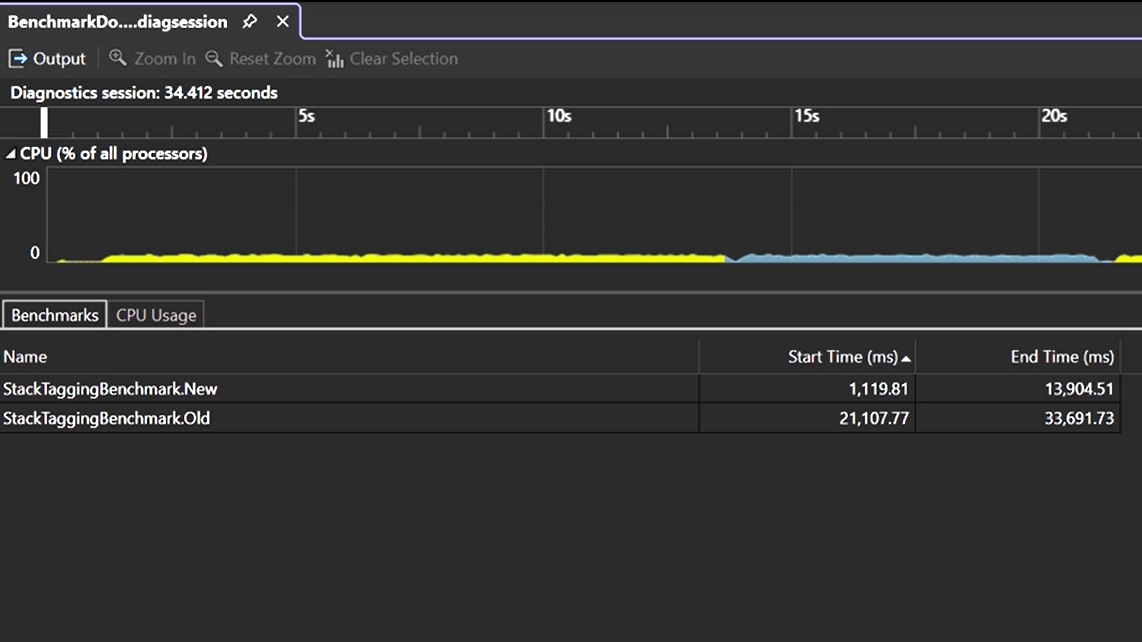
The Visual Studio Profiler has recently been enhanced to provide support for BenchmarkDotNet IDiagnosers. These IDiagnosers play a crucial role in the aggregation of diagsessions originating within BenchmarkDotNet scenarios.
The Benchmark tab offers a visualization of the executed benchmarks. It also provides the ability to precisely choose a benchmark from the swimlane by a double-clicking on a specific row.
Alternatively, you have the option to navigate to the source file through the right-click context menu. The statistical data is sourced directly from BenchmarkDotNet and is presented in a structured grid format.
JavaScript and TypeScript Development
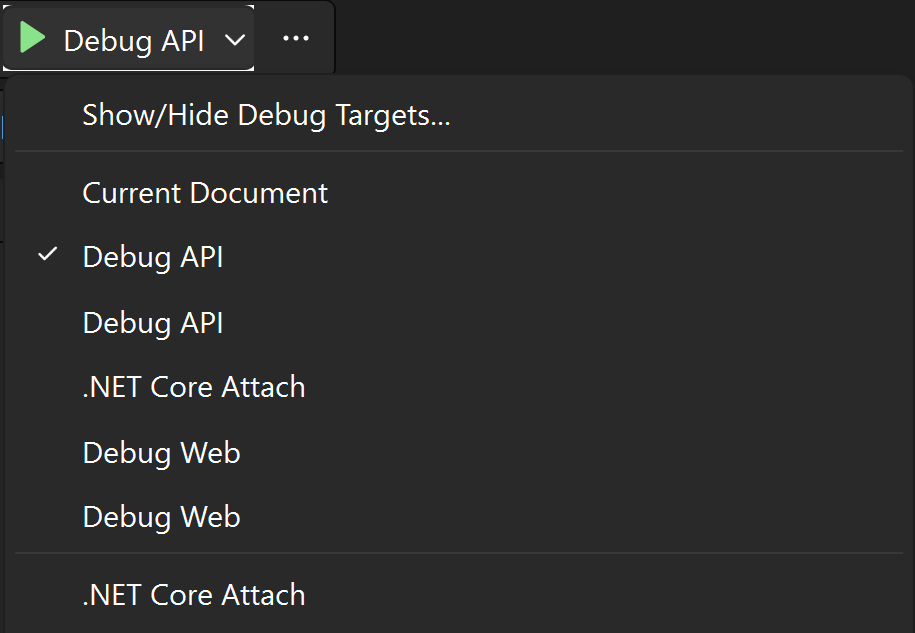
launch.json support for open folder
When you choose to open folder on your workspace with launch.json in the .vscode directory to store your launch and debug settings, it will be recognized by Visual Studio and included in the dropdown menu for the Debug targets right next to the green button.
Debugging and Diagnostics
Cross platform Enc/Hot Reload debugging support (Docker, WSL)
Added support for Edit and Continue for F5 (with debugger) and Ctrl-F5 (no debugger) scenarios when diagnosing and debugging apps hosted on Linux containers or in Windows Subsystem for Linux (WSL). Please note the F5 debugging scenario relies on .NET 8 RC1 and above.
Debug Linux App Services via Attach to Process
We are excited to unveil a powerful new feature that enables debugging of .NET processes in Linux App Services – via “Attach to Process”.
This feature empowers developers to effortlessly debug and diagnose issues within their running Linux Azure App Services instances.
To attach to a process:
1.Select Debug > Attach to Process (or press Ctrl+Alt+P) to open the Attach to Process dialog box.
2.Check the Connection type. It should be “Microsoft Azure app Service”
3.Set the Connection target to your Linux machine name.
4.Select the correct available process and click “Attach”

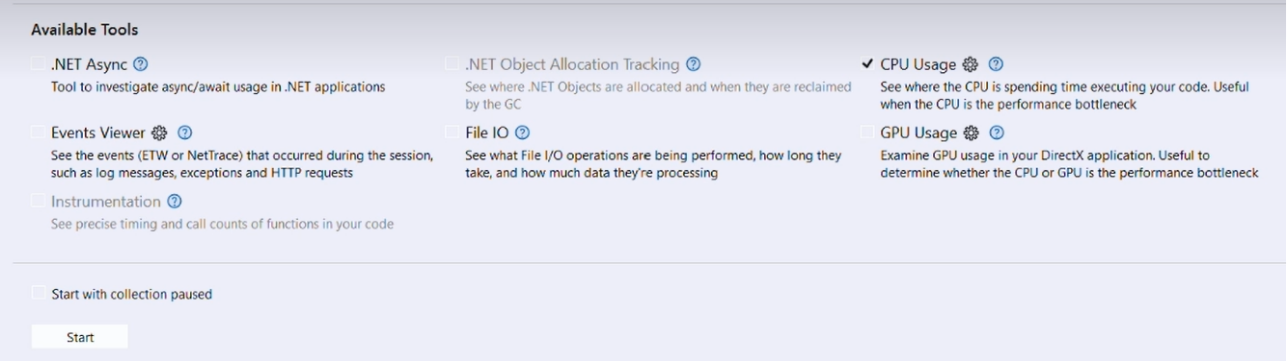
Test Profiling with VS Profiler
We are thrilled to introduce an updated Test Profiling capabillity. When you right click on your test in Test Explorer and select “Profile,” you can now select between a set of available tools including:
- CPU Usage
- GPU Usage
- File IO
- .NET Async
- Events Viewer
- .NET Object Allocation Tracking
- Instrumentation
Select which tools you want to use and click “Start” and a report will be provided.
Razor Tooling
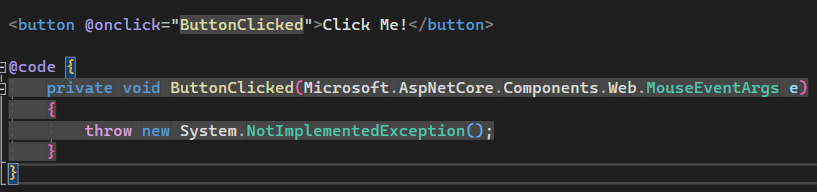
Code Action for Event Handler Method Generation
If you’re using an event like @onclick or @onactivate to reference a C# method that hasn’t been defined yet, you can use a new Razor code action to automatically generate that event handler method. This code action also supports custom event arguments.

Background Color for C# Code
For those who prefer it, you now have the option to add a background color for C# code located within Razor files. Turned off by default, enable this option by going to Tools > Options > Text Editor > Razor > Advanced and setting Background for C# Code to True.
Testing
New IntelliTest now in Preview
IntelliTest explores your .NET code to generate test suites with high code coverage. Powered by the latest version of the Z3 problem solver, it generates a varied set of inputs (scoped to those that improve code coverage) that are then plugged into what we call parameterized unit tests for each of your methods. When you Generate Tests, you have the ability to select which tests you’d like to preserve into a test project that can serve as your regression suite. As your code is updated, you can rerun IntelliTest to keep the generated tests in sync with your code.
Previous implementations of this Enterprise Edition feature only supported code targeting .NET Framework and did not support x64 configuration. This updated version includes the following:
- Add IntelliTest support for .NET Core/Standard – Developer Community (visualstudio.com)
- Add IntelliTest support for x64 – Developer Community (visualstudio.com)
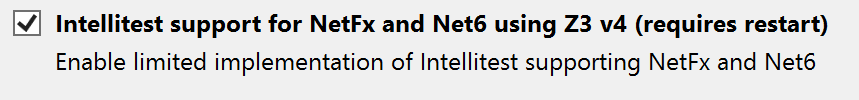
Give it a try on your projects today by enabling the feature through Tools > Manage Preview Features and selecting IntelliTest support for NetFx and Net6 using Z3 v4 (requires restart).
Then in your code, right click within a method and select IntelliTest (Preview) and either Create Project to create a project where your tests can be saved or Generate Tests to generate a set of tests to review and decide which ones to keep.

SQL Server Data Tools
MDS 3.0 to MDS 5.0 Upgrade in SQL Server Data Tools
SQL Server Data Tools (SSDT) has upgraded from (Microsoft.Data.SQLClient)MDS 3.0 to MDS 5.0. MDS 5.0 has some significant benefits over MDS 3.0. It has added support to TDS 8.0, support for specifying Server SPN and Failover Server SPN on the connection etc. Please refer to this blog for more information on the benefits of the upgrade.
For SSDT users, the major change that can be noticed is while connecting to a database. Two new fields, namely: Encrypt and Trust Server Certificate have been added to the Connect Page. This specifies the Encryption type and the requirement for a Trust Server Certificate. By default, the Encrypt is set as true or Mandatory. You can find details about this in our Microsoft Learn Documentation.
Enterprise Management
We’ve introduced a couple new features in this release that should help IT admins deploy Visual Studio across their enterprise.
Installing just the Installer
Last August in 17.7, we introduced a feature that allowed administrators to delegate control of updating Visual Studio to standard users who don’t have administrator permissions. To enable this feature, the administrator has to preconfigure the client machine by enabling a global policy, and performing the initial install of the installer. We’ve made latter step very easy to do programmatically with the following new – –installeronly parameter:
vs_enterprise.exe install – –installeronly [- -passive] [- -quiet]
Administrators can prompt users to close to unblock updates
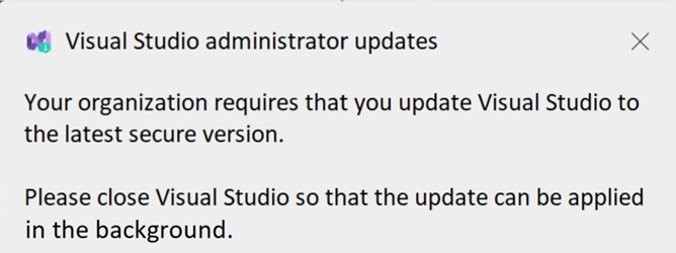
Many enterprises take advantage of our administrator update solution to deliver monthly security updates across their organization. This is our recommended best practice to stay secure. However, as some of you have realized and suggested to us, the administrator update is blocked from applying if Visual Studio is open and in use. We’ve created a new policy for administrators to set called “AdministratorUpdatesNotifications” that will, if necessary, cause a windows toast notification to appear to the user and notify them that they need to close Visual Studio. Once the user then voluntarily saves their work and closes Visual Studio, the administrator update will immediately apply.
Notification when new ‘AdministratorUpdatesNotification’ policy is set
This policy will be available in the Intune settings catalog and it’s also available in our ADMX templates.
Share your feedback and stay connected with Visual Studio!
We appreciate the time you’ve spent reporting issues/suggestions and hope you continue to give us feedback when using Visual Studio on what you like and what we can improve. Your feedback is critical to help us make Visual Studio the best tool it can be! You can share feedback with us via Developer Community: report any bugs or issues via report a problem and share your suggestions for new features or improvements to existing ones.
Stay connected with the Visual Studio team by following us on YouTube, Twitter, LinkedIn, Twitch and on Microsoft Learn.
On behalf of the whole Visual Studio team, thanks for reading and Happy Coding!!
With the new VS 2022 17.8 the Angular templates won’t work if I have installed Angular 17. Since Angular 17+ standalone components are the default, and the template fails to create the project because there is no more app.module.ts.
I think this specific problem was fixed with 17.8.1
I just downloaded 17.8.1 and yes, it is fixed! Thanks for the heads up!
17.8 is the worst release in a year or so, absolutely nothing works for us. Breakpoints are not working, styling in razor pages broken, constantly locking up, getting hot reload messages when no code has changed – it’s completely unusable.
C11 threads are still unavailable, because the header file (threads.h) was not added in 17.8. I mentioned this in the preview release of the feature in late September but I guess it was ignored.
MSVC devs might be working with a preview Windows SDK that contains threads.h, hence why it’s not available to consumers.
Any updates on the missing workloads for Visual Studio on arm? I haven’t heard much in about a year. I am planning to move to the snapdragon elite x when it releases and this is the only blocker right now.