

We hope everyone enjoyed all the new and updated features that came with our first preview of Visual Studio’s next version, and now we’re back with more! This release brings additional tools to help you improve your productivity, debug your code, as well as some additional C++ and Game Dev enhancements.
Browse this comprehensive list of enhancements and let us know which of these enhancements is your favorite:
You can delve into the complete list of enhancements by checking out the Visual Studio 2022 17.8 Preview 2 Release Notes, and we always love to know what you think with feedback through Developer Community: reports of any bugs or issues via report a problem and share your suggestions for new features or improvements to existing ones.
Productivity
Edit your Pull Request Descriptions with Markdown
Use the Markdown editor with your pull request descriptions to render headers, bulleted lists, and other Markdown syntax by clicking on the “Preview” button. Enable this via Preview Features > Git Pull Request – Markdown.
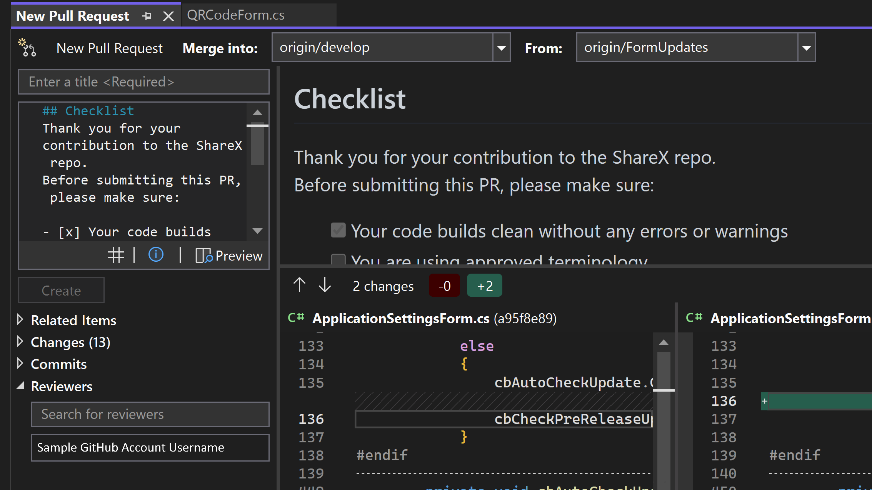
We’ve also added better error handling and improved the reviewer search. Let us know what you think of Pull Request experience here.
Summary Diff Improvements
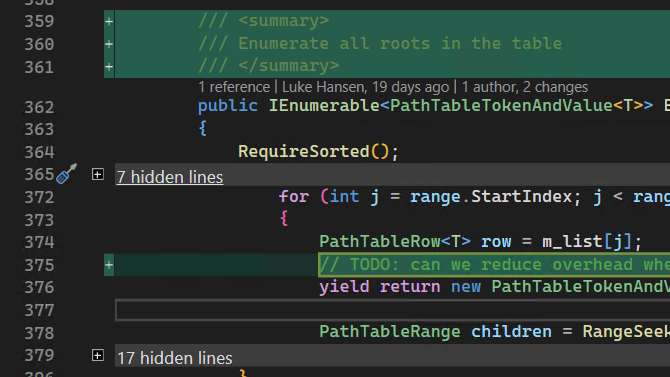
Building on Preview 1, we’ve improved the Summary Diff UI and enabled expanding and collapsing specific regions in the summary view. This allows you to get a little more context on hidden lines when necessary. Try this out by clicking the Summary button in the upper right corner when you’re comparing files or checking against previous versions of your code.
Share your feedback on this update here.
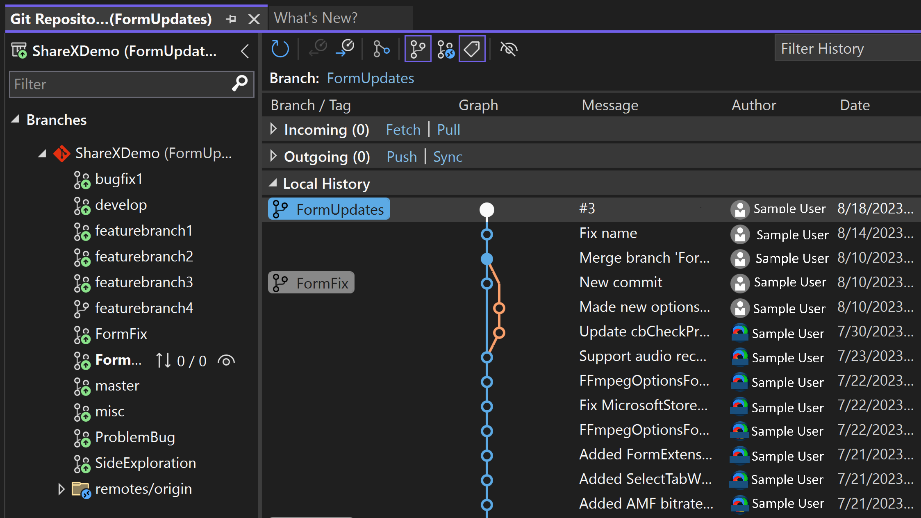
GitHub Avatars added to Git Repository Window
See your GitHub avatars in the multi-branch graph in the Git Repository Window.
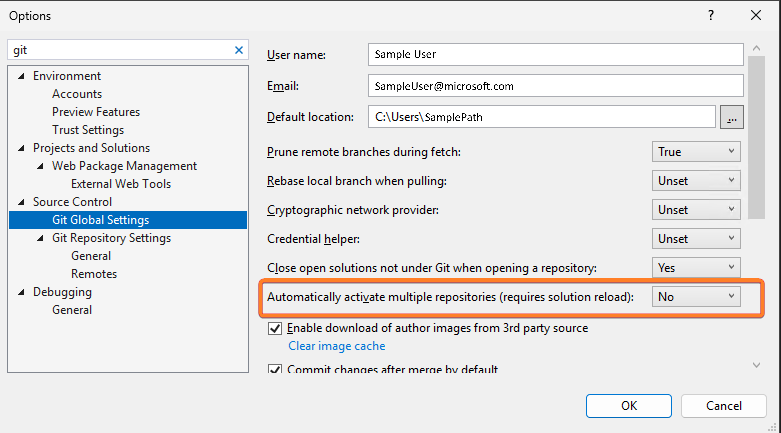
Multi-Repo Activation Setting
In some workflows, it was important to control whether multi-repo was activated automatically. With a new setting you can keep your focus on an individual repository without seeing the multi-repository UI.
C++ and Game Dev
C11 Threading Support
We have now implemented support for the optional C11 threads library.
Unlike with C11 atomics there is no compatibility between C11 threads and C++ threads, but C++ programs can include the C11 threads header and call the functions just like any C program. The implementations are distinct.
C11 contains support for threads and a variety of supporting concurrency primitives including mutexes, condition variables, and thread static storage. All of which are implemented
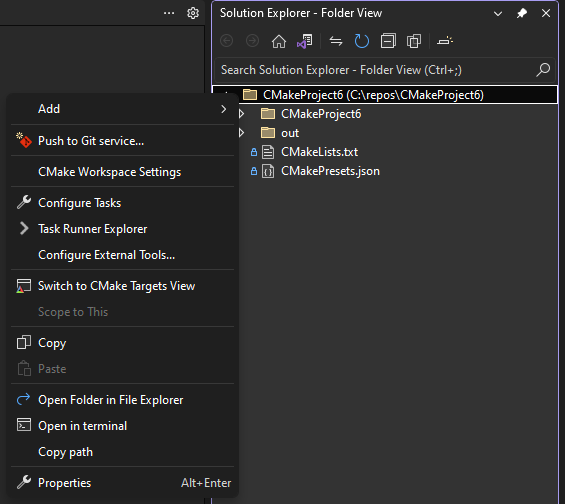
CMake Targets View updates
Now, you can simply navigate to the CMake Targets View by right-clicking anywhere in your Solution Explorer and selecting Switch to CMake Targets View
 ’
’
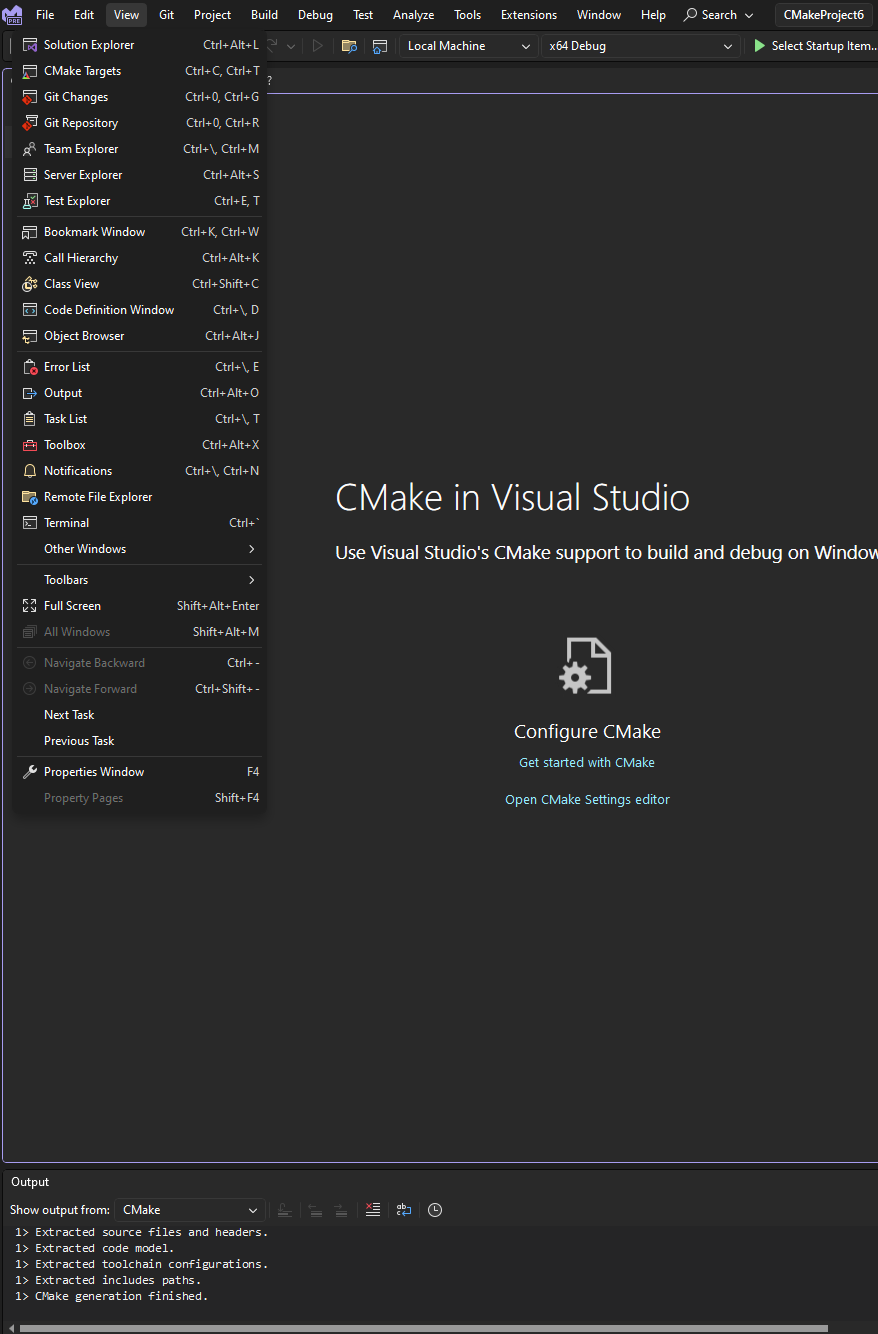
You can also access the CMake Targets View by selecting it from the View dropdown now.
Additionally, the CMake Targets View has been simplified so that users don’t have to click through folders without buildable executables to get to their desired target.
Remote File Explorer Updates
Now, in the Remote File Explorer you can view and edit your remote files by double clicking on them, editing, and saving them like you would normally through the Solution Explorer.
Make Member Function Const
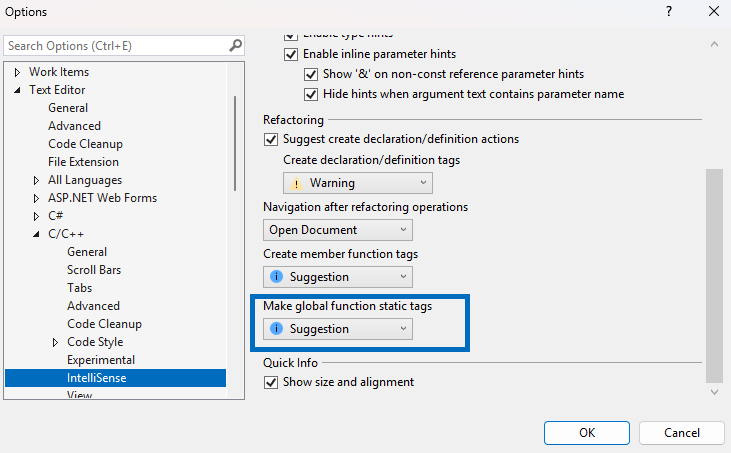
You can now easily convert global functions to static functions. When you have a free function that is not within an anonymous namespace and lacks a forward declaration in a header file, you will receive suggestions (indicated by three dots below the function name) to mark it as static. Hovering over the suggestion and clicking the screwdriver icon will provide an option to make the function static, as shown below.
You can adjust the settings for this feature by navigating to Tools > Options > Text Editor > C/C++ > IntelliSense.
.NET/C#
Safely use secrets in HTTP requests
When developing Web APIs in many cases you may need to use a secret value. We have added support for safely using secrets with HTTP files in Visual Studio. The support includes storing secrets in three different secret providers. For more info see the Safely use secrets in HTTP requests in Visual Studio 2022 – Visual Studio Blog.
JavaScript and TypeScript Development
launch.json support for open folder
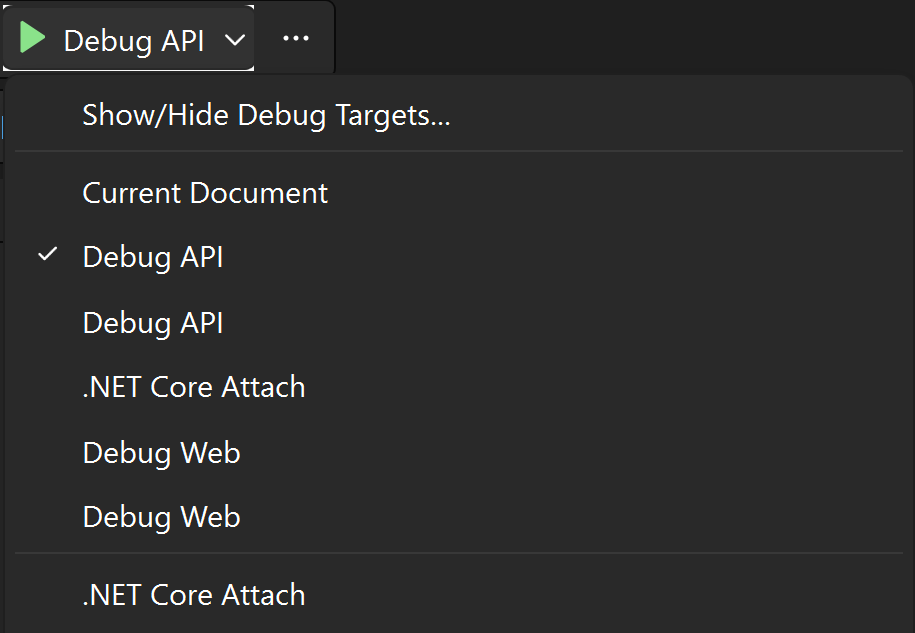
When you choose to open folder on your workspace with launch.json in the .vscode directory to store your launch and debug settings, it will be recognized by Visual Studio and included in the dropdown menu for the Debug targets right next to the green button.
F#
New code fix
We introduced a code fix that changes equals (`=`) to a colon (`:`) in record field definitions. This mistake is especially common among newcomers to F#.
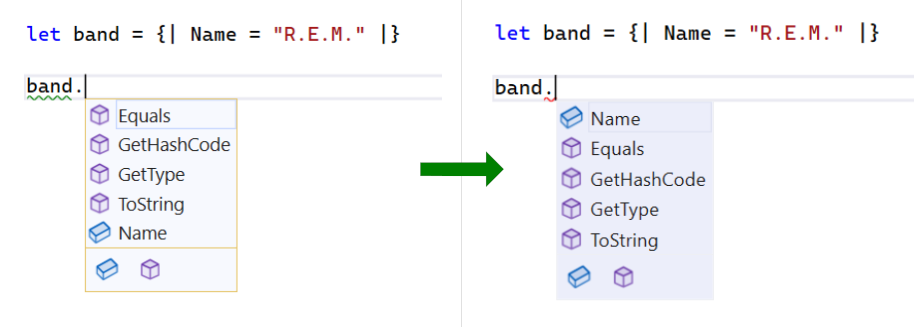
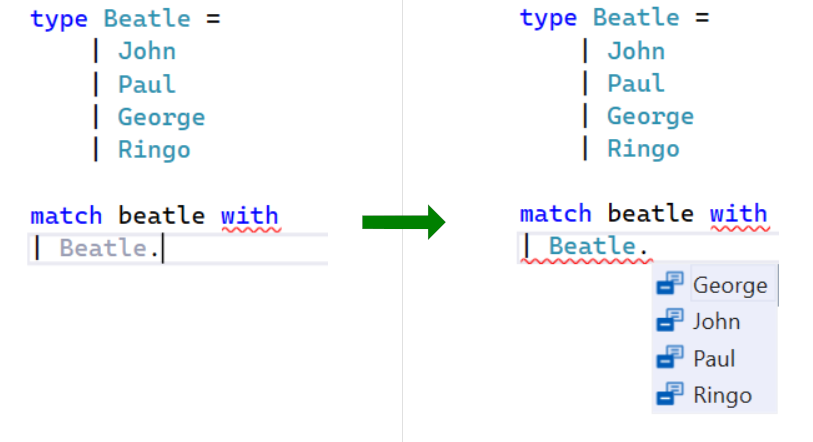
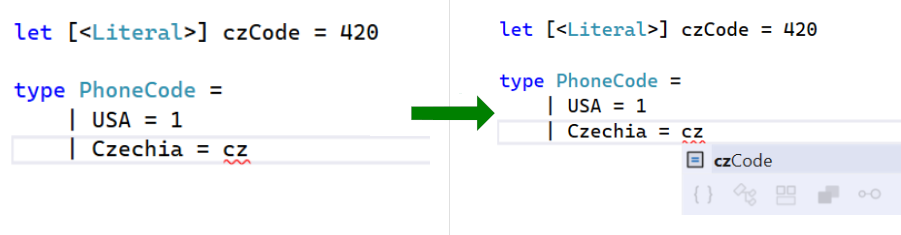
Improved autocompletion
F# autocompletion is now enhanced in various scenarios.
Anonymous record fields:
Union case fields:
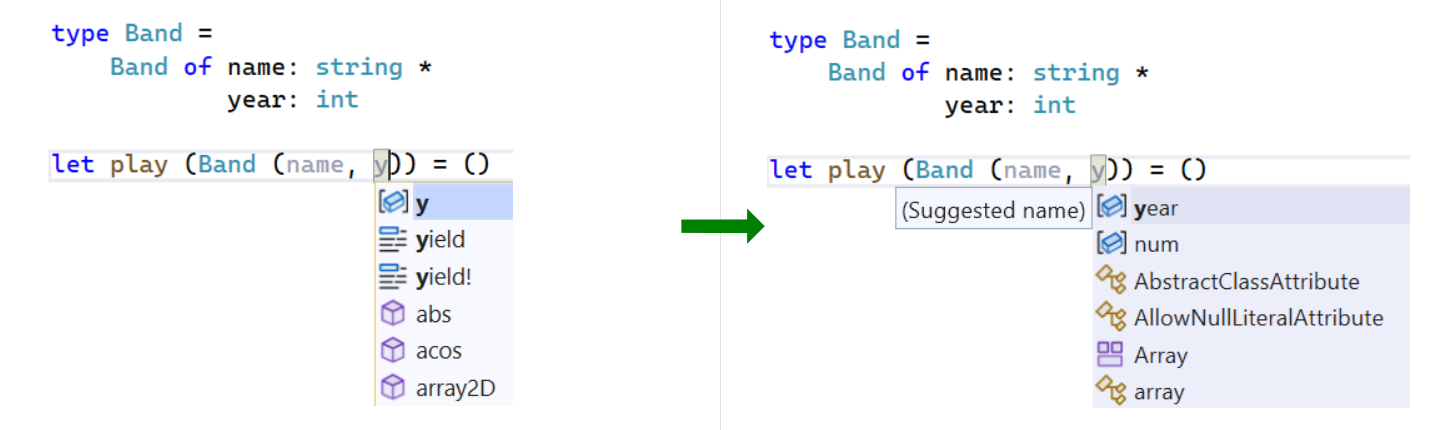
Discriminated union case fields:
Enum case value expressions:
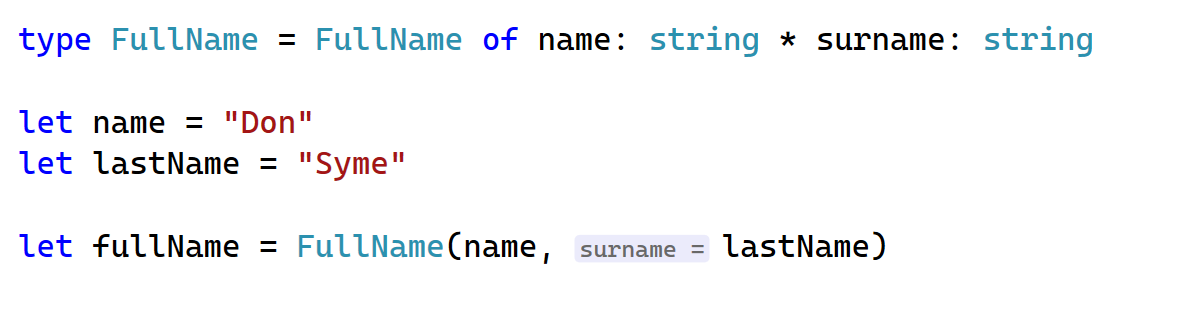
Reduced noise in parameter name hints
Now, the hints are hidden for argument names that match discriminated union fields. This contributes to the hints’ goal to only show the information which is not obvious otherwise.
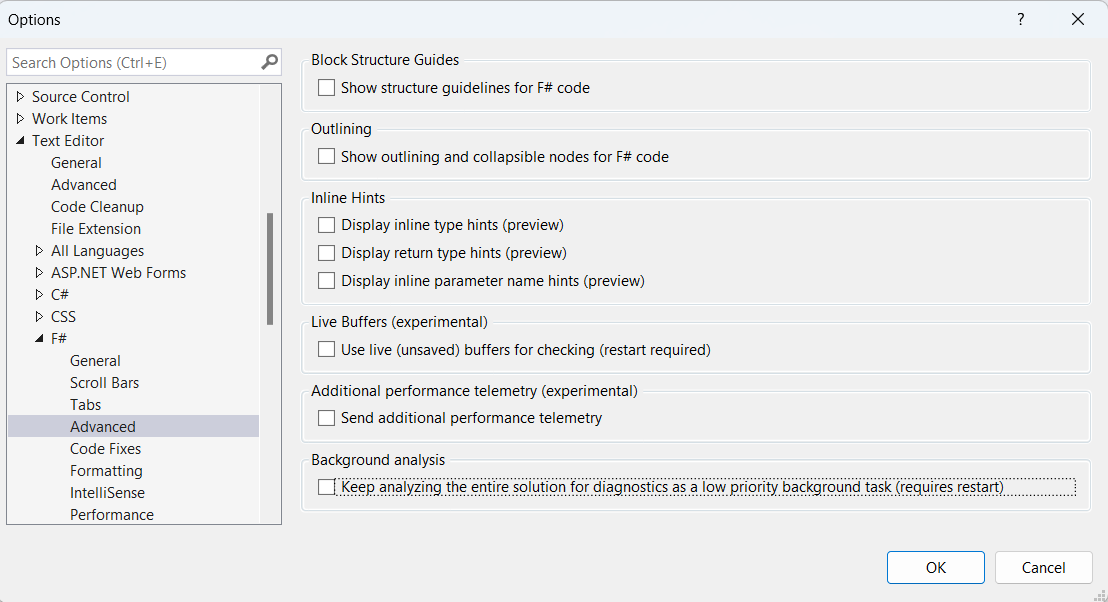
Diagnostics for unopened files
We implemented an option to activate diagnostics for unopened files. This is turned off by default for performance considerations (read details here). You can enable this capability in the Tools > Options > Text Editor > F# > Advanced > Background Analysis:
Debugging and Diagnostics
Cross platform Enc/Hot Reload debugging support (Docker, WSL)
Added support for Edit and Continue for F5 (with debugger) and Ctrl-F5 (no debugger) scenarios when diagnosing and debugging apps hosted on Linux containers or in Windows Subsystem for Linux (WSL). Please note the F5 debugging scenario relies on .NET 8 RC1 and above.
Debug Linux App Services via Attach to Process
We are excited to unveil a powerful new feature that enables debugging of .NET processes in Linux App Services – via “Attach to Process”.
This feature empowers developers to effortlessly debug and diagnose issues within their running Linux Azure App Services instances.
To attach to a process:
1.Select Debug > Attach to Process (or press Ctrl+Alt+P) to open the Attach to Process dialog box.
2.Check the Connection type. It should be “Microsoft Azure app Service”
3.Set the Connection target to your Linux machine name.
4.Select the correct available process and click “Attach”

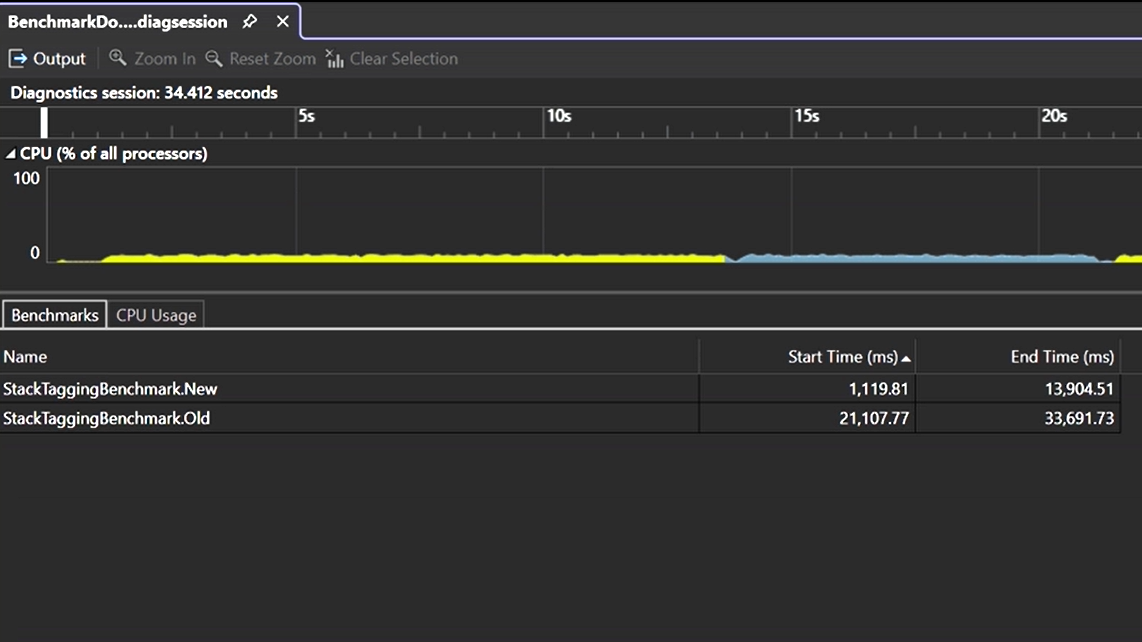
BenchmarkDotNet IDiagnosers
The Visual Studio Profiler has recently been enhanced to provide support for BenchmarkDotNet IDiagnosers. These IDiagnosers play a crucial role in the aggregation of diagsessions originating within BenchmarkDotNet scenarios.
The Benchmark tab offers a visualization of the executed benchmarks. It also provides the ability to precisely choose a benchmark from the swimlane by a double-clicking on a specific row.
Alternatively, you have the option to navigate to the source file through the right-click context menu. The statistical data is sourced directly from BenchmarkDotNet and is presented in a structured grid format.
.Net Counter Support for New Instruments via Meters API
The latest version of the .NET Counters tool introduces expanded functionality with the integration of the .NET Meters API, encompassing new instrument options including “Counter” and “ObservableCounter”
The “Counter” keeps track of a value changing over time, with the caller reporting updates using “Counter<T>.Add.” In contrast, the “ObservableCounter” is like the Counter but the caller takes care of keeping track of the total value. Currently .NET Counters tool reports the rate of change in the total.
You can find these metrics in the list of the .NET counter metrics roster, offering enhanced visibility into system performance and resource utilization.Furthermore, we’re actively planning to introduce additional instrument options in the future to enhance this capability even further.
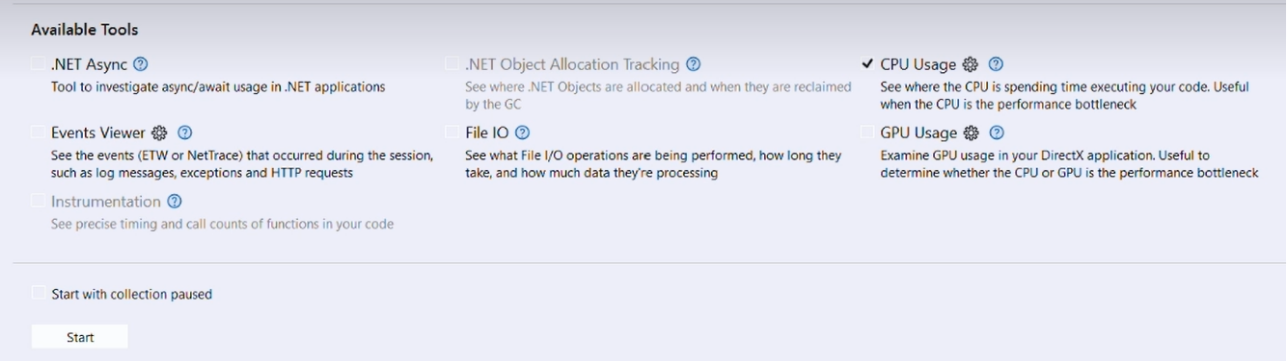
Test Profiling with VS Profiler
We are thrilled to introduce an updated Test Profiling capabillity. When you right click on your test in Test Explorer and select “Profile,” you can now select between a set of available tools including:
- CPU Usage
- GPU Usage
- File IO
- .NET Async
- Events Viewer
Select which tools you want to use and click “Start” and a report will be provided.
Enterprise Management
In the last minor release, we introduced a feature that allows administrators to delegate control of installer functionality such as update or modify to “standard” users with restricted permissions. This was one of our top requested features, because it allows organizations to follow security best practices while simultaneously allowing developers to control their development environment. In this minor release, we have streamlined the steps an administrator needs to perform to initialize the client machines.
The initial installation of the Visual Studio installer will always require administrator permissions. Standard users will not be able to perform this initial initialization step, and an administrator can’t effectively delegate standard user control until the installer is present on the client machine. Previously, an administrator would have had to install the entire Visual Studio product to just acquire the installer. In this release, we’ve made it easy for an administrator to programmatically deploy *just the installer* to a client machine by executing the following command:
vs_enterprise.exe install –installerOnly
Another feature we enabled in this release is the ability for an administrator to use the client’s registry to customize the installer’s Available tab to make custom layouts available for installation.
The collection of features described above facilitates a clean separation of responsibilities. The IT administrator can quickly and easily prepare and configure client machines within their organization by:
- Installing just the installer
- Configuring the AllowStandardUserControl policy to delegate control of installer functionality to standard users.
- Optionally customizing the installer’s Available tab to make private layouts available to install.
Once the administrator has prepped the client machines, then the end users can then be responsible for installing (from the Available tab), modifying, and updating Visual Studio.
Share your feedback and stay connected with Visual Studio!
We appreciate the time you’ve spent reporting issues/suggestions and hope you continue to give us feedback when using Visual Studio on what you like and what we can improve. Your feedback is critical to help us make Visual Studio the best tool it can be! You can share feedback with us via Developer Community: report any bugs or issues via report a problem and share your suggestions for new features or improvements to existing ones.
Stay connected with the Visual Studio team by following us on YouTube, Twitter, LinkedIn, Twitch and on Microsoft Learn.
On behalf of the whole Visual Studio team, thanks for reading and Happy Coding!
Is there any way to use the new UI?
At this time, the refreshed UI is only available internally. We’re working toward making it available more broadly as a preview feature, but we wanted to make sure we addressed the feedback we’ve already gotten before we start a broader roll out. We will be announcing when the new UI is available in the blog post where it goes live, so stay tuned here for more information.
We are now 80% through 2023 so it is ridiculous that the name is still “VS2022 Preview“. FFS retire the 22 and make the next drop “VS2023 Preview“
The product name is “VS 2022”. It was released back when 2022 was approaching. “VS 2022” is the current version of VS and will be until the next iteration comes out (generally every 3 years). Until that time “VS 2022 Preview” is a Preview of the next update to “VS 2022” for those who are interested.
“VS 2023 Preview” would indicate a Preview for the next version (“VS 2023”) but at this point no such product has been announced. Even if there was a new version then it would at least be “VS 2024” since they tend to release the next version at the end of the year.
After this update Unity namespaces no longer work, rolling back fixed the issue.
Also having a namespaces error, but not using Unity.
Visual Studio 2022 (non-Preview) works.
And rolling back to Visual Studio 2022 17.8 Preview 1 still works.
On the F# examples, Union case fields and Anonymous record fields are exactly the same screenshots.