Releasing Today! Visual Studio 2019 v16.6 & v16.7 Preview 1
Microsoft Build 2020 begins today! Our entire Visual Studio team has been eagerly awaiting this virtual event as it represents great effort and dedication from all of our team members and partners. We anticipate the announcements and demonstrations showcased this week will impact your work. Consequently, we and are eager to hear your favorites. The first releases out of our home offices are Visual Studio 2019 version 16.6 and 16.7 Preview 1. Both of these have productivity features to detail in a moment, but we have one more big announcement. Visual Studio Codespaces, our cloud-hosted development environments that allow you to leverage the power of the cloud for your edit-build-debug cycle, is in private preview. The next steps are to learn more about Visual Studio Codespaces and sign-up.
While you take in a virtual Build 2020 session, why not download our latest version of Visual Studio 2019 and let us know what you think?
New in Visual Studio 2019 version 16.6
First thing to mention are a number of exciting capabilities we have previously outlined in the Visual Studio 2019 version 16.6 preview 2 and 16.6 preview 3 blogs which are generally available today such as:
- Improved snapshot debugging experiences that removes the friction in using the snapshot debugger for the first time.
- .NET Async tool for profiling .NET apps.
- .NET Productivity Quick Actions and Refactorings
- Terminal with the ability to open multiple instances, customize font face and sizes, and automatically generate profiles for CMD, PowerShell and WSL distributions.
- Web Tools new experience for configuring Azure services and emulators
- A variety of new C++20 Standard Library features including an initial implementation of <span>. The STL Changelog on GitHub includes a detailed list.
Updates for C++
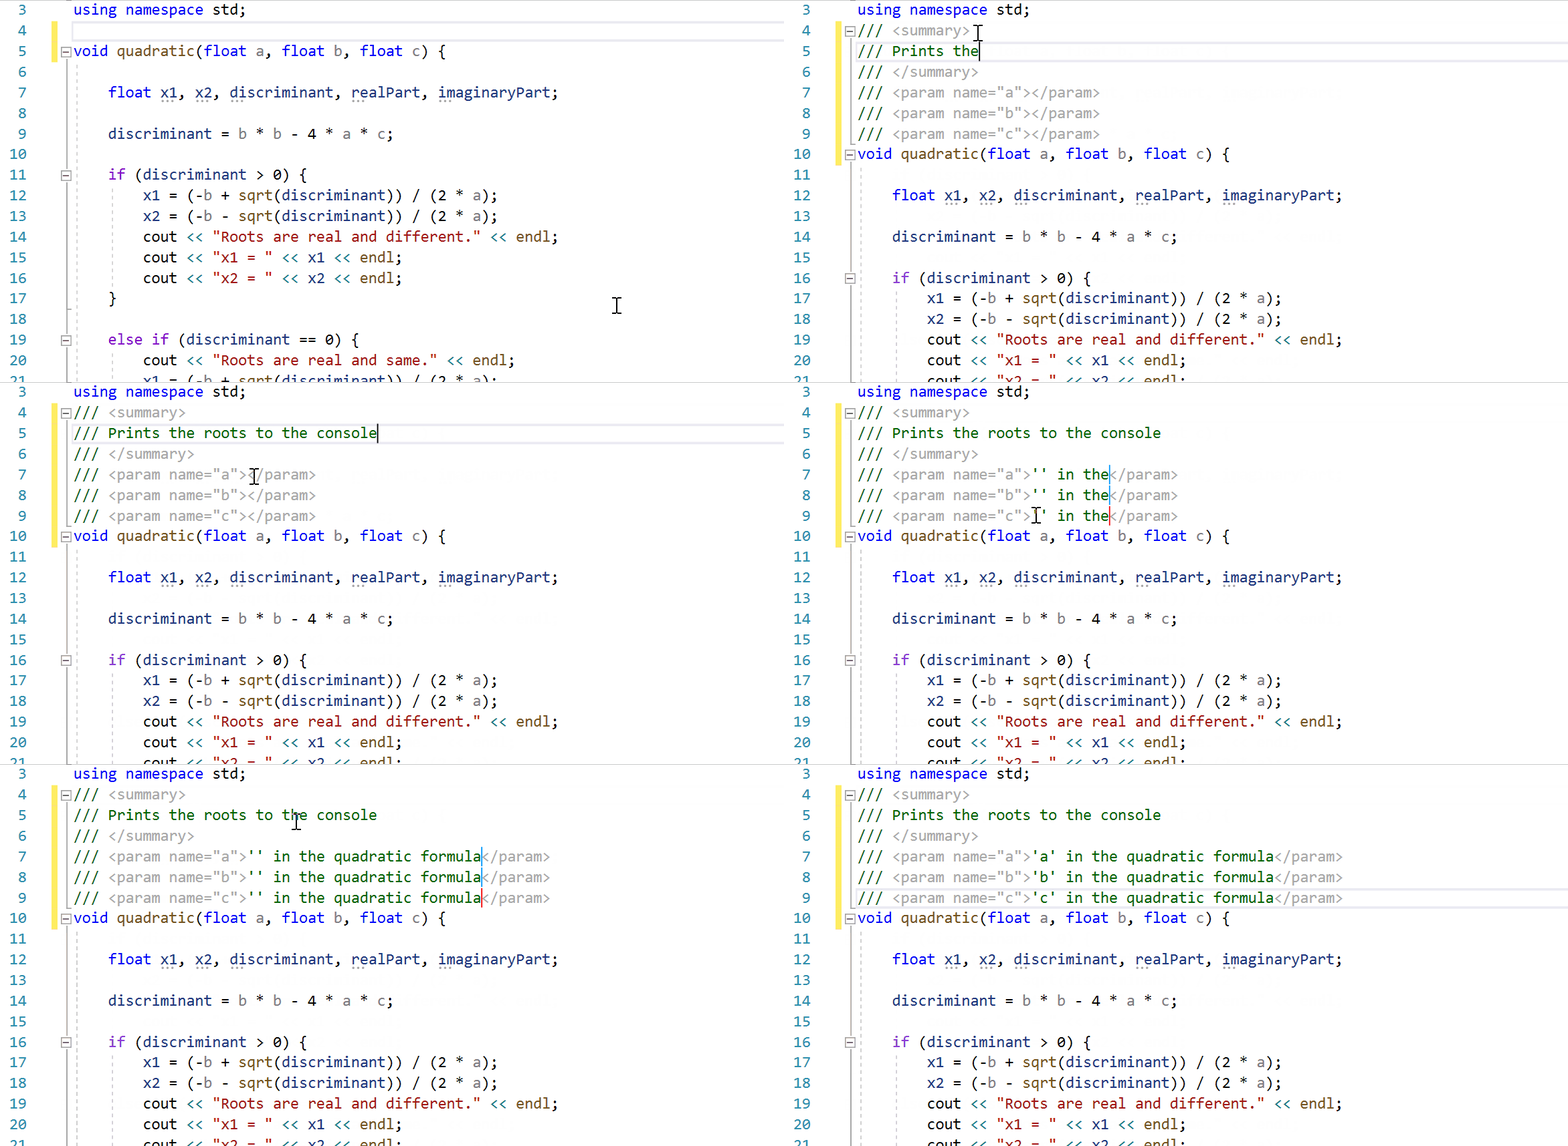
Next, our C++ team would like to highlight the ability to generate Doxygen or XML doc comment stubs automatically by typing either /// or /** above functions, or by using the Ctrl+/ shortcut. These comments now appear in Quick Info, Member List, and Parameter Help tooltips as well.
Windows Forms Designer for .NET Core
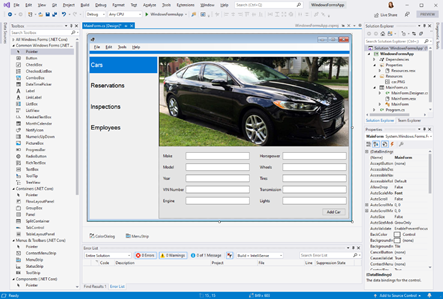
The Windows Forms designer for .NET Core projects is also now available. The designer has all Windows Forms controls except DataGridView and ToolStripContainer which is coming soon. In addition, all other design functionality includes: drag-and-drop, selection, move and resize, cut/copy/paste/delete of controls, integration with Properties Window, events generation and more!
To enable the designer in Visual Studio 2019, go to Tools > Options > Environment > Preview Features and select the Use the preview Windows Forms designer for .NET Core apps option.
New in Visual Studio 2019 version 16.7 Preview 1
Git Productivity
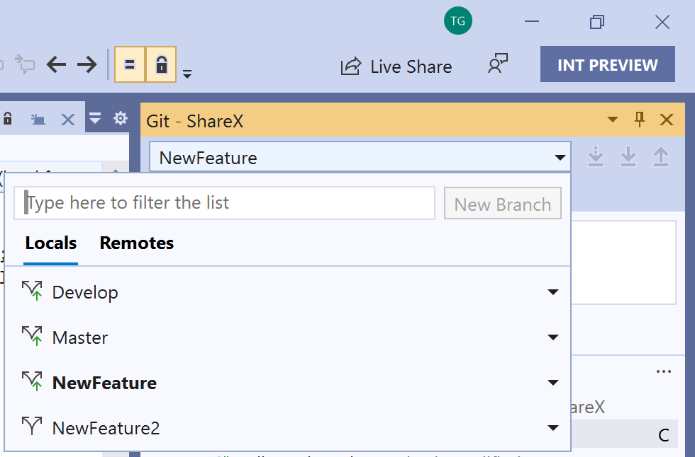
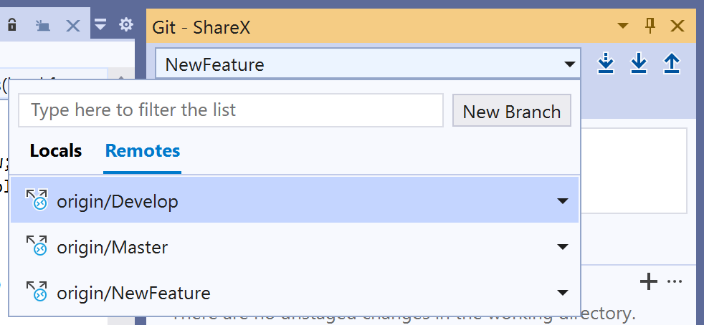
Once again, we have continued to make further improvements in the new Git experiences within Visual Studio. We enhanced the branch picker in the Git tool window by adding special icons for remote tracking branches. This allows you to differentiate between local branches and remote tracking branches. We also added special icon indicators to remote branches making it easier to differentiate between these three branch types.
C++ Address Sanitizer
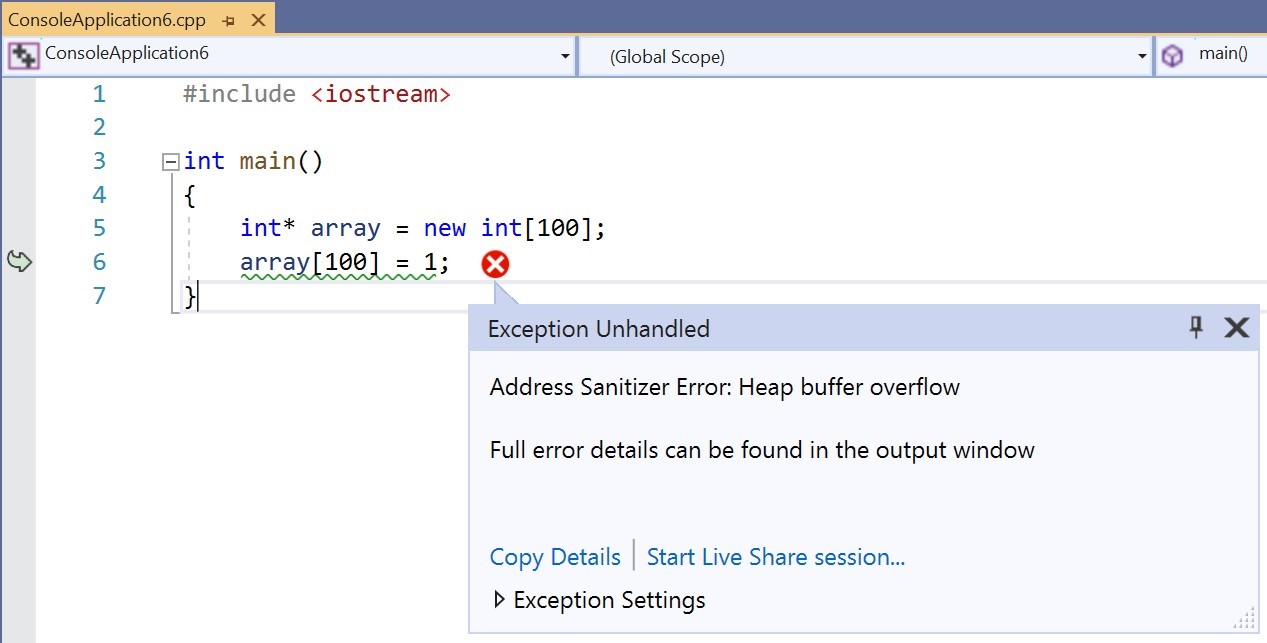
You can start using Address Sanitizer in the MSVC toolset for X64 as well as debug configurations. The ASAN runtime now supports X64 and debug switches /MTd, /MDd, and /LDd. Our C++ blog has more information about how C++ Address Sanitizer can help you find memory corruption errors easily.
Intellisense Code Linter
To help you better identify and fix defects as you write and edit your code, we’ve included a new IntelliSense code linter to check your code as-you-type, offer lightbulb actions, and underline problems via squiggles in the editor window. As this is built on top of IntelliSense, it checks focus on easily-detected issues and are available faster than those via our other, more complex analysis tools such as Background Code Analysis using MSVC and Clang-Tidy integration.

.NET Productivity
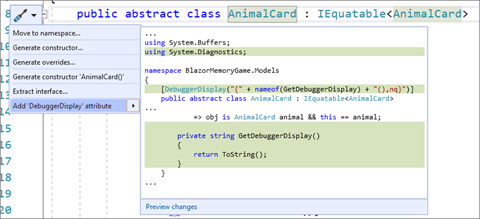
The first new addition is a quick action to add a debugger display attribute to a class. This allows you to pin properties within the debugger programmatically in your code. Additionally, there is a new code fix for accidental assignments or comparisons to the same variable.
To give this feature a try, place your cursor on the class name and use Ctrl+. to trigger the Quick Actions and Refactorings menu. Select Add ‘DebuggerDisplay` attribute. This will add the debugger display attribute to the top of your class and generate an auto method that returns ToString() which you can edit to return the property value you need pinned in the debugger.
The next change comes in IntelliSense completion in DateTime and TimeSpan string literals. You can see completion options and explanations as to what each character means with date and time formats including examples. Using Ctrl + Space within the DateTime or TimeSpan string will show you this feature in action.

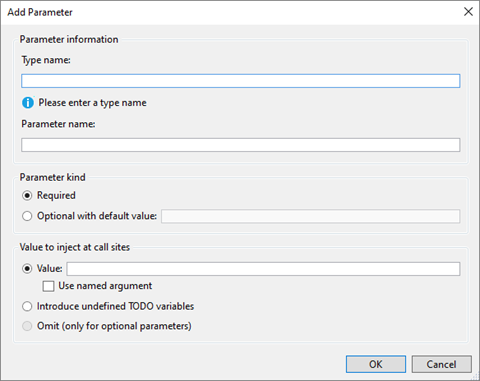
Another option added to the Quick Actions and Refactorings menu, is the ability to add a parameter within the Change Signature dialog. With just a couple of clicks, you can select Change signature. A dialog box will open where you are able to add a type and parameter name. You can chose to make the parameter required or option and set a default value to the call site or introduce a TODO variable into your code. This allows you to visit each error and call site independently to decide which value to pass. If you wish to skip a particular parameter, there is an omit option for added flexibility.
IntelliCode
IntelliCode has been updated in Visual Studio 2019 16.7 Preview 1, and now provides starred recommendations for function arguments. This happens as a natural process while you’re writing C# code. It can’t get easier to give this feature a try. Just start editing your C# code!
XAML Tooling Improvements WPF, UWP, & Xamarin.Forms
Coming from our XAML team are several new features for developers who build applications using XAML such as WPF, UWP, and where applicable, Xamarin.Forms. These features include a new color visualizer in the code editor and an early preview of a new XAML Designer feature called Suggested Actions.
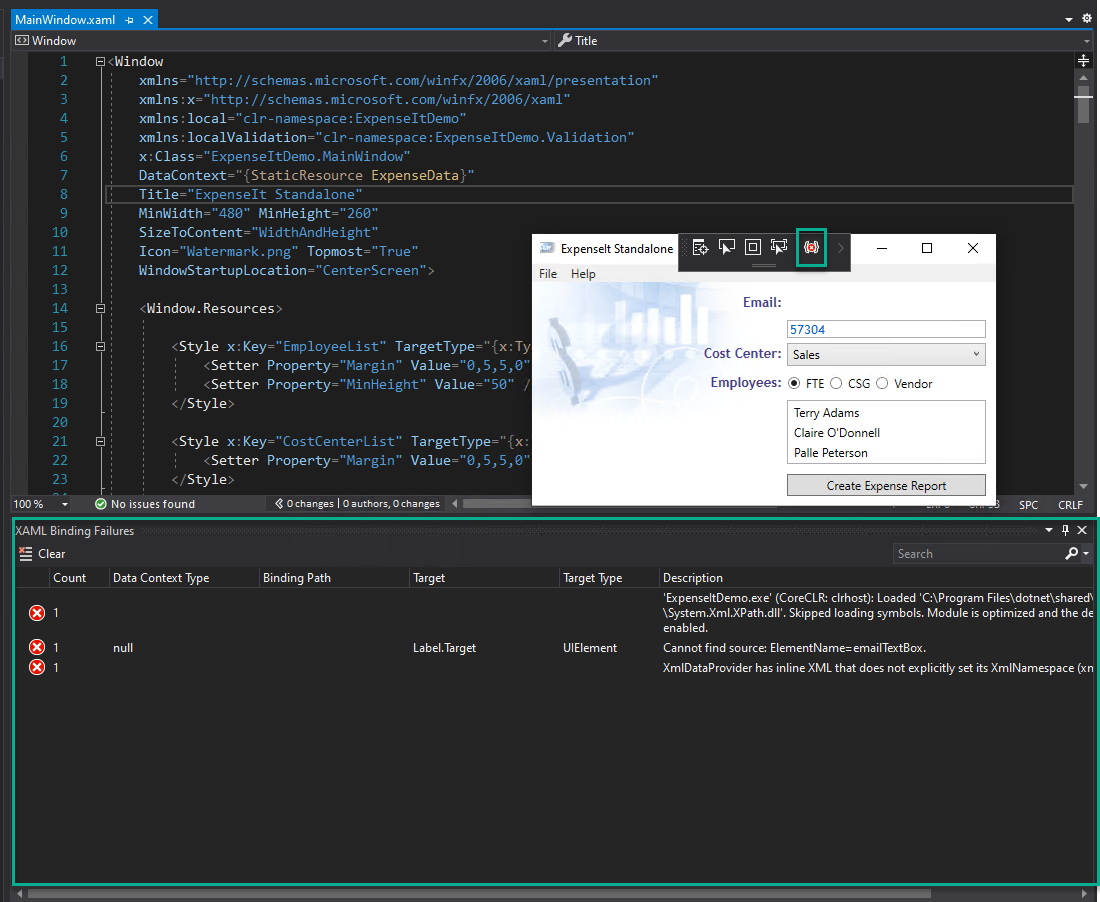
We’d also like to highlight two new features designed to enhance a XAML developer’s ability to detect a binding failure has occurred in their running application. The failure details are shown in a new dedicated panel. Specifically, we’ve added:
- New XAML Binding failure indicator icon to the in-app toolbar for WPF and UWP applications. This icon will turn red if at least one binding failure is detected. Hovering your mouse over icon will show you the total number failures in the tooltip. Clicking the icon will take you to the new XAML Binding Failures panel.
- New XAML Binding Failures panel takes the binding failures that were previously only available in the Output window and makes them easy to review in the new dedicated panel. The panel adds features such as sorting, searching, and grouping of similar errors. This panel works for WPF, UWP, and Xamarin.Forms projects. Please note, this requires Xamarin version 4.5.0.266-pre3 or higher.
Define Playlists Dynamically in Test Explorer
In our Test Explorer, there is new functionality to define playlists dynamically based on Project, Class or Namespace. This means you can configure a playlist to include everything in one of these selections. Therefore, any new test added to that specific group will automatically be included in your playlist!
To use this feature, create a playlist by right clicking on a Project, Class or Namespace grouping in the Test Explorer and select Add to Playlist.
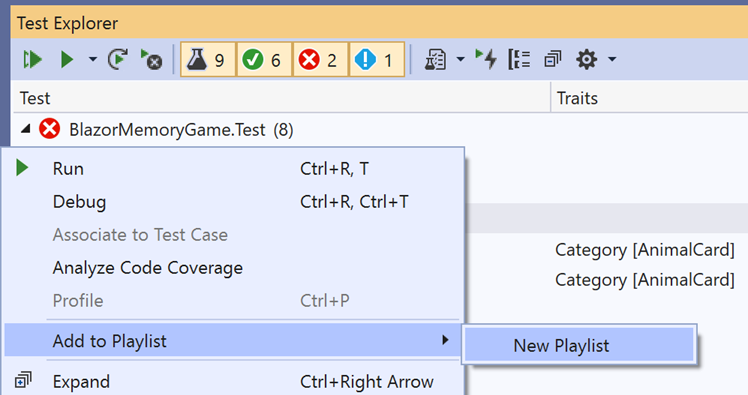
Edit what groups are included in the playlist by clicking on the edit button in the tool bar. This will bring up check boxes to modify the groups to your desire. This gives you great flexibility in your testing.
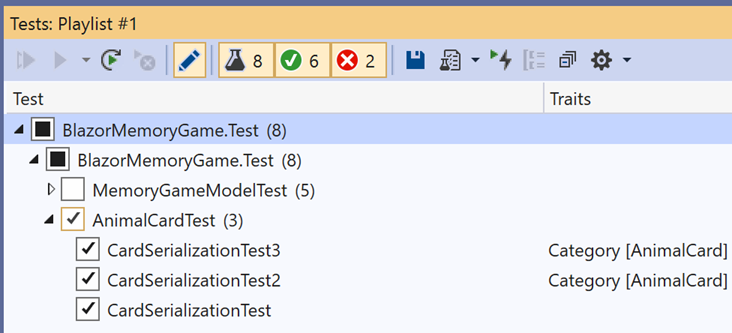
Accordingly, instead of being a static list of tests, these playlists dynamically update based on the defined rules. If you want to better understand what rules are generating your dynamic playlist, save the playlist file to disk with the Save button and view the rules generated in the XML.
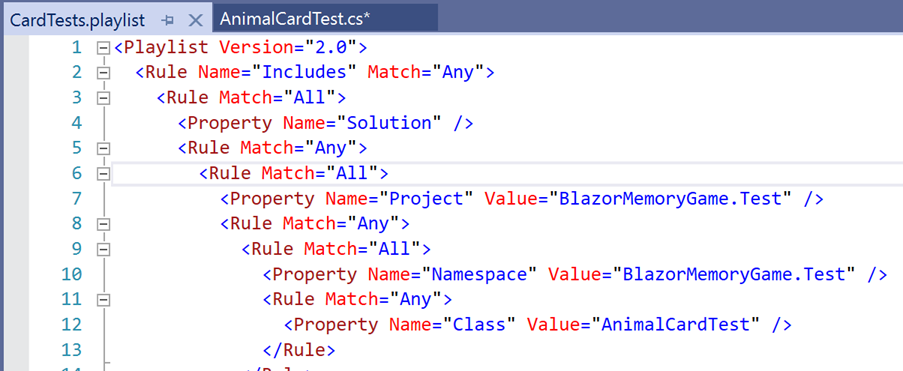
You have complete flexibility to include or exclude individual tests and the playlist. You will be able to either update its dynamic rules or switch back to a static list. Likewise, you can also use traits to define a dynamic group by editing the playlist XML directly.
Version 16.7: Our Next Servicing Baseline
When version 16.7 moves to the release channel later this year, it will be the third “servicing baseline” for Visual Studio 2019. Servicing baselines provide large organizations increased flexibility over when they can adopt the new features in minor version updates that are included in the Enterprise and Professional editions. Unlike standard minor version releases like 16.5 and 16.6 which receive servicing fixes only until the next minor update is released, we will offer fixes for servicing baselines for 12 months after the next servicing baseline is declared.
As 16.4 is the second servicing baseline, it will continue to receive servicing fixes for one year after version 16.7 releases later this year. Full details can be found at Visual Studio Product Lifecycle and Servicing.
We Look Forward to your Feedback!
From here, it is time to say how much our teams are always thrilled to have such a vibrant, participatory community. Please continue to stay active in our Developer Community as we look here first for suggestions and issues. Your excitement around our tools help motivate each of us to continually deliver new experiences to fuel your creativity in the developer space. Even if we can’t be together in person for Build 2020 this year, we hope you still have a fabulous experience with virtual sessions, product demonstrations, and the collaboration of our community towards a better world.

 Light
Light Dark
Dark
33 comments
Please update the UX when trying to stay at a servicing baseline. Having to download the updated installer each time is bad. it is difficult to know which version is lastest for servicing baseline branch. When user has a version installed that is servicing baseline, add an option in VS UI to configure update (servicing baseline, move to next stable version)
Hi Andre. Thank you for your feedback. We are aware that we need to make improvements to the user experience regarding servicing baseline configuration. While I don’t have a timeframe that I can share with at the moment, this work is on our backlog. I’ll post updates and information in a future blog. Also, feel free to offer suggestions like this using our Suggestion tool which is a button on the right side of the tool bar in the IDE. With Suggestions, other people can comment and vote and the communication tends to stay more current.
Looks like the 16.6.0 installer has a pretty bad bug that causes it to fail, wiping out the entire VS 2019 install. MS might want to pull this update until this gets fixed.
Agreed. This trashed (something to do with WMI provider) both of my VS 2019 16.5.5. installs (which normally upgrade fine) on Win 10 19041.264. The installer crashed leaving VS 2019 uninstalled. I had to re-install VS 2019 Update 6.0 from scratch on both machines.
Judging by Todd’s comments I’m not the only one.
Microsoft sort your quality control out.
Second issue: The much heralded intellisense C++ code linter (which worked in the 16.6 previews and works in 16.7 preview 1) that this very blog posts about, doesn’t work! e.g. if (i=0) {} draws no warning. The GUI option to enable it/disable it is not present, and the code is not active by default.
Microsoft sort your quality control out (AGAIN).
How many more times do VS users have to complain to senior Microsoft management about the crappy QA for VS.
I also have same problem with second issue.
Also, Intellisense for modules would be appreciated.
Did you all seriously make an announcement today for a product with “2019” still in its title?
Would you prefer that they make everyone buy it again?
I would prefer them to update this year, maybe? It literally denotes backwards thinking. Hardly a positive for branding.
That is because it’s the official name of the product. The same happens with Windows Server 2019, SQL Server 2019 and previous versions. That is really serious.
My dig was hinting that they should change the official name of the product, as they are basically bragging that it’s old and in the past. I guess that’s their intent? *shrug*
Me? I don’t care what they call it, as long as it performs the tasks advertised. If I can get my work done, and do it efficiently, I’m happy. I’m focused on results, not a name.
After the update to 16.6 i am unable to add Class files to a project. It keeps coming up with the add new Item dialog but no class files enabled .
Seems buggy to me.
What type of project do you have?
Hey Jacquelin,
I’m really happy with 16.6 ’til now. As written in another Blog I remember Visual Studio 6.0 – oh my gosh – what a big step in development since then.
You and the whole VS Team did a great job! Thank you very much.
There falls no shadow where there shines no sun – so it would be very nice (and necessary) to make third party Controls available in Forms Designer also. (Especially the DevExpress Controls). But I’m sure it will be on 16.7 🙂
Stay healthy.
Very cool! I particularly like the System.DateTime helper dropdown. Seems like something that could also be useful for other types (such as decimal, int, etc.). That made me think: wouldn’t community contributions to intellisense be fantastic? We can already contribute to roslyn with analyzers and code fixes. Any chance you could consider opensource intellisense?
UPDATE: problem is with Windows Security > Ransomware Protection > Controlled folder access, please see my comment down.
I don’t recommend updating incase the problem i’m facing is related to 16.6:
I’m unable to run/debug ANY project after this update:
1> CSC : error CS8104: An error occurred while writing the output file: System.UnauthorizedAccessException: Access to the path is denied.
1> CSC : error CS0016: Could not write to output file ‘D:\Project1\obj\Debug\Project1.dll’ — ‘Access to the path is denied.’
I tried the following:
* gave all necessary permission and made sure no file is locked.
* different projects including Asp.net Forms, Asp.net Core, WPF, Winforms
* deleted obj folder
* cleaned solution
* restarted VS
* restarted the PC
* deleted .vs folder
* deleted project.user file.
* run VS as Administrator
* performed a VS repair from the installer.
Win10 64 1909
VS 2019 16.6 updated from 16.5.5
Hi Amro, I’m sorry you have run into this problem. Could you please launch the Resource Monitor app, go to the CPU tab, and search for “Project1” in the Associated Handles textbox? Which processes are listed there?
Please reach out to me so we can investigate this problem further: sawesong at microsoft dot com
Thanks for your reply,
I even uninstalled Visual studio and re-installed a fresh downloaded copy, but unfortunately same problem.
The only running processes:
devenv.exe for .vs\project1\config
devenv.exe for project1’s root folder
Ok, I found the problem, Fortunately It’s not related to 16.6 at all.
Windows Security is to blame.
recently I added the Projects folder to the Ransomware protection Controlled folder access.
But I also added devenv.exe and MSBuild.exe to the allowed Apps, but somehow there’s a bug there.
As soon as I remove the folder from the Controlled folder access, the build runs fine.
Glad you found the root cause of that behavior. Thank you for sharing your resolution.
Why we don’t have just one name/’version’ Visual Studio like Visual Studio Code instead having VS2019?
I think it is because Microsoft offers other VS editions like Professional and Enterprise that are bought by companies for their developers and they need a stable product name and SKU, as well as support (that happens with previous versions such as VS 2015 and 2017).
However, I think the Community edition can be offered without the year suffix and become a unique product with regular updates as VS Code does. We will see!
1- The installer failed, and needed to reinstall Visual Studio in two machines (luckily I’m using the offline installer).
Very disappointed.
2- I was very excited for Windows Forms Designer for .NET Core, but after creating a new project, there is no Button and CheckBox controls in the ToolBox.
The issue was reported in one of the previews.
Very, very disappointed.
3- After clicking in the About Microsoft Visual Studio menu, VS stops responding, need to kill the process.
Very, very, very disappointed.
Waiting for 16.6.1…
I was under the impression that the new Git window and menu, introduced in Preview 2, would make it to the GA. What is the expected time line for that?
Hi Tsahi – that was the original plan, but there was a lot to build so we made the call that the feature set was not GA ready for 16.6. We’re working on adding functionality and polishing some rough edges to make it a more complete experience. And the updated plan is to release as a feature flag toggle in 16.7 GA.
What do you mean by “revamped Git tooling”?
That’s a blog post bug, we’ll remove that bullet. Thanks for calling it out!
IMHO you should pull this release 16.6.0 from your servers and put 16.5.5 back until you’ve fixed the howlers in it.
– Loads of people are being affected by the installer bugs (Testing on a system that has another VS IDE on it, is hardly an unusual case, why wasnt it tested).
– Several of the features blogged about don’t even work at all.
How much testing did it get?
Given how buggy VS 2019 16.6.0 is – with MASSES of us suffering from broken installs and upgrades and broken features (e.g. Intellisense Code Linter not working), bugs with freezes, high CPU usage and linker and compiler breakage. Why haven’t you pulled the release and restored 16.5.5 to the servers?
People will be downloading this release and breaking their VS 2019 systems. You’ve acknowledged and triaged the bug, either release a fix urgently or pull 16.6.0.
Angry!
Edit and continue, one of the most productive features in Visual Studio, broke in 16.6. Was hoping it was fixed in 16.7 preview. Nope.
Great work, although now I have a problem, until blazor preview4 and visual studio preview the debug worked on the client side, but I updated from preview version 16.6 to preview 16.7 and the debug stopped working. and I updated vs16.5 to vs16.6 and it didn’t work either.
I create a new blazor project, the nuget version is 3.2.0, put a breakpoint on the currentCount ++ line; but it does not work
I will say this again. I’m subscribed to the community reports for the broken installer. Several times a day I am getting more messages from poor users who can’t get this update to install without it trashing the existing VS 2019 install with the issues with the WMI Provider.
My suspicision therefore is that many (if not most) people installing this 16.6.0 release are running into problems.
– Why haven’t you pulled this release and rolled back to 16.5.5 on the servers?
– Why haven’t you warned in bold text on the release notes of the fact that the installer is BUGGY and may trash the system?
This has been going on for over a week – and evidently more and more people are being bitten by it?
Using VS2019 Version 16.6 to create Arduino sketches (.INO files), line numbers reported in error messages are off a LOT – by almost 200 lines. For instance, this error message:
points to line 338 character 16, but the actual line containing the unused variable is line 139 character 16
This was also happening with Version 16.5 at least. not sure how many previous versions contain the error, but for the last couple of months anyway.
Frank