

With Visual Studio 2022, we have converted the CPU Usage tool in the Performance Profiler to the profiler’s new analysis engine. This new change provides the tool with better source resolution, incremental/cancelable symbol loading, a performance boost, and a new flame graph.
Note: This is only available in the Performance Profiler (Alt+F2) version of the tool, but we are still working on supporting it in the Diagnostic Tools. Give it a shot and see what insights you can find!
Flame Graph
We have finally shipped our most requested feature, a flame graph, to visualize a call tree. This new view is in the CPU tool details tool window, above the source line highlighting view. Using the graph, you can get a visual overview of where time is being spent in your application and click on specific nodes to dig into them further. Stay tuned for a follow-up blog where I walk through a recent investigation I did with the tool to double the performance.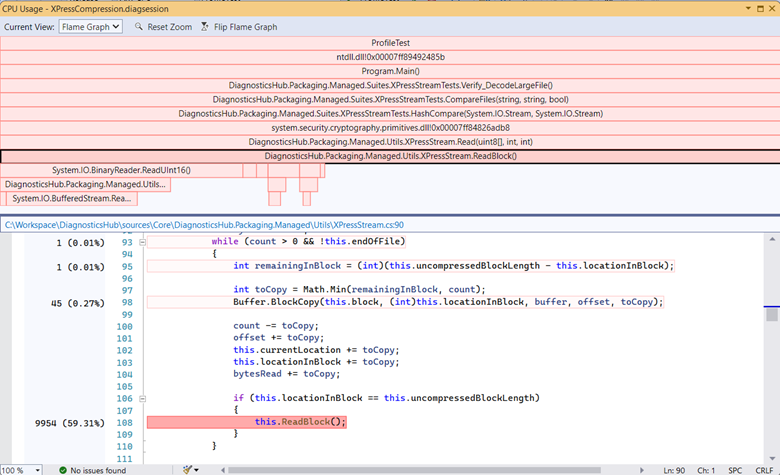
Show me the perf!
We have gotten a substantial perf boost with the new analysis engine. The CPU Usage tool’s big analysis task is building up its call tree model, which provides data to various views such as the flame graph, caller callee, and call tree. Building the call tree involves walking through all the stack data and building a tree from it, which can be affected by various settings like “Show external code,” “Symbol loading,” and “Show native code.” While not comprehensive, the table below shows the performance improvements in the default scenario of a .NET application with external and native code hidden.
| ASP.NET Scenarios App | Visual Studio 2019 Update 11 | Visual Studio 2022 Update 2 |
| Small trace (10K samples) | 5.99s | 8.64s (1.4x slower) |
| Medium trace (280K samples) – Video below | 464.87s | 39.57s (11x faster) |
| Large trace (725K samples) | 1234.81s | 159.02s (7x faster) |
For large traces the performance improvement is considerably faster! Don’t worry, we still have more ideas on how to make it even better and make up our losses on the smaller traces.
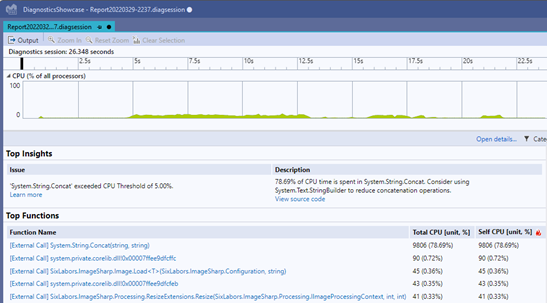
Auto Insights
Lastly, with Visual Studio 2022 Update 2, we are rolling out a new “Auto Insights” feature that helps find common issues in a trace and gives a starting point for your investigation. Currently, there are only a few rules such as overzealous string concatenation, but we are working with the .NET team to add more rules and tips for how to resolve issues.
Come talk with us
If you want to speak with our engineering team on how we can improve this tool, please let us know in our survey.
can we expect something like region-based memory management for C#? my preference is something in which a class (likely to allocate several KB) can specify that all objects created within, including sub-class, allocate from a dedicated set of pages, so that cleanup is easy? Possibly allocate a VAS of certain size, that can be reused by the next instance of that class?
Are these improvements also available when profiling (unmanaged) C++ code? Thanks.
Yep, improvements apply to C++ as well.
What was the most signficant source of the 11x perf improvement? Was it symbol transcoding speed when .NET native image pdbs were tried to convert to the symcache format? I have seem in WPA transcoding times of large .NET native image pdbs of up to 20 minutes.
Honestly the biggest source of improvement was doing less work. Our older analysis was done in C++ and built up an in-memory model of all the profiling results. This was great once the model was built but was expensive to construct and we were constantly finding places where smaller data structures and strings were being copied instead of references leading to slow perf. Our new C# analysis instead builds a much smaller model (processes, modules, threads) and relies on iterating over the events in the file when needed. We use value types and passing by ref in a couple of...
Would it be possible to add the ability to configure the location of the temporary files and ETL session that this uses? I’d like to redirect it to a ram drive instead of writing dozens of GB to the SSD over the course of trying to narrow things down session after session etc.
Yes, you can redirect our scratch directory by modifying the setting under “Diagnostic Tools window -> Select Tools -> Settings -> Scratch Directory”. Note, most Ramdisks will not work and I wouldn’t recommend doing this. We collect data from an elevated collector service, but then pass the data back to VS which requires us to secure where we are collecting data to. Most Ramdisk implementations do not provide the needed functionality to secure our scratch directory and will result in errors when we try to do so.