

In Visual Studio 17.8 Preview 2 we have updated unit test profiling, allowing you to use any of the available tools in the performance profiler – not just the instrumentation tool. With this change, it’s easy to quickly profile small units of work in isolation, make changes, and then remeasure and validate the impact of the change. Assuming you have good test coverage, this is a great way to leverage existing assets to help performance-tune your application.
Who moved my cheese?
With this new release, we have updated the unit test profiling experience. Previously when selecting profile in the context menu for a unit test, it ran under the Instrumentation tool, and you got the report at the end of the run.
Now when you select a profile, the Performance Profiler launch page will appear, and you can choose any of the available tools.
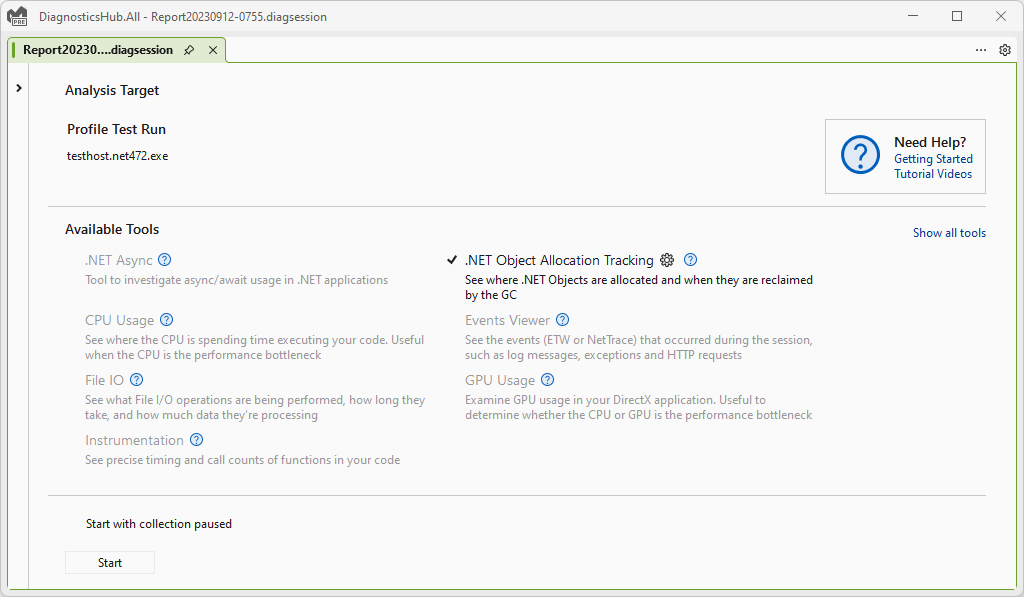
This lets you do things like profiling a unit test with the .NET Object Allocation tool to see all the allocations and where they come from. This is a great way to trim down unnecessary allocations and then validate your changes.
Let’s reduce some allocations!
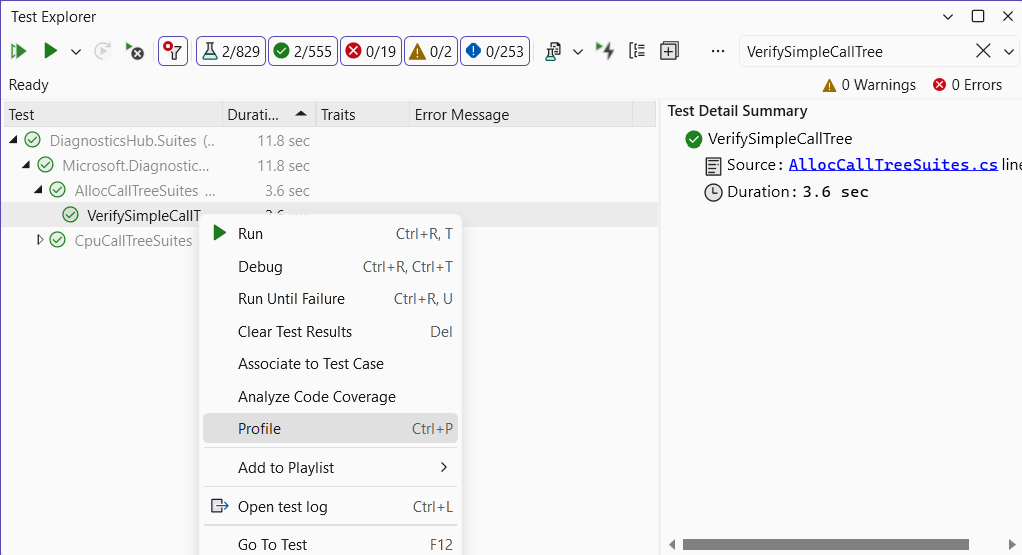
Now that we can use any of the tools, let’s take 5 minutes and see if we can trim some allocations from the performance profiler. To start, I have a unit test called “VerifySimpleCallTree” that we use with to verify our profiler correctly builds a calltree. From the test explorer I right click the test and select “Profile”, get presented with the Performance Profiler, select the .NET Object Allocation tool, and hit “Start”. From here my test runs and once complete I get the normal allocation report which I can use to dig into allocations and see what I can trim to ease the burden on the GC.
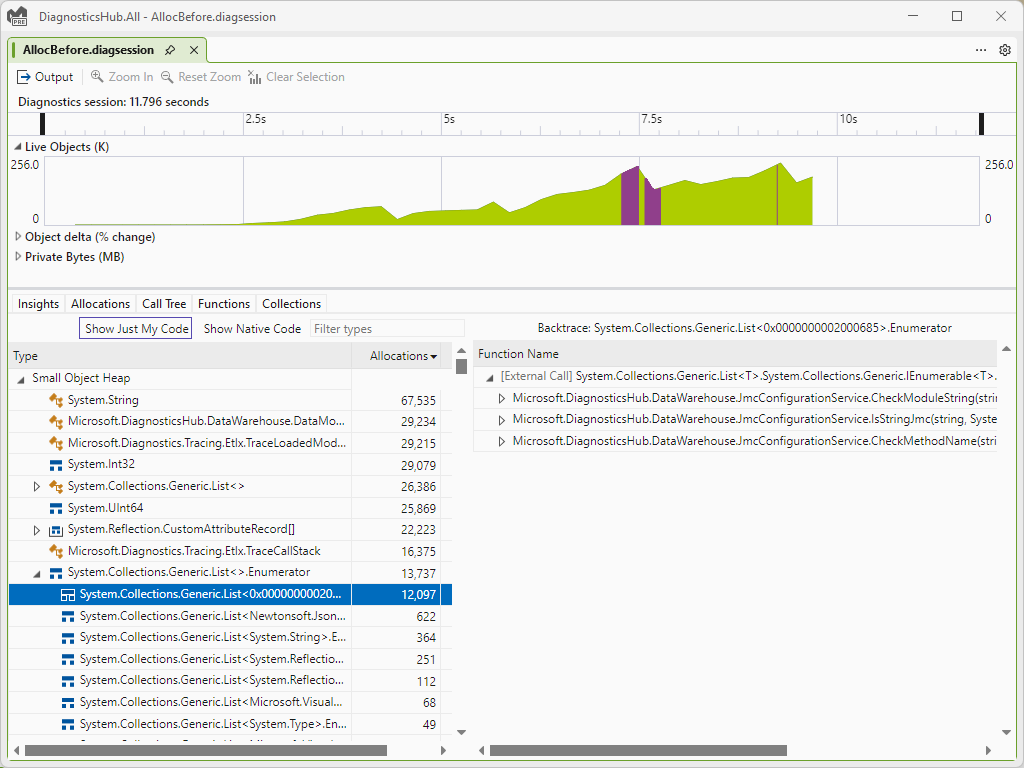 As I poke through the types, I notice a bunch of Enumerators being allocated. While this is not immediately wrong, it does seem odd. With the backtraces I can see this is coming from our JmcConfigurationService, and looking at the code sure enough an enumerator is being created from an Any() extension method.
this.patternsLock.EnterReadLock();
try
{
    if (this.unknownModulePatterns.Any(t => t.IsMatch(moduleString)))
    {
        return JmcState.UnknownCode;
    }
    else if (this.systemModulePatterns.Any(t => t.IsMatch(moduleString)))
    {
        return JmcState.SystemCode;
    }
    else
    {
        return IsStringJmc(moduleString, this.excModulePatterns, this.incModulePatterns) ? JmcState.UserCode : JmcState.LibraryCode;
    }
}
finally
{
    this.patternsLock.ExitReadLock();
}
With a quick rewrite using a static local function, we can remove the enumerator and reduce the allocations.
this.patternsLock.EnterReadLock();
try
{
    if (CheckMatch(this.unknownModulePatterns, moduleString))
    {
        return JmcState.UnknownCode;
    }
    else if (CheckMatch(this.systemModulePatterns, moduleString))
    {
        return JmcState.SystemCode;
    }
    else
    {
        return IsStringJmc(moduleString, this.excModulePatterns, this.incModulePatterns) ? JmcState.UserCode : JmcState.LibraryCode;
    }
}
finally
{
    this.patternsLock.ExitReadLock();
}

static bool CheckMatch(List patterns, string moduleStr)
{
    foreach (var pattern in patterns)
    {
        if (pattern.IsMatch(moduleStr))
        {
            return true;
        }
    }

    return false;
}
Rerunning the profiler on the unit test I can then validate that yes; I have in fact removed these unneeded allocations and helped reduce the burden on the GC.
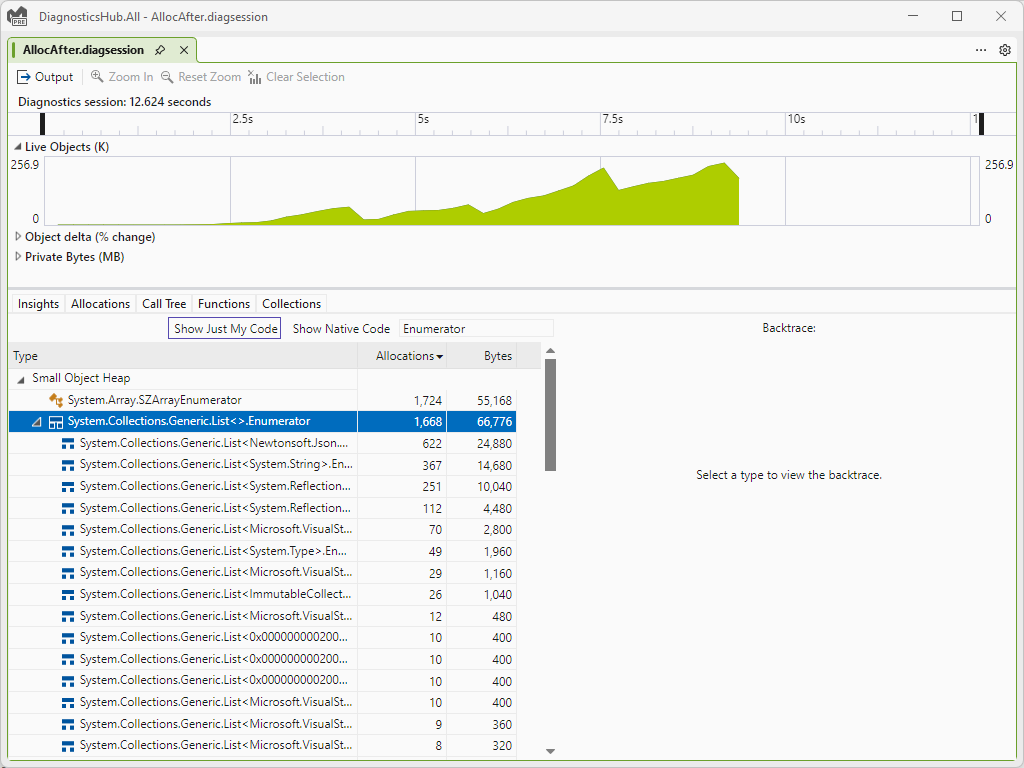
While this small tweak isn’t going to make my app magically 20% faster, slowly reducing unneeded allocations over time is a great way to gradually improve your apps performance. With the new unit test profiling this is easy to do with your existing test assets and then verify the change had the desired impact.
Let us know what you think!
The ability to use unit tests for isolated performance analysis is awesome. By isolating specific regions of code, it’s easy to get a good before and after trace to compare and see the impact of your performance optimizations. We eagerly welcome any bright ideas, thoughts, or valuable insights, we’re all ears! Don’t hold back—share them with us at this link.
Hi Nik,
Thanks for this excellent article. I have done a talk at NDC Oslo this year about closures, LINQ to collection-based optimizations and more that you might find enjoyable.
https://www.youtube.com/watch?v=pGgsFW7kDKI&t=150s
Regards,
Daniel
Not available in `Professional` flavor, pass for 95% of your reach.
I was confused because I couldn’t find the feature in my VS2022, even after the update. I don’t understand, is this feature only in Enterprise version? Or is it in the Community only but not the Professional/Enterprise editions? Why?
I agree, seems a reasonable expectation that this sort of function should be the Professional version
Is it possible to use this feature in CI pipeline with an intent to observe allocation behaviour over a period of time? So as to observe how performance improvement progress was made historically.
Not currently, though this is something we are trying to figure out. The challenge is that allocations are not always consistent due to the way things can be tier JITed or changes in the runtime. We are working on figuring out how we might put such a system together that isn’t noisy and helps protect all the perf gains you get.
this comment has been deleted.
You should immediately convert that foreach into a for loop. You should copy those
variables into a new array beforehand (if you’re not using arrays).
According to this SharpListGist the traditional for loop vs a foreach JITs the same. Definitely worth checking though :)