Introduction to Debugging
Whenever those of us in Visual Studio give talks or write blog posts about debugging, we typically focus on tips and tricks and new features that take for granted you already know the basics of debugging. The problem with this is like most things in life debugging is a skill you have to learn before you can take advantage of tips and tricks. To this point I recently sat down with Seth Juarez from Channel 9 for a talk introducing the basics of debugging in Visual Studio. For those of you who prefer the printed word, in this post I’ll cover the concepts I hit on in the video. For the purposes of the video and this post I’m using a C# application, although with the exception of Edit and Continue everything applies to any language you can debug with Visual Studio.
Start Debugging and Continue Execution
To start debugging you can click the “Start” button on the toolbar, go to the Debug menu and select “Start Debugging”, or use the F5 shortcut key.
 Once you are debugging this becomes a “Continue” command, meaning if you are at a break state in the debugger (either at a breakpoint or have been stepping through code) this will tell the application to resume normal execution.
Breakpoints
A breakpoint is a debugging concept that tells the debugger to break (pause) the application’s execution at a specific line of source code before it is executed. This is useful when you need your application to run to a specific area of code and then use the debugger to drill into what is going on. To set a breakpoint on a line of code click in the left margin in the text editor for the line of code you want the breakpoint on or place the cursor on that line and Press the F9 key.
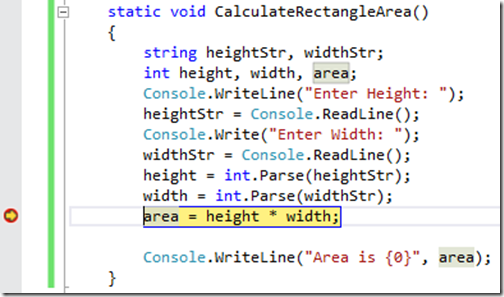
You will then see a red circle appear that indicates the breakpoint has been set on that line. When you hit the breakpoint it will highlight the line and there will be an arrow in the breakpoint column referred to as the “instruction pointer” that tells you this is the next instruction that is about to execute.
Breakpoints can be configured to provide additional conditions and actions beyond just stopping execution every time they are hit. You can configure them to stop when only specific conditions are met or print information and continue execution. For more information read this blog post dedicated to conditional breakpoints, or watch this short demo about using Breakpoint Settings.
Once you hit a breakpoint, you will likely want to use variable inspection and stepping to investigate further, and we’ll cover these features next.
Variable Inspection
When you are stopped in the debugger you will frequently want to inspect the values of variables in your application. The debugger provides several ways to do this including:
- DataTips: When you hover over the variable in the editor while paused in the debugger a DataTip will show you the value of the variable

- Locals Window: Shows you all variables defined in the current function you are debugging. The window does not show the values of global or class member variables used in the current function
- Watch Window: Enables you to type the name of any variable or property you are need to inspect
- Autos Window: Shows the values of variables used within a few lines of code (before and after) where you are currently stopped as indicated by the instruction pointer. The Autos window does not work for all languages (e.g. Autos are not shown when debugging JavaScript)
- Immediate Window: is a console style window that prints the values of any variable you type into the window.

The Watch and Immediate windows support entering complex expressions. Meaning you can do more than inspect just variables in your application you can type things like shapeName == “Circle” or 1 + 2 and see the result of the expression in the window.
Stepping, Set Next Statement, and the Call Stack Window
Once you have stopped in the right area of code, you will often want to advance execution of your application line by line. Instead of setting a breakpoint on every line the debugger offers the ability to step through code:
- Step Over (F10): Advances the instruction pointer to the next statement in the current method. If you step over a function call the function will execute and you not stop until the function returns to the current method.
- Step Into (F11): If you are on a function call the debugger will move execution into the first line of that function. If you are on a simple line of code (e.g. int c = a + b) Step Into will behave like a Step Over
- Step Out (Shift + F11): Completes execution of the current method and stops the debugger in the parent function
Set Next Statement is a handy feature that enables you to move the instruction pointer to start executing from a new location than it currently is. For example if you want to execute a line of code again, you can move the instruction pointer back with Set Next Statement and resume execution.
Finally when you are in a method you can see the execution path that resulted in how your application reached the current location using the Call Stack window.
Edit and Continue
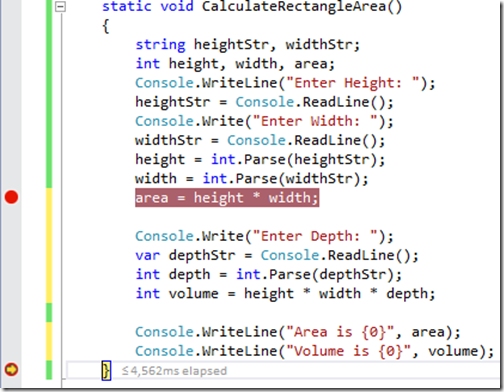
Once you find a location in your code you’d like to modify, it can be time consuming to stop debugging, make the edit, and then run the application again to make sure your edit had the desired effect. To help with this, Edit and Continue is a feature that allows you to edit code while debugging. Edit and Continue is currently supported for C#, Visual Basic, and C++. For example in the following CalculateRectangleArea() function:
I can add logic to also calculate the volume without the need to stop debugging and the edits will correctly be applied to the program when I resume execution
Learn More
The features I covered above where a quick introduction to basic debugging concepts that will set a great foundation for you to get started with the Visual Studio debugger. To learn more I recommend reading the Debugging Tips and Tricks blog post (and watching one of the linked videos), and reading the Debugging in Visual Studio documentation in MSDN. Additionally you can follow the diagnostics team including the debugger on our team blog.
If you have any questions or comments please let me know by leaving a comment below, through Visual Studio’s Send a Smile feature, or via Twitter.
 |
Andrew Hall, Program Manager, Visual Studio Diagnostics @AndrewBrianHall Andrew has been at Microsoft for 7 years, all spent working on diagnostic tools. In his time on the team he has worked on the debugger, profiler, and code analysis tools. |


 Light
Light Dark
Dark
0 comments