
If you are focused on squeezing out the last bits of performance for your .NET service or application, you might choose to take advantage of JIT compiler optimizations. However, debugging optimized code can be a challenge. In this blog I’ll show you how the Disassembly Window, and the recent improvements in 16.7, can help you debug optimized code.
What happens when we optimize code?
When the JIT compiler optimizes code it may reorganize instructions, with the aim of producing faster and more efficient compiled code. After these changes debugger tools, like Visual Studio or WinDbg, may not always be able to immediately identify the source code that corresponds to a set of instructions.
Compiler optimization may also impact local variables by removing them or moving them to locations the debugger cannot analyze. Lines of code become inconsistent when the optimization merges code blocks. It might also be possible that function names change for frames on the call stack, if the optimizer merges two functions.
While debugging optimized code you might see a combination of the following:
- Breakpoints may not always bind to the matching sourcing location.
- Stepping may not always step to the correct location.
- Some variables may not be available for evaluation.
Given these changes, debugging optimized code can be tricky even when you have direct access to source code or even when you can take advantage of decompilation. Fear not, Visual Studio has a Disassembly Window that gives you the ability to inspect every detail of every optimized instruction!
Viewing Disassembly code
The Disassembly window shows the assembly code that corresponds directly to the instructions created by the compiler. If you’re debugging managed code, then the assembly instructions relate to the native code created by the Just-in-Time (JIT) compiler.
To open the Disassembly window during live or dump debugging, select Windows > Disassembly (ctrl+k). With the Disassembly Window. When you are debugging managed code with Visual Studio the Disassembly window shows assembly code corresponding to the instructions created by the JIT compiler.
Finding the source of that Null Reference Exception
Unhandled Null Reference Exceptions are one of the most common causes of crashes in production applications that we see. They can occur unexpectedly in production for a variety of reason that include missing data or malformed configuration settings. When you successfully capture a crash dump, simply opening the dump in Visual Studio can navigate you to the faulting thread, call stack and even the line of code.
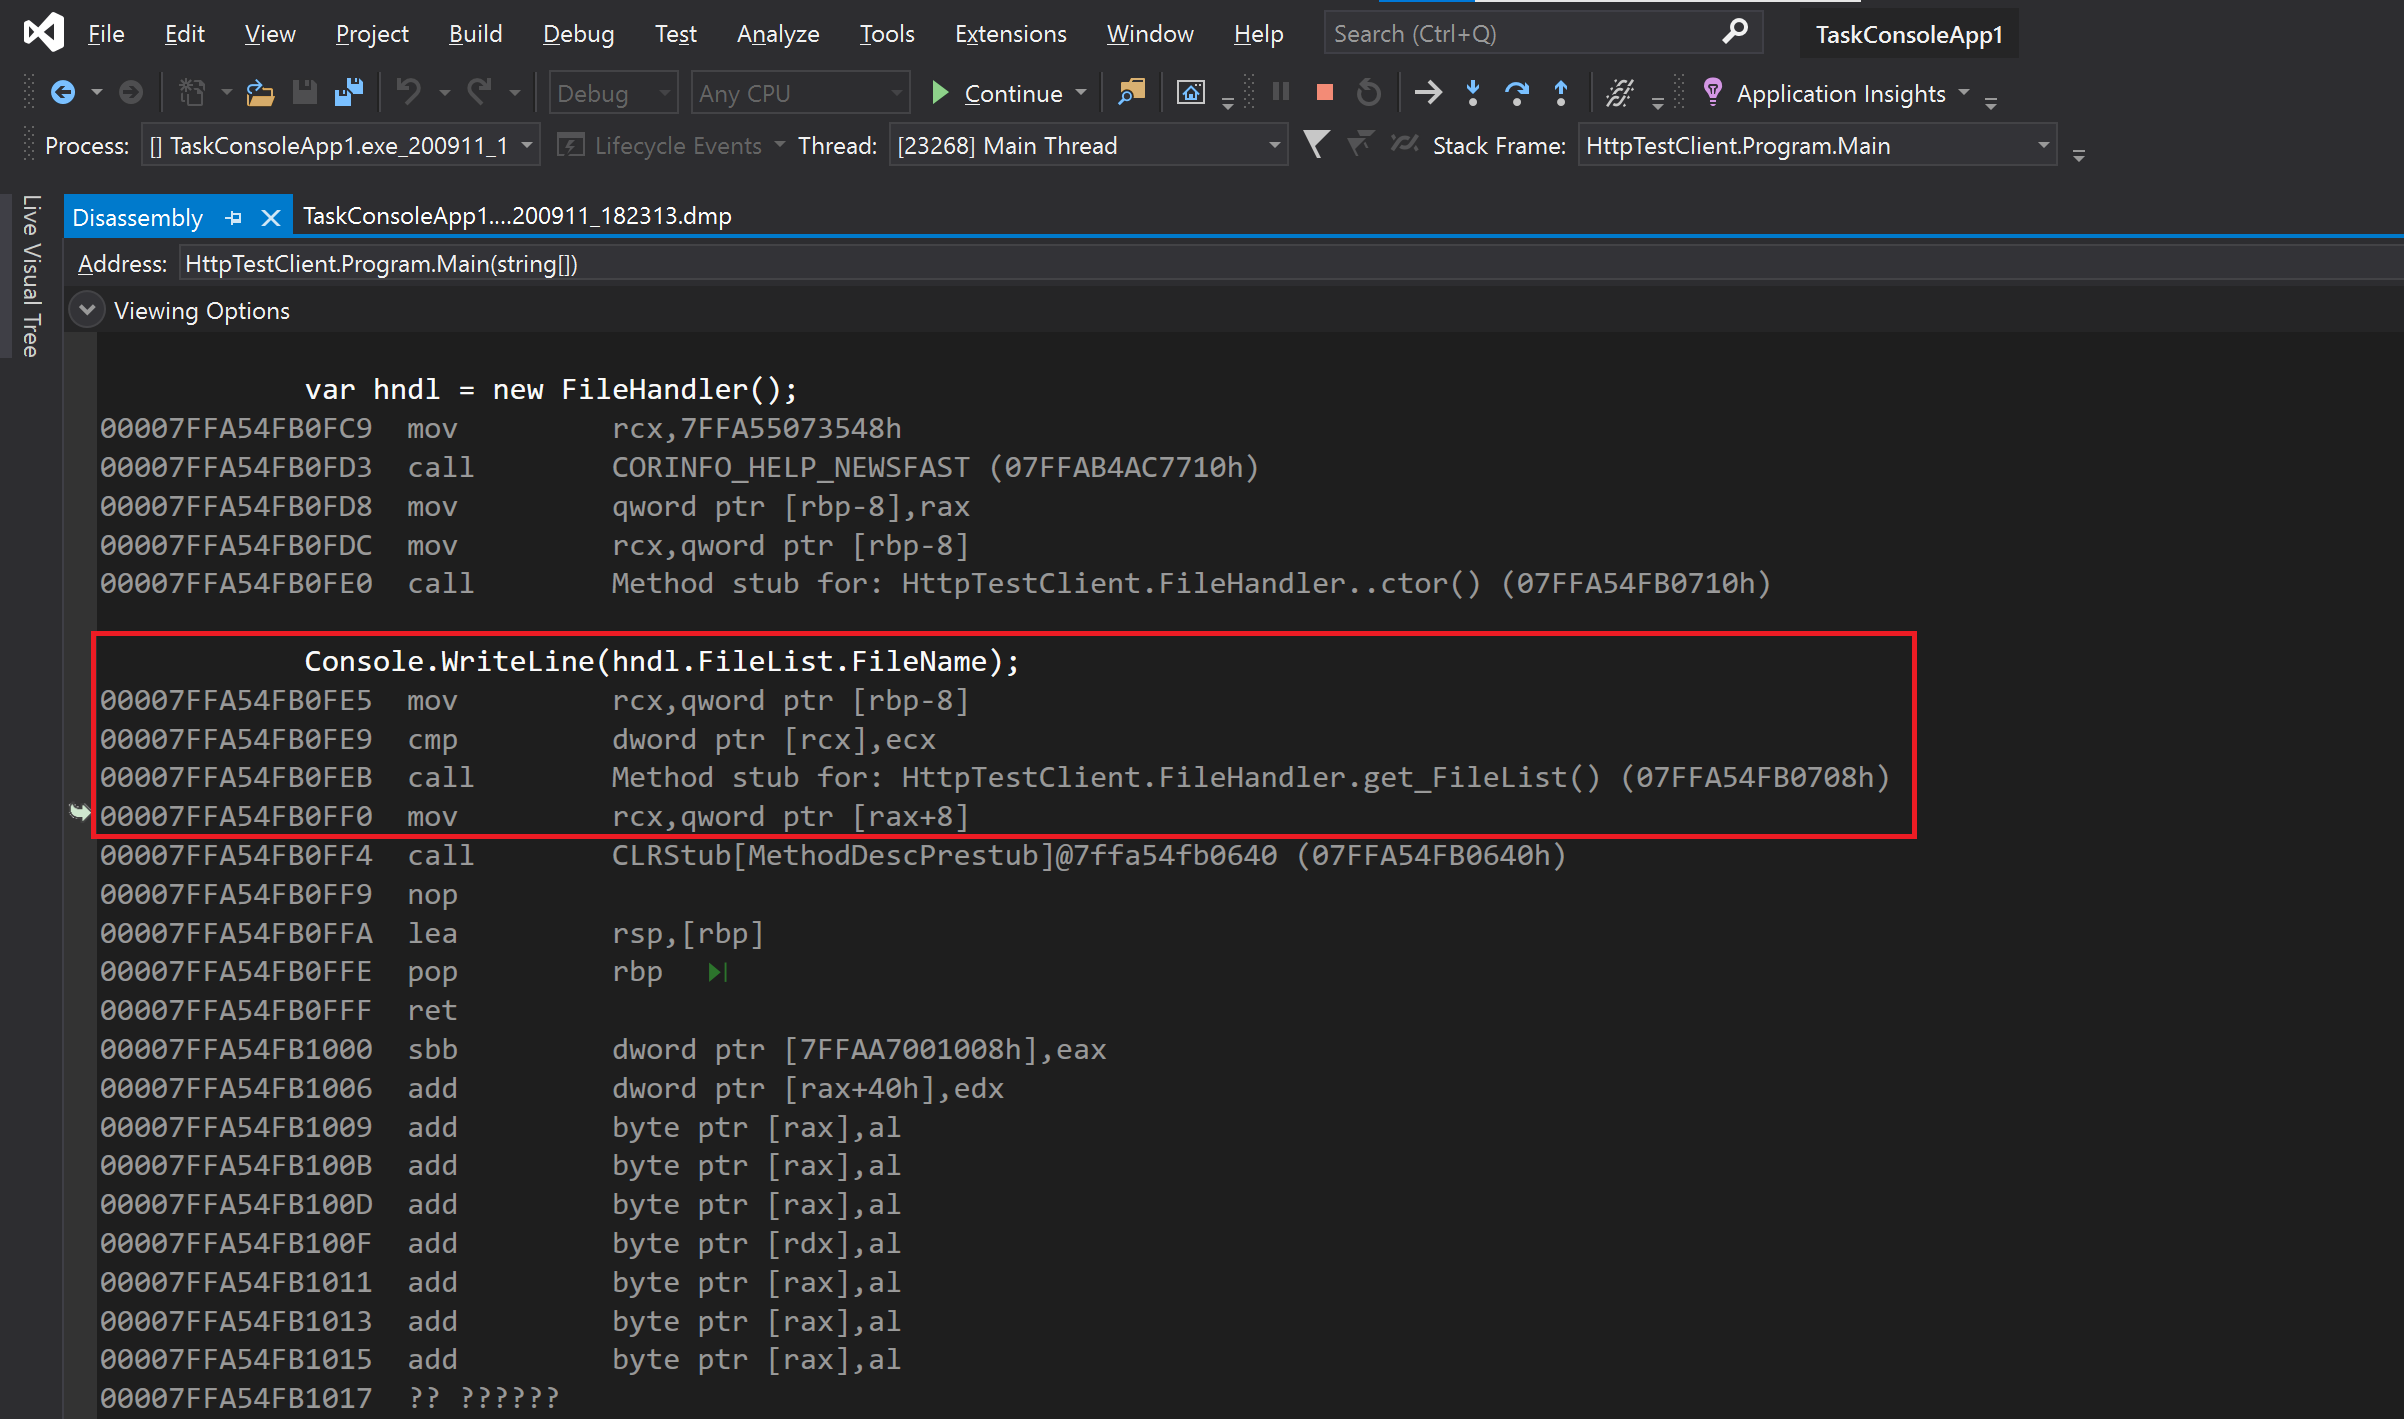
If, for example, you have a Null Reference Exception, and you wanted to try and figure out what object was at fault in an optimized dump (where local variables are usually unavailable) it could be very difficult, however, the Disassembly window gives us a much clearer indication of the offending objects.
In this example I use the improved managed Disassembly window with a crash dump I collected from a managed process. In this view I have overlaid the assembly code created by the compiler and the source code, and that helps me determine that ‘[rbp-8]’ is where object ‘hnd1‘ is defined, and that the property “FileHandler” is indeed the source of the observed crash due to an attempt to derefence null.
Diagnostics in Visual Studio for the win!
If you are debugging optimized processes or dumps it may be time for you to get familiar with the Disassembly Window. Even for an optimized managed process you can effectively dig into every detail of all available instruction and match those instructions to viable source code location.
Download the latest version Visual Studio and try this out!
We are always looking for ways to improve the diagnostics and debugging experiences whether in live or dump scenarios. Please head on over to the Developer Community to report an issue or suggest a new feature for Visual Studio. You can also reach out to me directly on Twitter (@poppastring).
In that picture you did not overlay the IL instructions and the source code.
You overlaid the x86 instructions and the source code.
Ah yes, my mistake. Corrected. Thanks Thomas!
Mark Downie