
When unexpected crashes occur in your managed application you are often left with little evidence of the issue; capturing and analyzing memory dumps may be your last best option. Thankfully Visual Studio is a great tool for analyzing your apps memory dumps! In this post we show you how easy it is to get important insights from a crash dump, and the steps to resolve the issue using Visual Studio.
What is a crash?
There are several different things that might be causing your managed application to crash, the most common are typically unhandled exceptions. These occurs where an exception is raised (First Chance Exception), but your code does not handle it (typically using a try-catch code construct). The exception goes up the stack and becomes, what we refer to as, a Second Chance Exception and crashes your app’s process.
Out of Memory Exceptions, Stack Overflow Exceptions and Execution Engine Exceptions also cause crashes. Stack Overflow Exceptions and Out of Memory Exceptions can occur when your app has insufficient memory space for any function to handle the exception, which again causes the process to crash.
Capturing a memory dump
Memory dumps are a great diagnostic tool because they are a complete snapshot of what a process is doing at the time the dump is captured. There are several tools available for capturing memory dumps including Visual Studio, ProcDump, DebugDiag and WinDbg. The relative strength of each tool depends on your environment and the scenario you are investigating (e.g. high CPU, memory leaks, first/second chance exceptions, etc.).
In the following example, I use the versatile ProcDump command-line utility from Sysinternals to capture a full user-mode dump (-ma) when an unhandled exception (-e) occurs (1145 is the process id of my application).
procdump.exe -ma -e 1145
Once the crash occurs ProcDump immediately writes the memory dump to disk (*.dmp).
Debugging crashes is made easier with the Visual Studio memory tools, so let me show you how I debug a Stack Overflow Exception in my application, and how the tools navigate me directly to the line of code that caused the problem.
Analyzing a crash dump with Visual Studio
I can open my memory dump directly in Visual Studio and will be presented with the Dump Summary page.
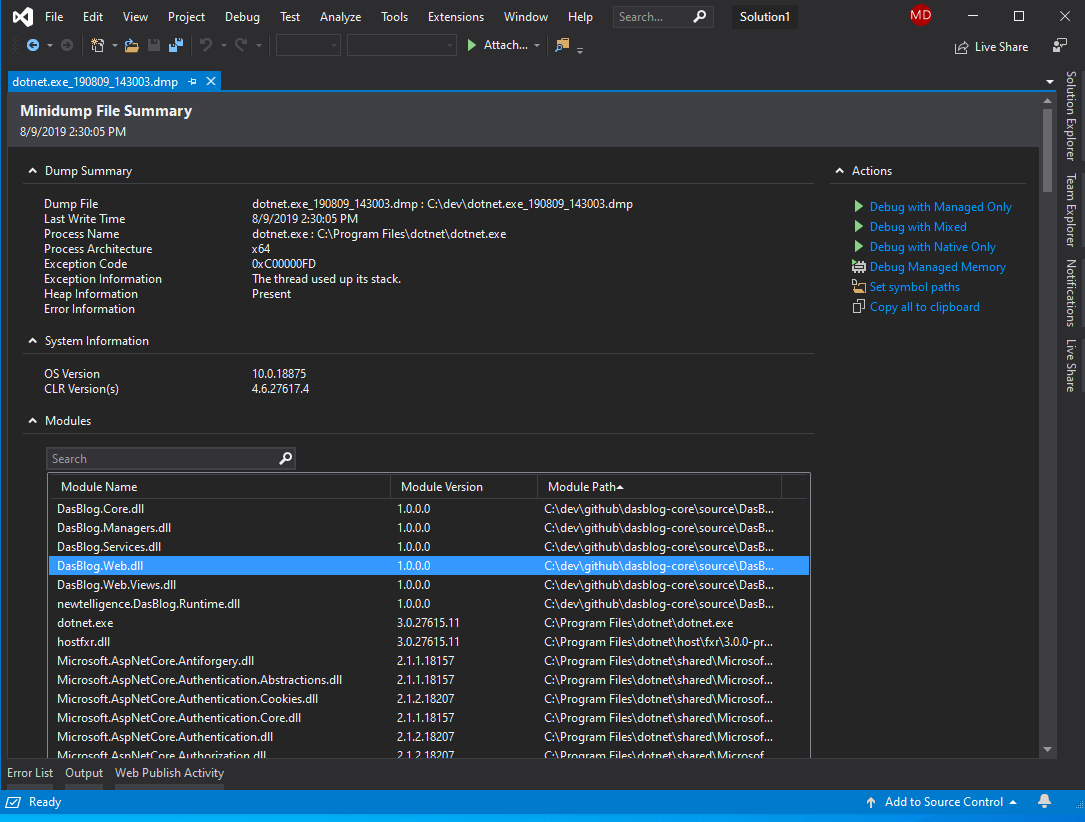
The Dump Summary page highlights several pieces of important information from the dump file including the OS Version and CLR Version. I can also search through a list of the modules that were loaded into memory at the time I captured the memory dump.
In this example the Exception Code and Exception Information state that the problem is “The thread used up its stack”. Simply put, we have a stack overflow exception. Knowing the problem is one half of the equation, but I also want to know the root cause of the issue, and this is where I think Visual Studio shines.
On the right side of the Dump Summary page, I can choose from several Actions, but as this is a managed application, I will select the Debug with Managed Only option and Visual Studio immediately drops me onto the thread and code line that caused the stack overflow exception!
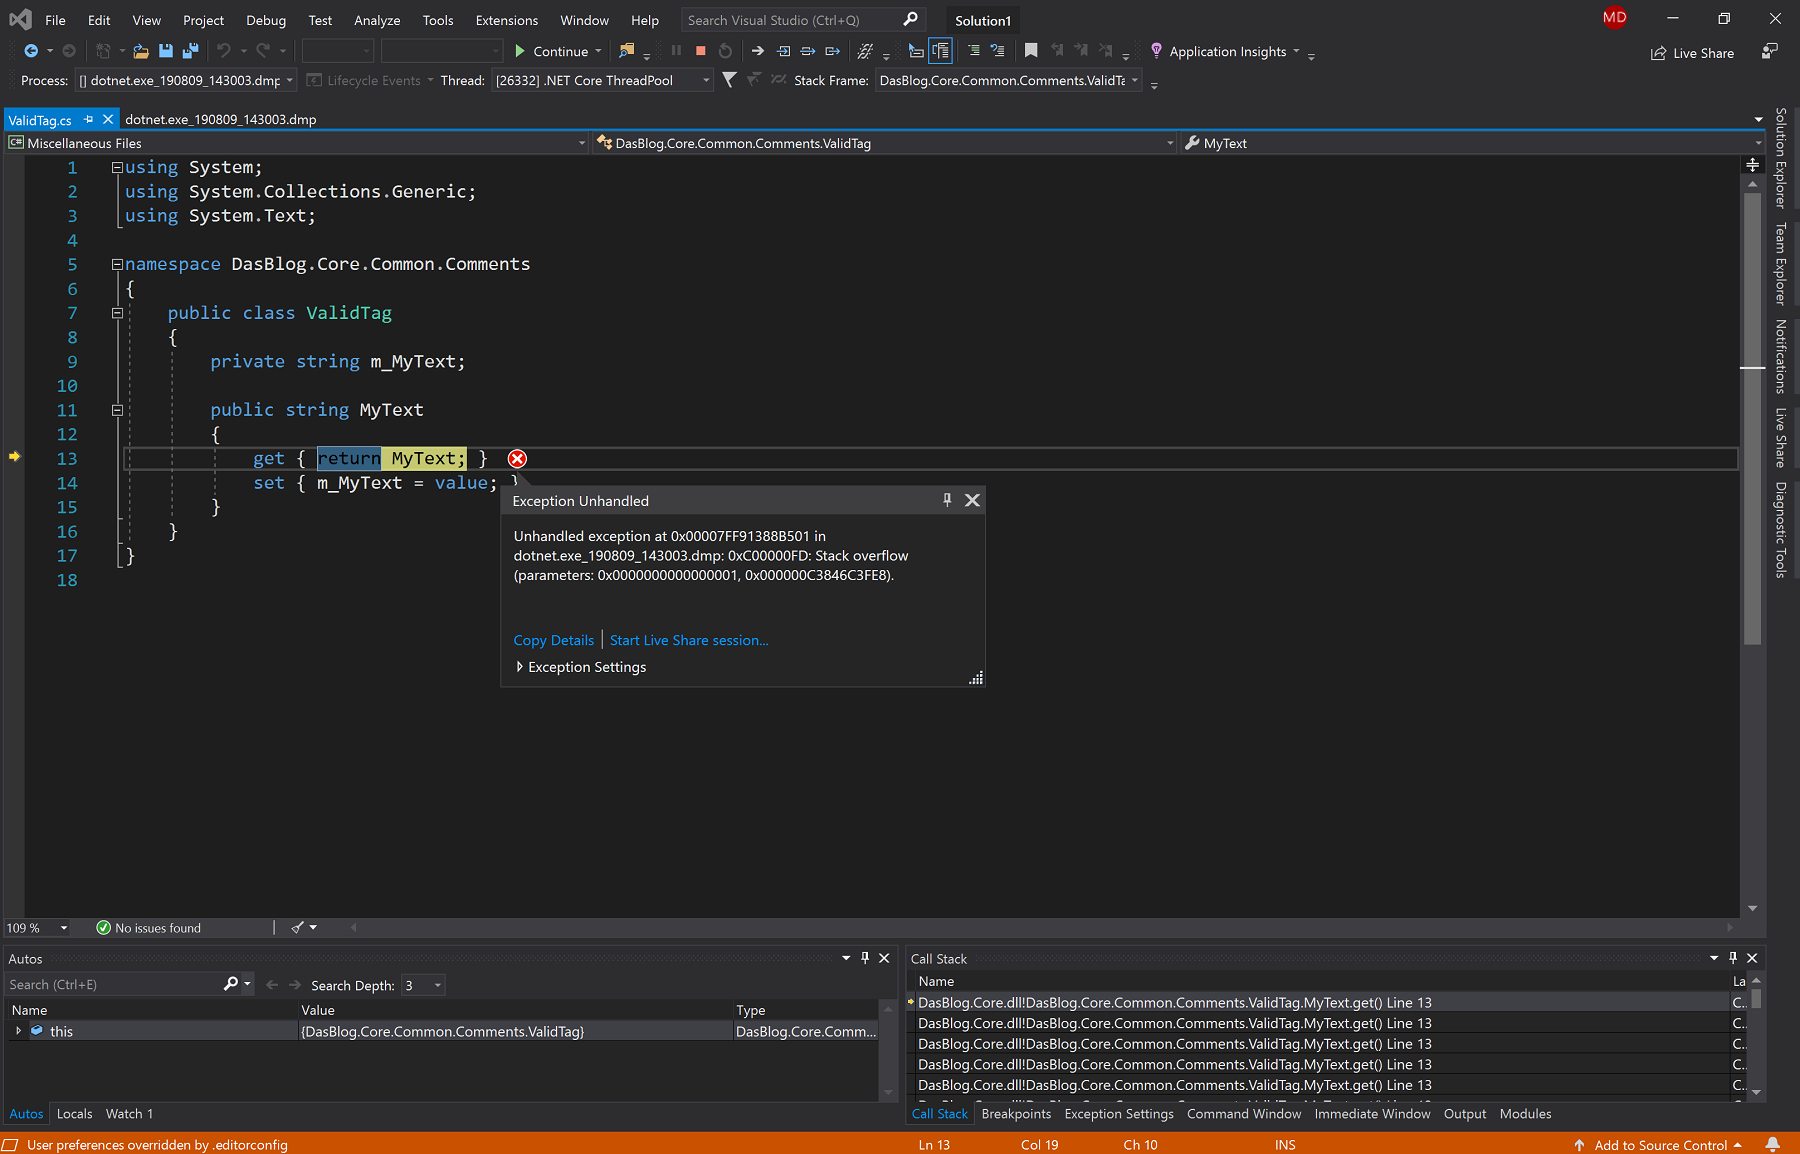
I now have a more complete view of the problem, it’s as if I had managed to set a break point at the exact moment of the stack overflow. This also presents me with the opportunity to review my Call Stack (which confirms the issue), review other threads, and even verify the state of any Local variables at that point in time.
In this instance Visual Studio is pointing me to a clear error on my definition of the get property. Instead of returning the private variable m_MyText I have mistakenly returned the public property MyText. This circular reference is the cause of the stack overflow exception.
Finding the root cause of the problem may not always be this clear, so you could also collaborate with a colleague directly from the exception by using Visual Studio Live Share. This gives you the ability to co-debug in real time without teammates needing to set up their environment.

Conclusion
Over the years Visual Studio has developed first class support for handling and debugging memory dumps. It allows you to consider the impact your code is having during the exact moment of a catastrophic failure. Having the ability to investigate a problem with the same tools used for developing code can help save time determining and providing a solution.
Please let us know what you’d like to see next by suggesting feature requests or reporting issues via Developer Community.
Great article! I did run into a small hurdle - simulated the same StackOverflow exception as in your example, but when trying to get the dump file using the command parameters specified in the article, got a "Dump count not reached" response from ProcDump. Per StackOverflow (someone else ran into a similar problem), I used these command line options:
procdump -ma -e 1 -g <ProcNameOrID>
I was using process name, by the way - not sure if that's relevant. The 1 after -e will catch first-chance exceptions as well, and -g option allows ProcDump to work as a native debugger with...
Does this only works for .NET code? And only when in debug mode?
Hi Mark,
Memory dump debugging with Visual Studio is available for .NET (managed) and unmanaged code.
It does not require any code “debug mode” for this to work. However, for the best experience you will need the Program database (.pdb) files, also called symbol files. These are created during the build process and serve as map identifiers and statements in your project’s source code to corresponding identifiers and instructions in compiled apps.
Thanks!
Helpful information Mark. This is what I was really looking for, at the moment. Can you please confirm, if this feature is available in VS2017 as well?
Hi Manish!
Yes! Memory dump debugging is available in Visual Studio 2017 also.
Thanks
Mark
I've tried the approach in the past specifically for debugging StackOverflowException, but Visual Studio was showing only a limited number of method calls in the call stack. In my case, there was a "bad" method causing the stack overflow at the bottom of the stack:- Method1()- Method1()- Method1()- ...- <one thousand calls of Method1 here>- ...- BadMethod()and Visual Studio UI was only showing only the first e.g. 200 calls. This forced me to use WinDbg to find the underlying method causing the problem.Is this limitation gone now, or do you plan to implement it?
Hi Borislav,
The call stack limitation in your scenarios is a really interesting point! Please submit a feature request with the details of your scenario over our developer community site.
Thanks
Mark