If you are a developer who is curating a successful .NET project using COM interop, then our latest preview of Visual Studio is for you (Download 16.7 Preview 3). This feature automatically decodes managed COM objects referenced by native pointers allowing you to fully inspect values in the Locals Window.
I am incredibly fortunate to have been using the Microsoft stack since the 90s! #getoffmylawn During that time there have been some truly transformational leaps in the technology that have helped developers like me provide solutions to customers across multiple industries.
A few years back I helped with the design and support of an incredibly successful online banking platform, however, the core design was developed in the late 90s and early 2000s which meant there was significant reliance on COM.
What is COM?
COM is a distributed, object-oriented standard for creating binary software components that can interact, it succeeded DDE (now that is going back 😊) and became the foundation technology for Microsoft’s OLE and ActiveX technologies.
COM permits objects to live within a single process or in other processes, and they can also be instantiated on remote servers (using DCOM – Distributed COM). We refer to COM as a binary standard as objects can be written in different languages. COM also defines how objects work together over a distributed environment and has security features that govern system and component integrity.
Debugging Heterogenous Systems in Visual Studio
When .NET was introduced in the early 2000s it was intended to supersede COM, however, my old dev team had already created a compelling set of services for a long list of satisfied customers.
Thankfully for us COM and .NET are complementary development technologies. The .NET Common Language Runtime provides bi-directional integration with COM. This meant that COM and .NET applications and components could take advantage of each other’s functionality. This protected our existing investments in COM while allowing us to take advantage of .NET at a deliberate and cost-effective cadence.
Even with this cooperation between technology stacks some of the debugging experiences in Visual Studio fell short especially for full variable inspection. This was especially true if you had a native code base that consumed COM objects implemented in managed code.
When a COM client calls a .NET object, the common language runtime creates the managed object and a COM callable wrapper (CCW) for the object. Unable to reference a .NET object directly, COM clients use the CCW as a proxy for the managed object.
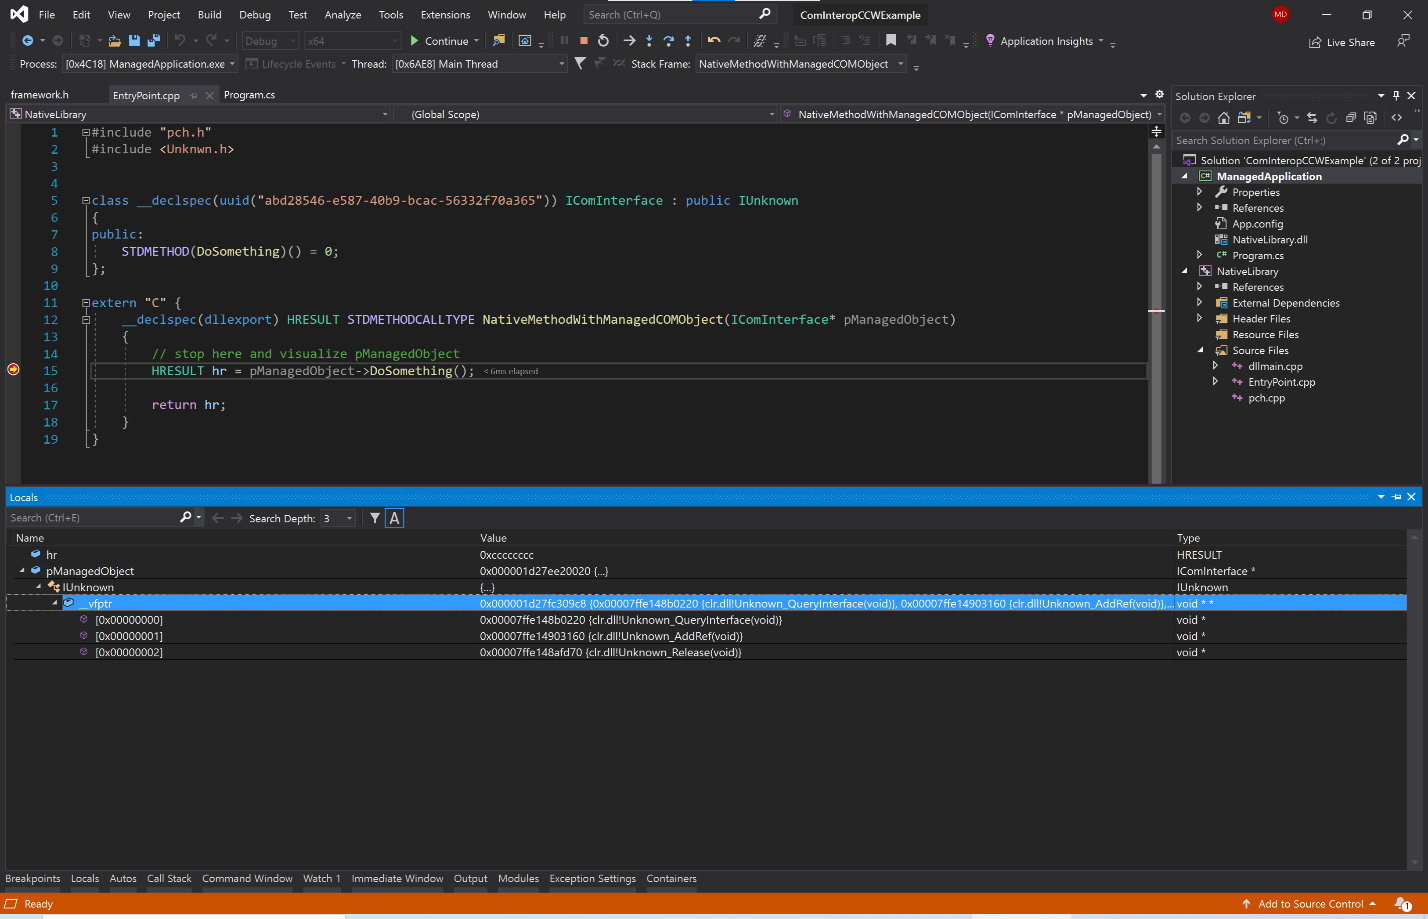
The original debugging experience in Visual Studio showed a COM interface pointer for the managed implementation object as a vtable with no discernable values (A vtable, virtual method table, is how COM binds a method call to its implementation at run time). The following image shows that I am missing name, value and type information in the Locals window.

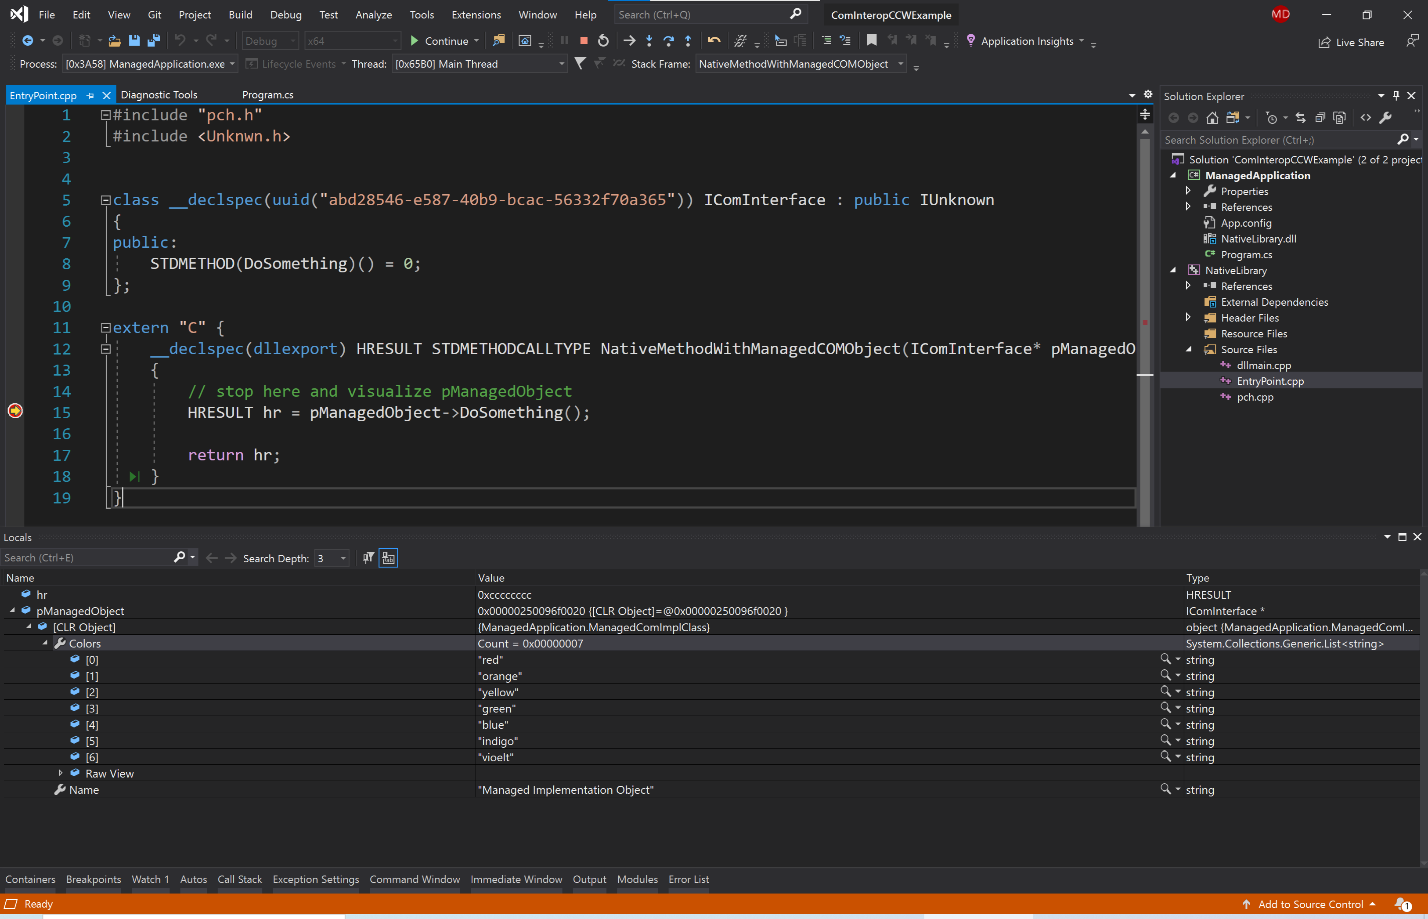
Now in the latest preview Visual Studio automatically translates the managed COM objects being referenced by native pointers allowing you to see the variable name, value and type.

The ability to decode managed COM objects referenced by native pointers is also available when debugging memory dumps in Visual Studio. This experience is similar to WinDbg when using the !DumpCCW command (as seen here in this Defrag Tools video on Channel 9).
To take advantage of this feature your app must run as a single Application Domain and use Mixed Mode Debugging (Native together with .NET Framework 4.X and/or .NET Core 3.X).
Tell us what you think!
Download Visual Studio 16.7 Preview 3 to start testing this out! Please raise issues and comments in Visual Studio with “Report a Problem” or directly at the Developer Community site. We’re interested in hearing your feedback!

Will this work with WinRT (Which is kind of COM) too?
Looks great! Will this be available the other way around, to inspect native COM objects from managed code?
Great question Andrew! This already exists, If a managed object has a COM interface reference that is backed by a native implementation (and you are mixed mode debugging) the expansion of the interface in the watch/locals window will show a “Native View” node, which can be expanded to inspect the native object.
If you have any issues please let us know with “Report a Problem” or directly at the Developer Community site.