

In Visual Studio 2022 17.6 and 17.7 we added a ton of new features in Parallel Stack Window that can take your multithreaded debugging to the next level.
But what can the Parallel Stack Window do for you? The answer is simple – it offers valuable insights into how your code functions in multithreaded or parallel or async environments. Understanding how your code behaves in a parallel environment is crucial as multithreaded programming becomes the norm. Luckily, the Parallel Stacks Window comes to the rescue by visually presenting the execution flow of multiple threads. And with the following productivity-boosting tips, you’ll effortlessly spot and tackle any issues that arise from parallel programming. So, let’s unlock the full potential of your debugging prowess!
All the features below are available in our latest Preview.
Launch Parallel Stacks from Call Stacks by clicking “View all threads.
While you might be familiar with launching the Parallel Stacks Window from the Debug > Windows menu, did you know there is a new way to access it directly from the Call Stack Window?
By using the “View all threads” button, you can effortlessly switch between these two windows and gain a better understanding of how your code executes in parallel. With just a single click, you can smoothly transition from examining the call stack to visualizing the flow of multiple threads, making your debugging process more insightful and efficient.
Enhance Your Analysis with Filtering options in Parallel Stacks
Have you ever found yourself in a situation where you’re troubleshooting intricate applications or code with multiple threads, and it quickly becomes messy with numerous threads and frames? It can be quite difficult to pinpoint the exact code paths or threads that are relevant to the problem you’re investigating.
But here’s something you might not be aware of the parallel stack window now offers a filtering option that lets you selectively display or hide specific threads or frames. This means you can easily concentrate on the frames and threads that are important to you, enabling you to gain better clarity and accomplish more in less time.
- In the Threads/Tasks view, navigate to the top menu of the Parallel Stacks window and select the “Filter” button.

- Choose the specific modules or method names you want to concentrate on by selecting them. You can even expand and individually select threads if needed.
- Once the filter is applied, all irrelevant stacks will be hidden, allowing you to focus solely on the selected ones.
- To restore the original/unfiltered view, click “Clear Filters” from the filter dropdown to remove the applied filters.
Unlock Clarity with the “Show External Code” toggle in Parallel Stacks!
When dealing with multithreaded applications, it’s common for threads to interact with different external libraries or frameworks. However, when debugging, you might want to concentrate on the specific stacks within your application instead of being overwhelmed by extensive external code. There might be instances where understanding the interaction between your application and external dependencies is crucial.
The ‘Show External Code’ toggle option in both the Parallel Stack and Call Stack windows proves extremely useful in this scenario. It allows you to selectively include or exclude external code from the stack trace, offering a more focused and efficient debugging experience.
- Click the “‘Show External Code'” button in the Parallel Stack / Call Stack toolbar.
- You will notice all external call stacks/frames in both windows will be hidden and collapsed into [External Code] annotated frames.
- To view the external code call stacks/frames again, click the “Show External Code” button once more.
Discover Insights with Parallel Stacks Search
You know that the Parallel Stack window already has a search feature to help you narrow down the stacks you want to focus on? But here’s a pro tip: you can further enhance your search experience by directly searching using the search filters with threadId, threadName, or taskId. This will make it even easier to find and analyze the specific threads or tasks you’re interested in. Happy searching!
- Please select the dropdown menu adjacent to the search box in the top menu of the Parallel Stack window.
- You have the option to choose either threadId, threadName, or taskId.
- Enter the desired threadId, threadName, or taskId in the search box and press “Enter.”
- The searched thread/task will be highlighted in the Parallel Stacks window.
The Copy Feature in Parallel Stacks
Did you know the Parallel Stack window offers multiple ways to copy content? You can copy specific thread information, frames, or even the entire stack trace with just a few clicks. You can share, report, or analyze the copied data outside the outside of the debugging environment.
Click and Copy
- Single-click on the node header to select all frames in the node or double-click on a node header to select the entire stack.
- Hold the “Shift” key and select multiple nodes of interest, if required.
- Alternatively, you can also select the nodes using the right-click context menu “Select frames above/below” (above is with Task View, below is with Threads View )
- Now you can copy the stack information as text or image by using the shortcut keys “Ctrl+C” for copy and “Ctrl+V” for paste.
Drag and copy
- Click and drag your mouse to select multiple nodes from the Parallel Stack Window.
- Now you can copy the stack information as text or image by using the shortcut keys “Ctrl+C” for copy and “Ctrl+V” for paste.
- To save all the contents from the parallel stack window as an image (.png), just use the Save button located at the top right of the window toolbar.
Detecting Deadlocks with Parallel Stack’s Indicators
Have you ever had scenarios when your multithreaded application is in a deadlock situation, and you don’t understand why you have deadlock and which threads are involved?
The deadlock indicators from parallel stack windows will be the real timesavers here. It highlights all the threads that involve the deadlock and gives the big picture to understand the situation.
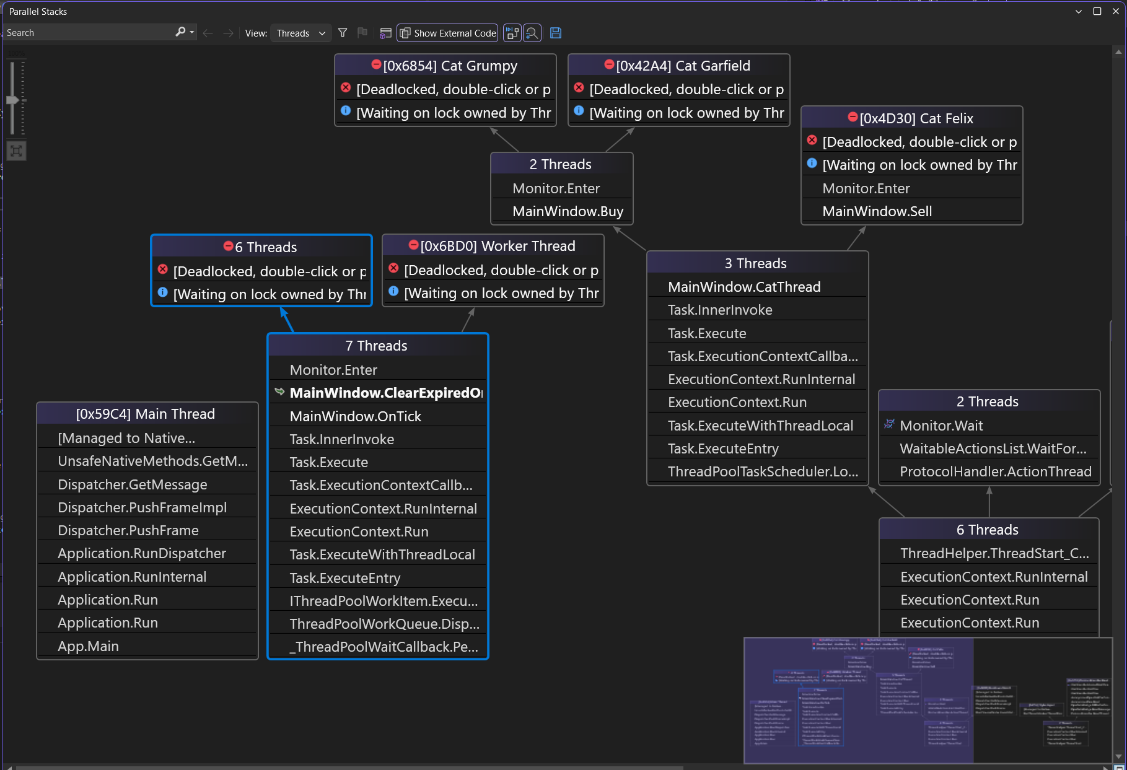
When the application is in deadlock look for priority indicator icons highlighting problematic threads such as deadlock ![]() and wait scenarios
and wait scenarios ![]() .
.
Unveiling Method Insights with the Method View!
Have you ever encountered a situation where parallel stacks contain a large number of frames, making it challenging to focus on the specific method relevant to your analysis? Well, the Parallel Stack’s Method view could be your savior here, this valuable but lesser-known feature reveals the caller-callee relationship, enabling you to unlock the window’s full potential.
Simply select the method toggle, and you’ll be presented with a condensed stack, tailored to your specific interest in the chosen method. To access this view, click on the small “Method View” ![]() toggle in the top menu of the Parallel Stack window.
toggle in the top menu of the Parallel Stack window.
Once selected, the Parallel Stacks will display the methods view. And to revert to the Tasks view, just click the Methods button once again.
Finally, check out these fantastic video tutorials from our team! They’ll walk you through, step-by-step, on how to harness the full potential of the Threads and Tasks views in the Parallel Stacks window of VS 2022.
So, the next time you find yourself debugging a parallel application in Visual Studio, remember to explore the hidden gems of the Parallel Stack Window. These tools will empower you to work more efficiently, identify and resolve issues faster, and ultimately become a debugging expert. Also, Please report any issues or feedback on Visual Studio via the Developer Community site.
Happy debugging!
Very nice indeed! Thanks
Super cool feature “Detecting Deadlocks with Parallel Stack’s Indicators” and let me give up windbg most part of time!
This is conceptually a superset of the existing stack view. Any thought to combining them?
If I understand correctly, you are mentioning the Call Stack window. Currently, we don’t have items on raodmap to combine these two features.