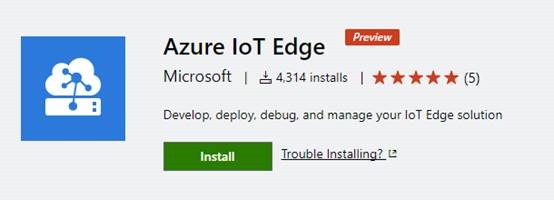
At the recent Connect(); 2017 in November, we announced public preview of Azure IoT Edge. Now you can bring the intelligence of the Cloud right to the IoT Edge as well as easily create and manage business logic for your devices. The new Azure IoT Edge extension for Visual Studio Code along with the updated Azure IoT Toolkit extension will make your IoT Edge developments a real pleasure, providing a set of functionalities including:
- Creating new IoT Edge projects
- Building and publishing IoT Edge modules
- Debugging IoT Edge modules locally
- Managing IoT Edge devices in IoT Hub
- Deploying IoT solutions to IoT Edge devices
- Stopping and restarting IoT Edge
Get Started with IoT Edge in Visual Studio Code
First things first, let’s start by answering the obvious question – What is IoT Edge? What can it do and how does it work? Azure IoT Edge moves cloud analytics and custom business logic to devices so that your organization can focus on business insights instead of data management. Enable your solution to truly scale by configuring your IoT software, deploying it to devices via standard containers, and monitoring it all from the cloud. Here is the Azure IoT Edge introduction page where you can find more in details.
Create a simulated Edge Device
Azure IoT Edge enables you to perform analytics and data processing on your devices, instead of having to push all the data to the cloud. To achieve this, you need a device having IoT Edge runtime installed to start with. Here are the tutorials about deploying Azure IoT Edge on a simulated device from end to end for both Windows and Linux operating environments.
Develop and deploy a C# IoT Edge module
Once you have the IoT Edge runtime deployed on your device (or simulator), you can then start working on modules. At the time we are writing this post, only C# is available for developing modules, but soon you will be able to develop them using C, Java, Node or Python as well. We have published a page talking about develop and deploy a C# IoT Edge module to your simulated device using Visual Studio Code, check it out first, then we’ll show you how to debug it in VS Code with the IoT Edge extension.
Debug your IoT Edge C# module
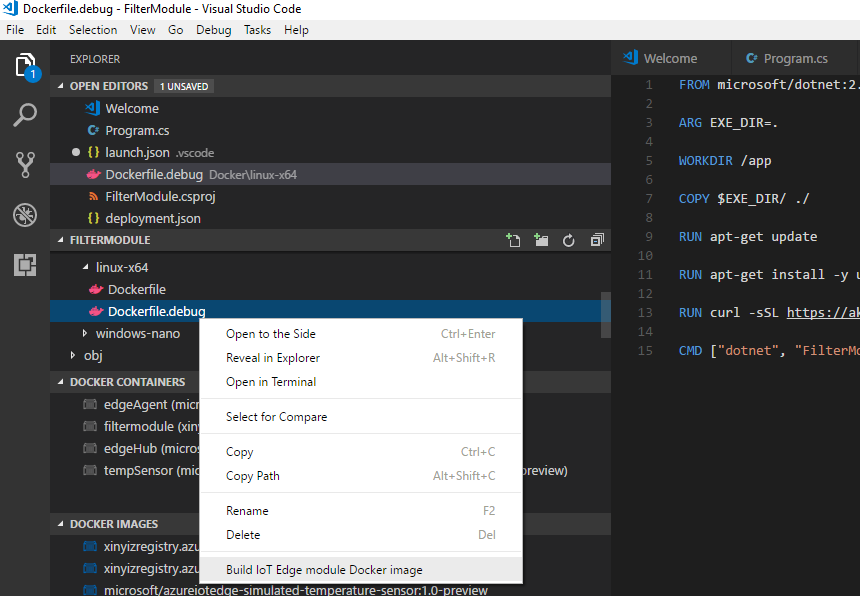
- To start debugging, you will need to use the dockerfile.debug to rebuild your docker image and deploy your Edge solution again. This is to add debugging support and rebuild the Docker image through dockerfile.debug configurations.In Visual Studio Code explorer, select Dockerfile.debug and right-click to select Build IoT Edge module Docker image. Then containerize and publish your module image as usual. It’s recommended you use a local registry to host your images for debugging purposes if you are working on a Linux container.

- You can reuse the deployment.json file (click here to know more about IoT Edge deployment) if you already have the desired modules and routes configured for your IoT Edge device. In command Palette (Ctrl+Shift+P), type and select Edge: Restart Edge to get your module started in debug version.
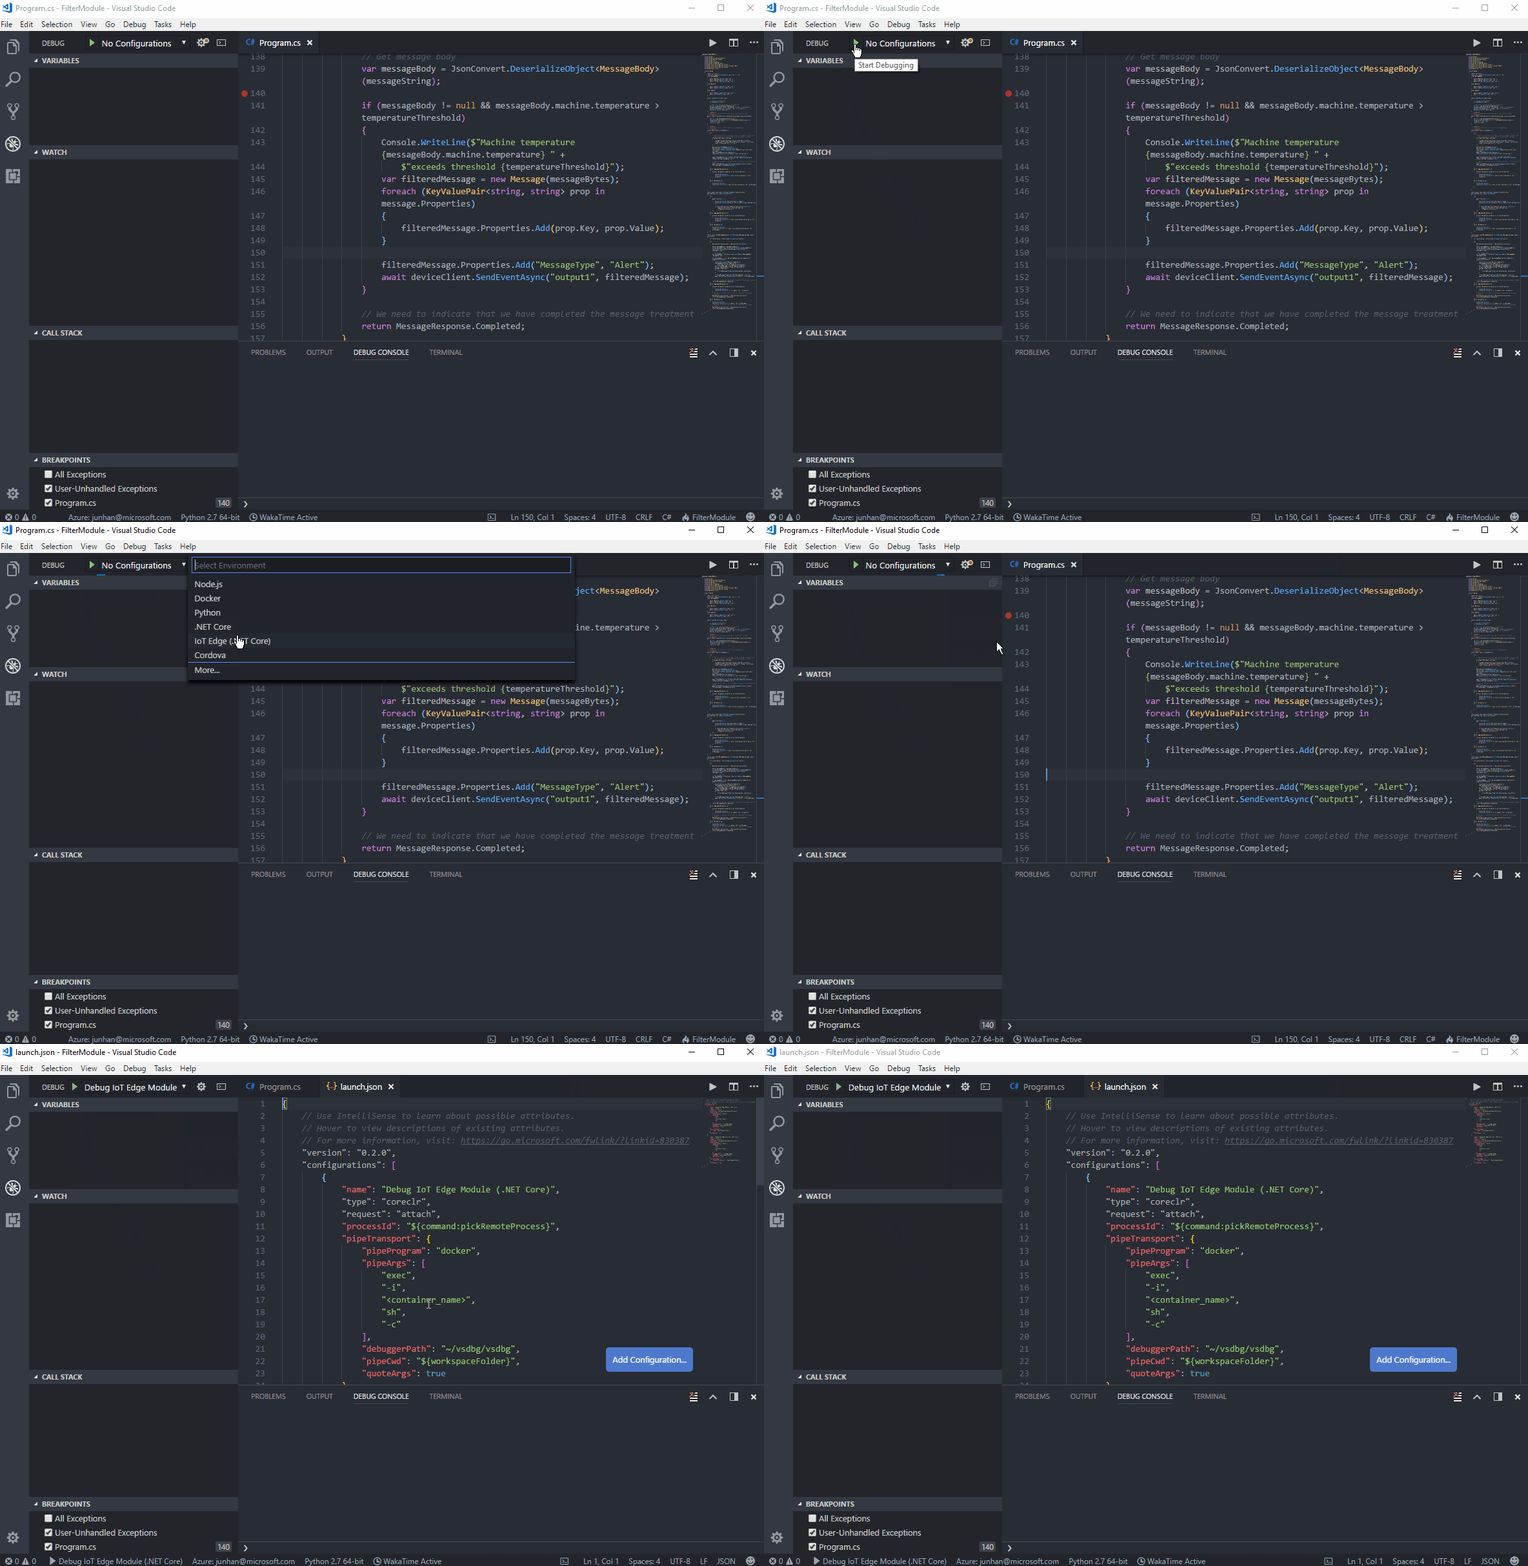
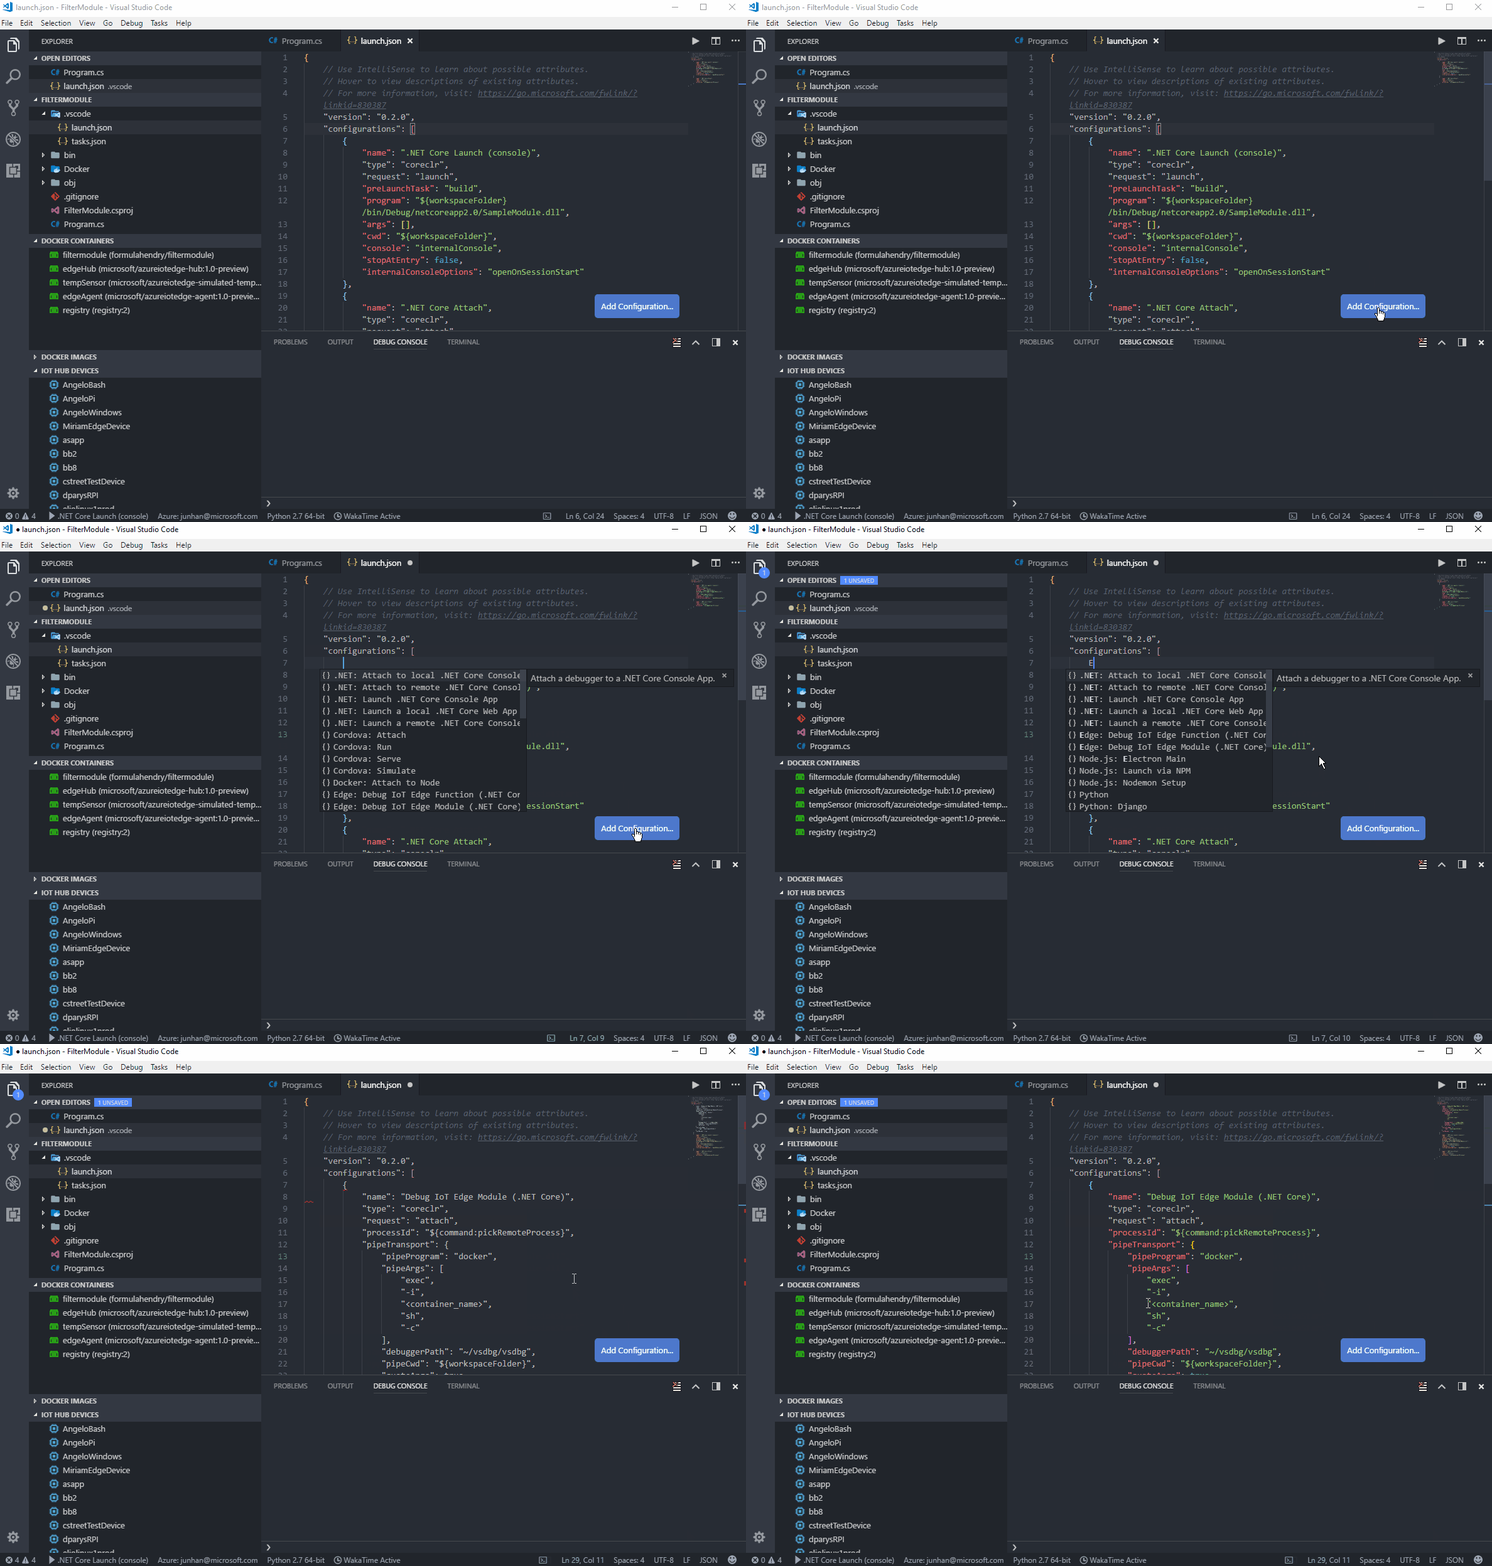
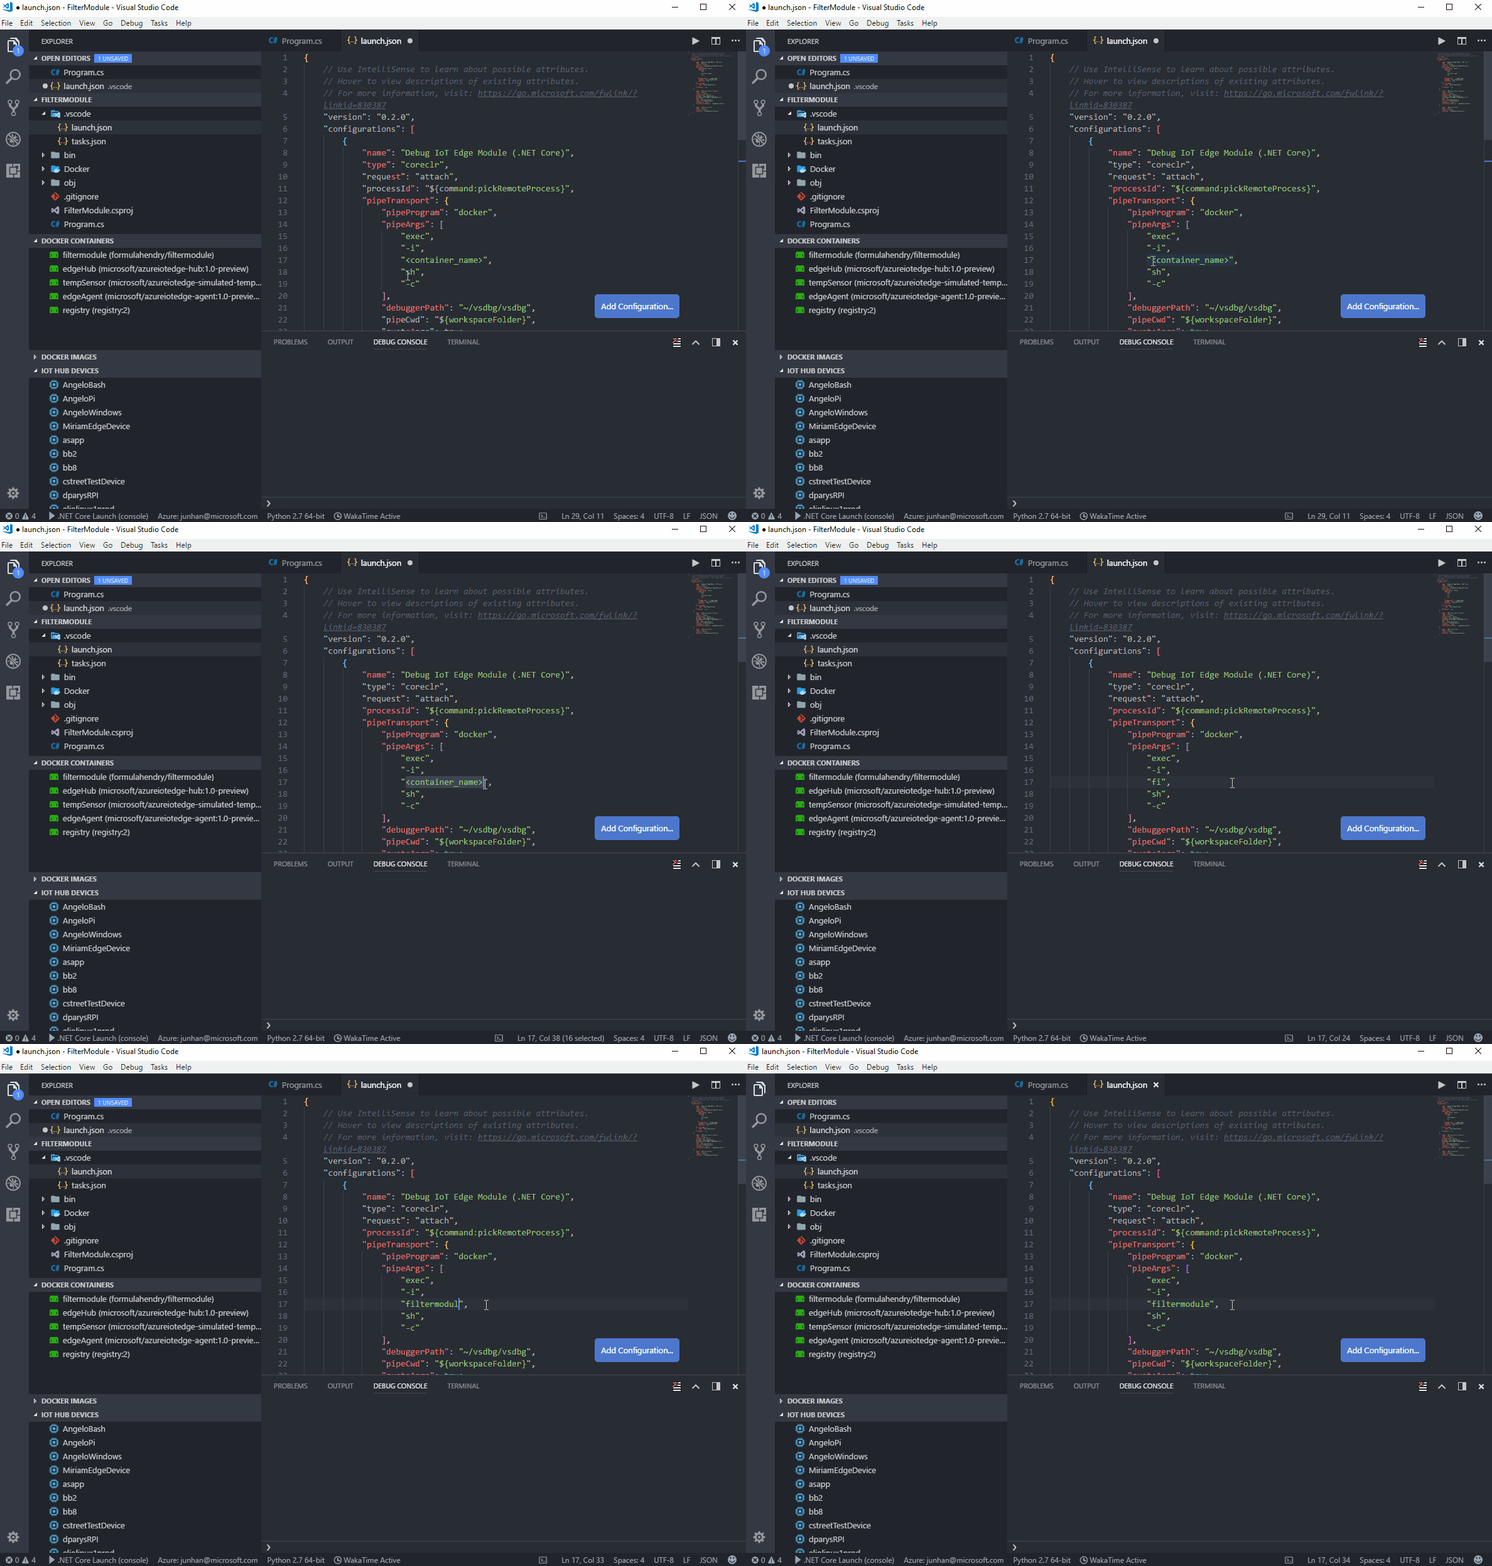
- Now you can setup the debug configuration. Visual Studio Code provides a configuration file launch.json that allows you to configure your own debugging environment (click here to read more). In this scenario, configure your launch.json file as follows:
- If you don’t have a launch.json file yet, navigate to the VS Code debug window, press F5 and select IoT Edge (.Net Core). The launch.json file will be generated for you.

- If the launch.json file already exists, open it in VS Code, click Add Configuration…, and select Edge: Debug IoT Edge Module (.NET Core).

- If you don’t have a launch.json file yet, navigate to the VS Code debug window, press F5 and select IoT Edge (.Net Core). The launch.json file will be generated for you.
- In launch.json, navigate to the Debug IoT Edge Module (.NET Core) section and specify the <container_name>.

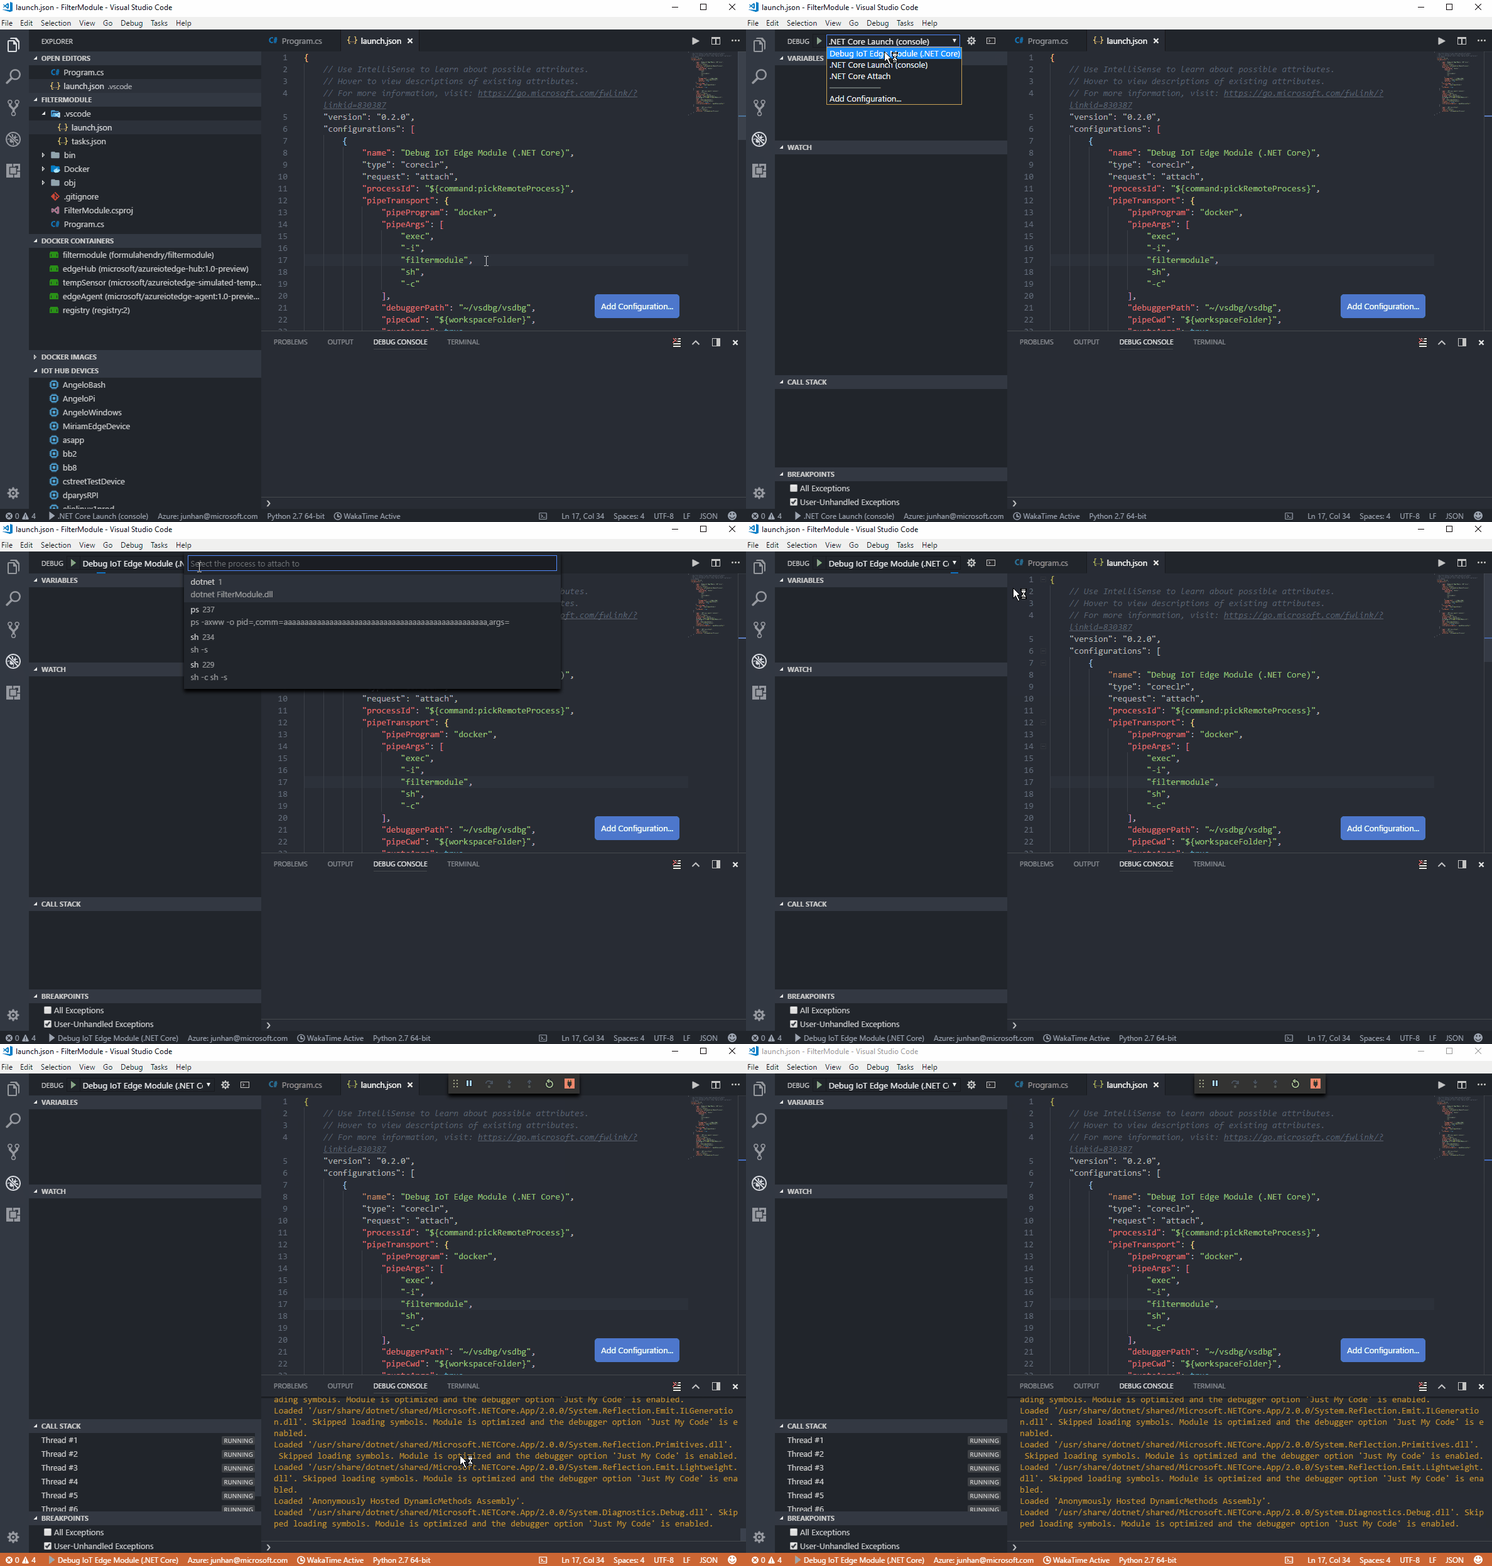
- Navigate to Program.cs. Add breakpoints and press F5 again. Then select the dotnet process to attach to.

- In the Debug window, you can see the variables in the left panel.
Azure IoT Edge extension also supports developing, debugging and deploying Azure Function for IoT Edge. For more information, please visit here.
Try it out
Now that you have learnt the basics about debugging an IoT Edge module with Visual Studio Code, go download the Edge extension and create your first Module, then join Gitter to let us know what you think or if you need help.
 |
Xinyi Zhang, Senior Engineering Manager, IoT Tools and Services
Xinyi is a engineering manager working on IoT tools and services, focusing on providing great dev experience on IoT related tools. |

0 comments