
In this post, App Dev Managers Edward Fry and Sheldon Ledbetter explorer the practical implications of Logical Regression and how we’re using to solve problems in systems via Machine Learning.
Logistic Regression. The very phrase is a mouthful. It’s easy to imagine it being used by actors to improve elocution or by math professors to punish wayward students. What exactly is it, and why should you care?
This article will explore exactly those questions but with a twist: we’ll limit the hardcore math and just talk about how the idea of logistic regression works and some practical applications. We’ll also demonstrate how to use Azure Machine Learning to put all this information to good use in your own business solutions.
What is logistic regression?
Logistic regression, or “LR” for short, is actually a statistical algorithm that attempts to predict a binary data classification. The concept is surprisingly simple: given a set of data for training, you want to predict if new data of the same type falls into one of two categories. That’s it!
To get started, let’s first define the idea of binary classification. The binary part (which just means “two”) is going to be either on or off, yes or no, up or down, zero or one. It’s important to understand that the choices will be mutually exclusive, which just means that only one or the other can be chosen but never both.
Next, let’s discuss the idea of how we identify our data. All data is comprised of individual bits of sub-data, which are called features. The values of various features and how they relate to each other allows machine learning algorithms like LR to make their predictions.
How do I use logistic regression in the real world?
Let’s say that you want to know which of your products will appeal more to men or to women. The outcomes will either be men or women – two mutually exclusive options. The features will be attributes like color, size, location, price, and so on.
If you want to predict if a new product will appeal more to men or to women, you first need some sample data of actual values where you know for sure to whom it appeals. You can gather this information by, for instance, conducting surveys of potential customers. This data will be your training data.
Now, you run your training data through the LR model to get it to recognize the patterns of features and how they correspond to either men or women. (Of course, there are many algorithms out there that do the same thing, but we will focus here on only LR.) Finally, you can run a brand new set of data through the model to predict the most likely outcome.
Notice that I say “most likely”. This is not an exact science, and the art of machine learning, including the LR algorithm, includes a lot of work to get the right data sets and increasing the confidence of the final predictions.
How does logistic regression work its magic?
If you’ve made it this far into the article, you are probably wondering how LR works. Staying light on the math, we begin by defining a mathematical function (which depends on your chosen feature set and which we will not do here for simplicity) to determine the odds that your data falls into one of the predictive categories. You do this by using calculus to determine if you are looking at a local minimum. Yes, you read that right: calculus. Remember derivatives? Yep, those are what we use to find the minimum. But don’t worry; I’ll use pictures instead of Greek symbols to explain.
Below, I’ve prepared a plot of 2 features. In reality, of course, most machine learning models use lots of features (dozens are not uncommon), but plotting dozens of features isn’t feasible (or even necessary) here, so we’ll keep it at 2 for simplicity.
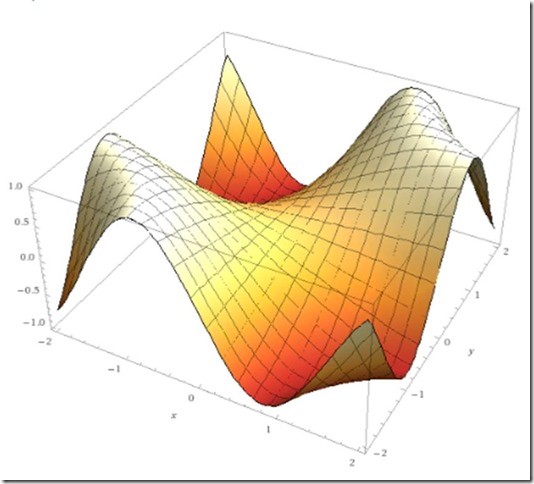
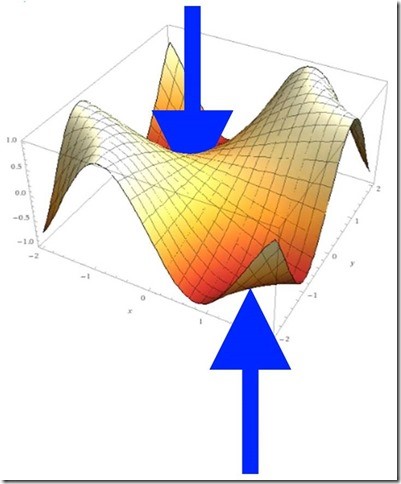
The whole name of the logistic regression game is to find the local minimums (or one of them, anyway), like where the arrows are pointing:
Now, let’s take it a step further. The same function you just defined needs to be applied with all of the feature values in your data set. That means an iteration (think for loop, although, in practice, matrix math from linear algebra is usually used so as to speed up computation) with that classifier function across those values, which lets you figure out which of those iterations is the minimum. And THAT is the one you will use to make the prediction.
To help visualize what is going on, imagine that we are slicing across our plot one plane at a time, which will give us a series of 2-dimensional plots of functions, as illustrated below.

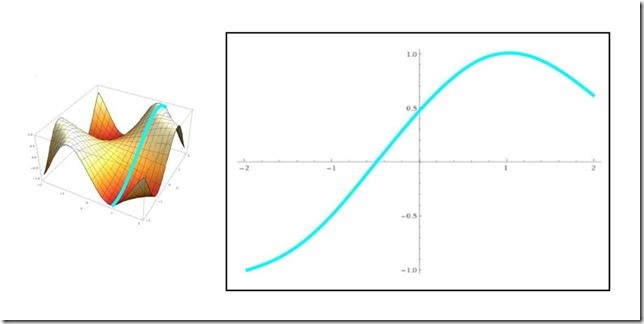

As consecutive slices are made, we end up with a series of curves, and we can use a derivative to find the minimum of each. After iterating the entire domain (or a portion that we choose), we will have the exact point of the local minimum. Once we have that, we associate it with one of the classification states (i.e. on or off) for that feature set.
A few points are in order. First, I’ve greatly simplified here. For example, I keep saying local minimum because, as you can see from the 3d plot, there are usually multiple minimums. Solving this “problem” is a matter for another time. Additionally, errors should be calculated and fed back into the model to improve accuracy – to a point. Determining the sweet spot for training is something of an art, and calculating errors requires additional consideration. And lastly, choosing your data set and the features to use is almost a discipline unto itself. But – if you understand the basic idea of the algorithm, you can add the extra concepts later and be ok.
Finally, while we did promise to limit the math, let’s take just a moment to acknowledge that there IS a lot of serious math like calculus and linear algebra behind this algorithm, which is why something like Azure Machine Learning is so awesome – it handles all the math (and errors, and training, and on and on) for you! If you DO want to go deep on the math, though, here is a great Wiki page that you can read if you are really curious:
https://en.wikipedia.org/wiki/Logistic_regression
Now, let’s see it in practice with Azure Machine Learning!
So some would consider this ability to predict a behavior as even a “super power”. Just think to predict (not just guess) but actually almost guarantee a certain outcome. Some would find such a feat as amazing, miraculous or crazy. But it’s not that crazy and in this area of logistic regression this is very possible. The actual consideration of a shopper buying the same item again or even returning to that particular store is very possible now with Azure machine learning and logistic regression.
David Chappell defines Azure Machine Learning as: Data can hold secrets, especially if you have lots of it. With lots of data about something, you can examine that data in intelligent ways to find patterns. And those patterns, which are typically too complex for you to detect yourself, can tell you how to solve a problem.
This is exactly what machine learning does: It examines large amounts of data looking for patterns, then generates code that lets you recognize those patterns in new data. Your applications can use this generated code to make better predictions. In other words, machine learning can help you create smarter applications. (found in his Introduction for Technical Professionals).
So let’s talk about our shopper example. Suppose a company wants to predict which stores in big box corp are going to have the highest returning shoppers during the next black Friday shopping event and more so which type of items will sell more of (i.e. electronics (TV’s, computers, etc.).
Consider the fact that many retailers have very cyclical sales/shopping patterns and that black Friday happens only once a year. A big box store therefore would be very interested in knowing or predicting what products to have more of at a certain store and available at a certain time of year. It could then purchase items at better discounts in bulk, have them stocked at a specific warehouse or even drop-shipped to a specific store. That big box company would likely have past store sales, broken down by department, date, weather temperature for that geo-graphic region, regional unemployment rate, regional price of gas (transportation fuel), markdown (promotional rate), and other non black Friday holiday events to analyze (i.e. Super Bowl, Labor Day…).
With Azure Machine Learning a person could gather this large amount of data from a variety of data sources (big box corp sales databases, weather data (NOAA), Government websites (unemployment rates)…etc. (This would likely have millions of records of information from several data sources in different data types with multiple fields per record that we are interested in.) Once we had this information we could then create an experiment to model our problem.
So how do we use Azure Machine Learning to tackle this problem? For starters you can get a sense of what’s involved by once again reviewing a figure from David Chappell where he shows the overall process.

If we look at his process and pattern our shopper returning problem using it we would build ours in Azure Machine Learning by:
- Load raw data
- Do pre-processing of that data (clean up)
- Train our time series model
- Feature engineering
- Train our regression model
- Evaluate Models
- Deploy web service with time series model
- Deploy web service with our regression model
The final result (web service) can be consumed in either a Request Response Service and/or Batch Execution Service. The Azure Machine Learning website provides sample code (C#/Python/R) with links found in the web service help API (more on this next).
Starting out with Azure Machine Learning is very easy. First you can begin with a free account by visiting https://studio.azureml.net/ and signing up. No credit card is needed to begin.
Once you’ve created an account you can then create your own experiment or visit the gallery of experiments that others have created. Viewing the gallery can be very helpful to see the steps that others took and to fashion your own experiment. A similar example from the gallery is found here.
Summary
Microsoft Azure Machine Learning provides a cloud-based machine learning platform for data scientists to easily build and deploy machine learning applications. The retail example, along with useful templates published by Microsoft, further enables users to perform fast prototyping and deployment of machine learning solutions.
Premier Support for Developers provides strategic technology guidance, critical support coverage, and a range of essential services to help teams optimize development lifecycles and improve software quality. Contact your Application Development Manager (ADM) or email us to learn more about what we can do for you.
0 comments