
In this blog entry and some future ones I will be showing off functionalities that our new GC perf infrastructure provides. Andy and I have been working on it (he did all the work; I merely played the consultant role). We will be open sourcing it soon and I wanted to give you some examples of using it and you can add these to your repertoire of perf analysis techniques when it’s available.
The general GC perf analysis flow on a customer scenario usually goes like this –
1) get a perf trace (ETW trace on Windows and event trace on Linux);
2A) if the customer has no complains and just wanted to see if they can improve things, we first get a general idea of things and see if/how they can be improved or
2B) if the customer does have specific complains (eg, long GC pauses, or too much memory used) we look for things that could cause them.
Of course, as any experienced perf person would know, perf analysis can vary greatly from one case to the next. You look at some data to get some clues to identify the suspicious areas and focus on those areas and get more clues…and usually make incremental progress before you get to the root cause.
To give some context, for data we get from trace, we have a library named TraceEvent that parses it into TraceGC objects. Since GC is per process, each process (that observed at least one GC) will get its list of these TraceGC objects. And the TraceGC type includes information on this GC such as
- Basic things which are read directly from some GC event’s fields like Number (index of this GC), Generation (which generation this GC collected), PerHeapHistories (which includes a lot of info such as what condemned reasons this heap incurred, the generation data for each generation for this heap)
- Processed info like PauseDurationMSec (for ephemeral GCs this is the difference between the timestamp of the SuspendEEStart event and the RestartEEStop event);
- Info that gets light up when you have the additional events, eg, GCCpuMSec if you have CPU samples collected in the trace;
So given a basic GC trace there’s already a ton of info you can get. We do some processing in TraceEvent and a perf analysis means looking at info these TraceGC objects give you in really any number of ways.
If we have a big trace, the time that it took to parse the trace to get these TraceGC objects can be very long. And if I change my analysis code I’d have to start my analysis process again which means I’d have to parse the trace again. This seemed very inefficient. I started searching for options that could persist the TraceGC objects and I can just modify my code to consume them without having to reprocess the trace. And I found Jupyter Notebook which allows you to edit python code in individual cells but the results from them persist in memory and can be used by any other cells. And I found pythonnet which allows you to interop with a c# lib from python. This means I could persist the TraceGC objects in memory and edit the code that I want to look at any of these objects in any way I desire and don’t need to reprocess the trace at all. This along with the nice charting capability from python gave me exactly what I needed. So what I would do is to have one cell that just did the trace processing with all the resulting TraceGC objects, and other cells for various ways to look at info in these objects and edit them whenever I needed.
This was several years ago and I’ve been using it since. When Andy joined the team and started working on a new GC perf infra I asked him to adapt this as part of our infra. And today I looked at a trace with him and below is what we did.
In this case I just got the trace from a customer to see if we can find anything can be improved by something the customer can do or we did but in a release the customer hasn’t upgraded to, or we are doing/planning to do. To start with, we looked at 3 metrics – individual GC pause times (PauseDurationMSec), GC speed PromotedMBPerSec(ie, # of MB GC promoted / (PauseDurationMSec / 1000)) and heap size in MB after each GC (HeapSizeAfterMB), just to get a general idea. We used the histogram charts for these:
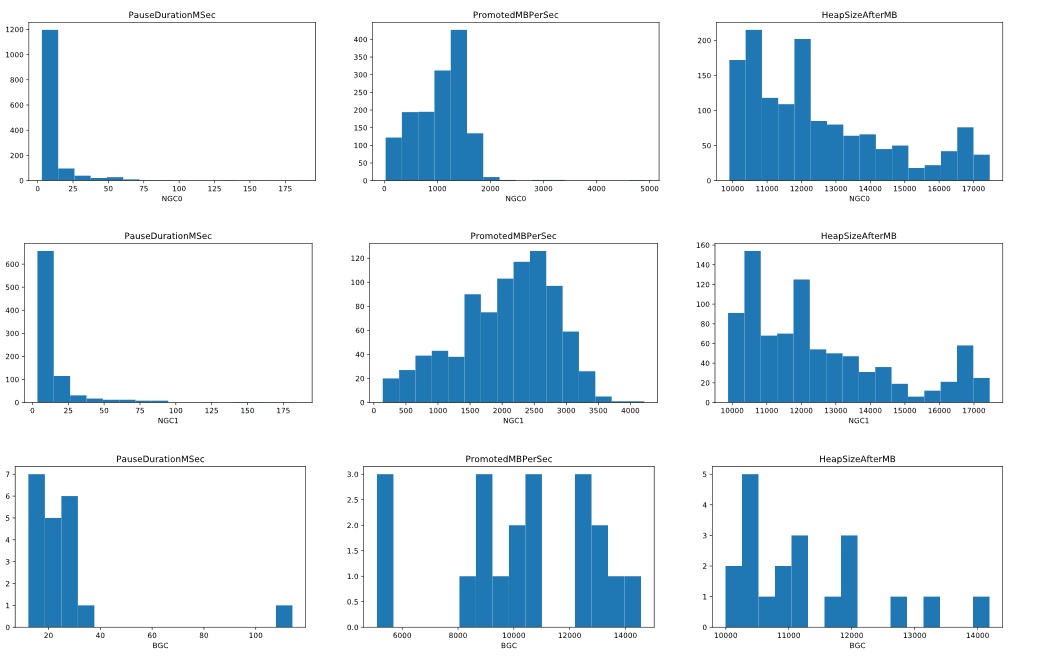
*NGC means NonConcurrent GC, I didn’t want to call it BGC (Blocking GC) because we already have BGC mean Background GC.
If you look at the PauseDurationMSec charts for gen0 GCs (NGC0), gen1 GCs (NGC1) and BGCs (there were no full blocking GCs in this trace), most of them were in the range of a few to 20ms. But there are definitely some longer ones, eg some that are between 75 and 100ms in the NGC0 chart. And right off the bat we see some outliers for BGC – most of them are < 40ms but then there are some > 100ms! And it’s hard to see on the charts but there are actually some thin blue lines in the > 100ms range in both the NGC0 and NGC1 charts.
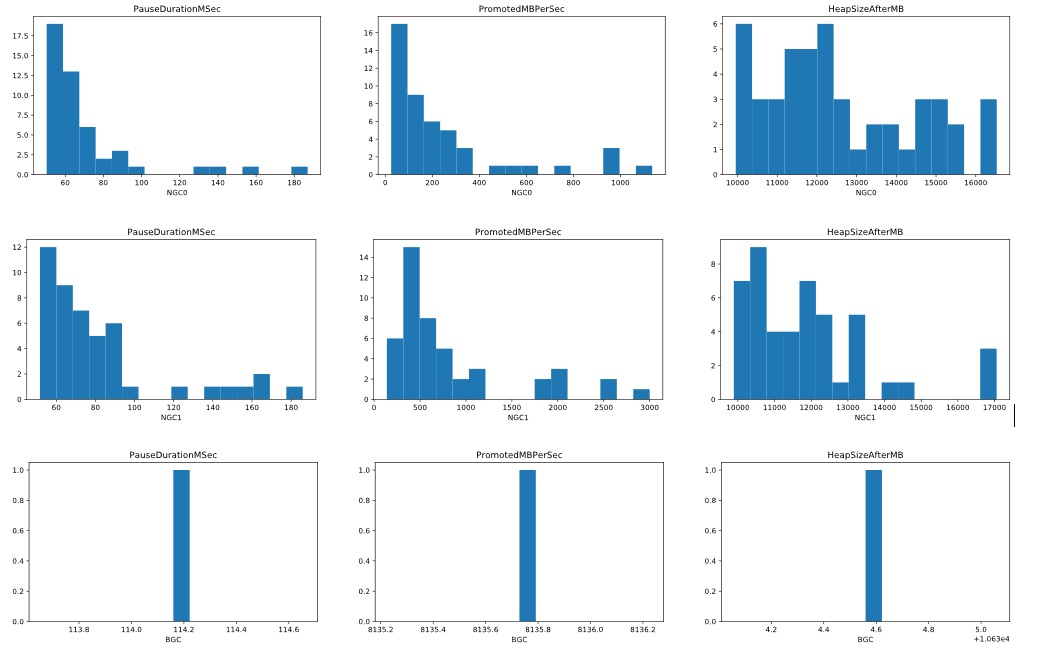
Since we are using Jupyter, we just changed the code in the cell for this and only showed GCs with the PauseDurationMSec > 50ms and redrew the charts – now it’s very clear there are some ephemeral GCs > 100ms pauses and we can see the 1 long BGC pause is 114.2ms.
And we can see the GC speed (the PromotedMBPerSec charts) for many of these are low. In the NGC0 chart most of the GCs are on the left hand side with the lowest speed.
If the long GCs’s PromotedMBPerSec was not so low it would mean they simply had a lot more memory to promote which would indicate a GC tuning problem – one very likely reason would be we are not setting the allocation budgets correctly.
But since that’s not the case we wanted to see why these GC’s speed was so low – we spent a long time paused but GC was not able to do work at its normal speed.
Let’s concentrate on the gen0 GCs (NGC0) first as a starting point. We know the way PauseDurationMSec is calculated so it consists of suspending EE (SuspendDurationMSec)+ actual GC work + resuming EE. Resuming the EE generally takes very little time so I’ll not look at it first. I wanted to see if suspension was too long. So we looked at NGC0’s pause and suspension with our table printing function. Since it’s so easy we’ll throw in the total promoted mb and the GC speed and let’s sort by PauseDurationMSec (highest first):
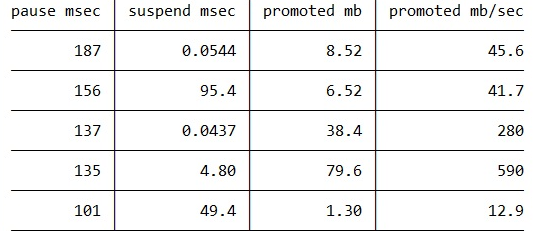
“pause msec” is PauseDurationMSec.
“suspend msec” is SuspendDurationMSec.
“promoted mb” is PromotedMB for this GC.
(I’m only showing the top few for brevity)
Right away we see some long suspension times – the GCs that took 156ms and 101ms, spent 95.4ms and 49.4ms in suspension respectively. So that definitely shows a suspension issue which means the suspension in EE had trouble suspending the managed threads. But the other GCs, like the longest one that took 187ms spent very little time in suspension.
We do have another field in the TraceGC class called DurationMSec which is the difference between the timestamp for the GCStart event and the GCStop event. From the first glance this should just be PauseDurationMSec – suspending EE – resuming EE. Almost – there’s a bit of work we have to do between SuspendEEStop and GCStart, and between GCStop and RestartEEStart. So if things work as expected, (PauseDurationMSec – DurationMSec) should be almost the same as (suspending EE + resuming EE). We changed the code again to add a DurationMSec column (“duration msec”) and we sort by that column
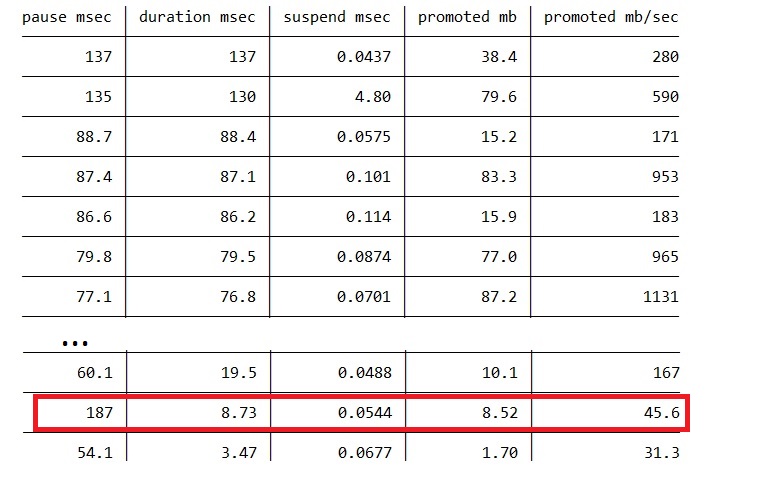
The longest GC (187ms) has only 8.73ms DurationMSec! And Suspend only took 0.0544ms. So there’s a huge difference between PauseDurationMSec and DurationMSec, not accounted by the suspension cost.
We modified the code again to add a few more columns, mainly the “pause to start” column which is the difference between the timestamp of SuspendEEStart and GCStart so it includes the suspension time. We also calculate a “pause %” column which is (“suspend msec” / “pause to start” * 100) and a “suspend %” column which is (“suspend msec” / “pause msec” * 100). Also we changed the “promoted mb/sec” column to use DurationMSec instead of PauseDurationMSec. Now some rows in the table change very drastically. The table is sorted by the “pause %” column.
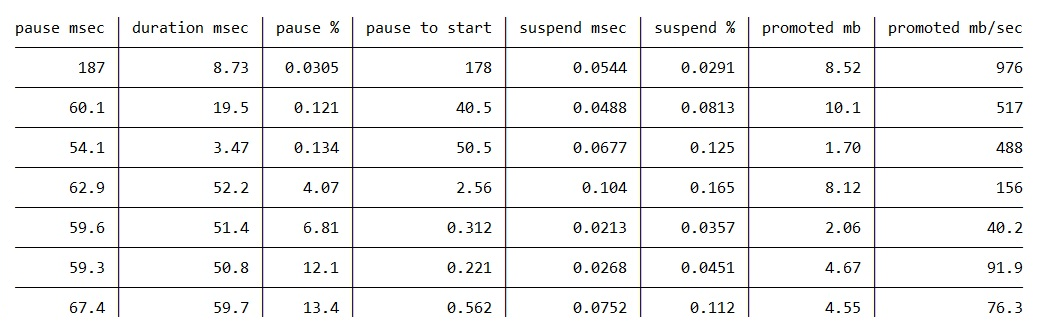
The GC that took 187ms spent 178ms from SuspendEEStart to GCStart!!! And of course the GC speed (promoted mb/sec) is now a lot higher.
This is enough evidence to tell us that the GC threads are getting severely interfered (suspension is not the only part that was affected), could be from other processes or other threads in this process. We’d need to collect more events to diagnose further.
Thanks for this post, I'm looking forward for part 1 :)
As a PFE I'm always looking how to improve applications performance, reducing memory allocation and tuning the GC are two of my favorites analysis.
I think I can open an issue on Perfview repo to discuss (and then send a PR) the inclusion of these columns to the GCStats view. Ideally we should have a pause msec column and all the "sub columns" (pause msec = suspend time + pause to start + actual gc duration + pause to restart + restart time). What do you think?
I just would change "pause...
sorry to reply late – I’ve been told that GCStats already has too many columns 😀 the fact it’s an HTML page makes it very hard to navigate so adding more columns is probably not very desirable but you can always use the infra to do more detailed analysis. this is one of the reasons why the infra is there – you can dig (a lot) deeper on the events programmatically.
happy to discuss more – send me email if you like.
Is this going to be published on .Net Core ? Not .Net ?
not sure what you meant by “published”. this is infrastructure – for analysis part it can handle both perf traces from .net core and .net. for running tests we only support running with .net core. it’s very different to run with .net than with .net core. and the fact that without installing to a private directory you cannot have multiple builds of .net on the same machine makes it less useful.
In fact,I’m more interested in how you improve GC’s performance instead of infrastructure to check GC perf.
How do you know GC’s performance has been improved without the proper tool to measure it? You always profile before optimizing.