
Debugging .NET Apps with Time Travel Debugging (TTD)
When you are debugging an application, there are many tools and techniques you can use, like logs, memory dumps and Event Tracing for Windows (ETW). In this post, we will talk about Time Travel Debugging, a tool used by Microsoft Support and product teams and more advanced users, but I encourage everyone to try this approach when diagnosing hard to find bugs.
Time Travel Debugging
Time Travel Debugging or TTD, is the process of recording and then replay the execution of a process, both forwards and backward, to understand what is happening during the execution. It is vital to fixing bugs when the root cause is not clear, and the symptoms appear moments later when the source of the problem is gone. In a way it’s similar to Intellitrace (available in Visual Studio 2017 Enterprise), but while Intellitrace records specific events and associated data – call stack, function parameters and return value -, TTD embraces a more general approach and let you move at a single instruction level and access any process data (heap, registers, stack).
The same way you can debug a native or managed process, you can also use TTD in both cases, including .NET Core, but it is limited to Windows. In the following sections, we’ll describe particularities when debugging a managed process.
It also allows you to rewind and play how many times you want, helping you to isolate the problem when it happened, and setting breakpoints just as you usually do in Windbg. Even when you don’t need to rewind, TTD has advantages over Live Debugging, since it doesn’t interrupt the process, you can create a trace and analyze it offline, but be aware that TTD is very intrusive and ideally you shouldn’t use it for more than a few minutes or the traces files can become very large (>5GB).
Demo Lab
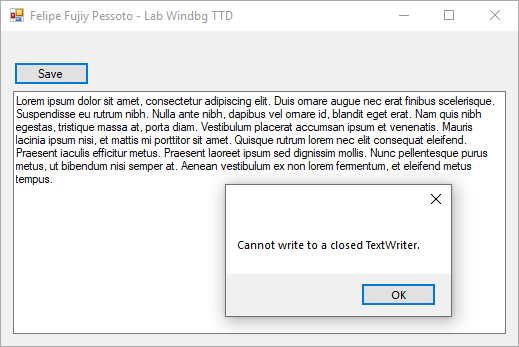
The demo application is a simple Windows Forms bugged applications that writes a log file to disk. You can download the code from GitHub and compile it, or download the binaries. The machine where we’ll record the traces must be a Windows 10 Anniversary Update or newer.
Open the application and click on Save several times and after some seconds it doesn’t work anymore:
Recording a trace
You can use WinDbg Preview to record the trace, it is available in Microsoft Store.
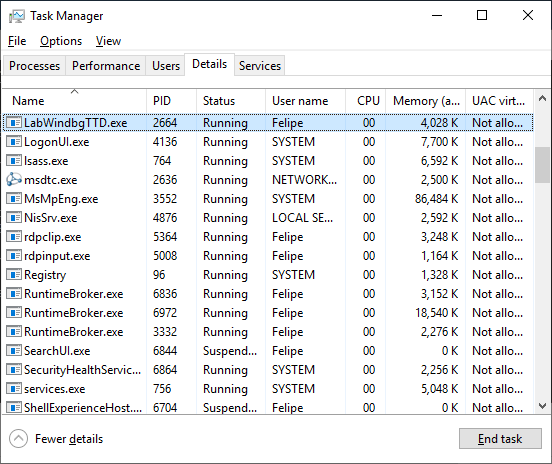
1. Open the LabWindbgTTD.exe in the target machine and take a note of its PID:
2. Open WinDbg Preview as admin, click on File -> Start debugging -> “Attach to process” and search for the process name or PID (in case you have multiple processs with the same name). Check the option “Record process with Time Travel Debugging” and optionally change the output dictory:
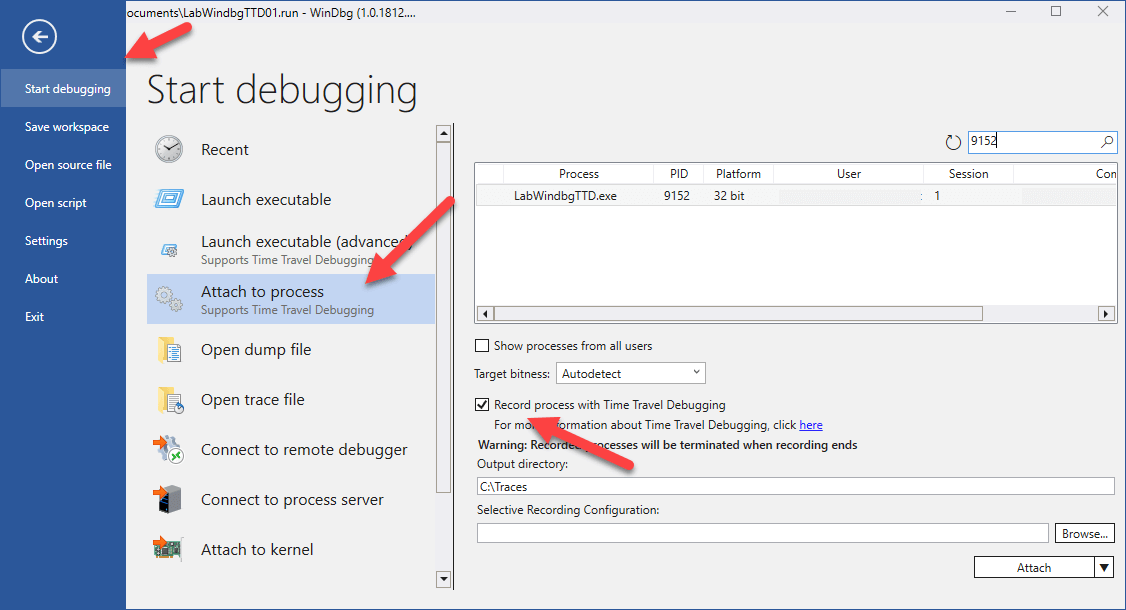
Now, the TTD is recording the process execution, keep it open.
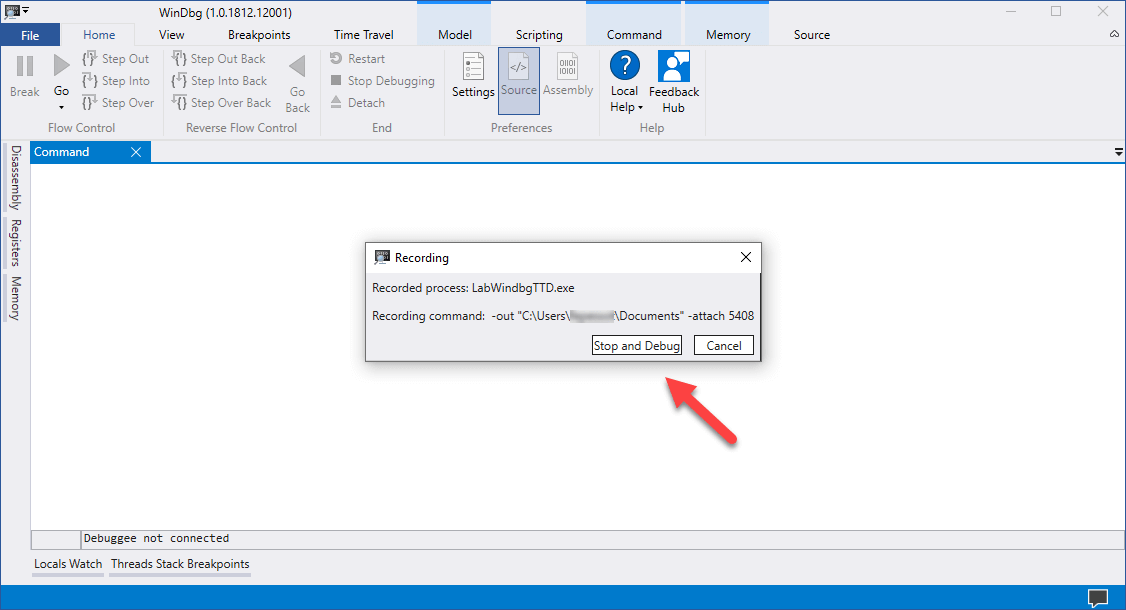
3. Go to the LabWindbgTTD application and click on Save several times until you receive the error. After the error appears, click on “Stop and Debug”, the processes will be closed:
4. WinDbg will automatically load the resulting file and index it:
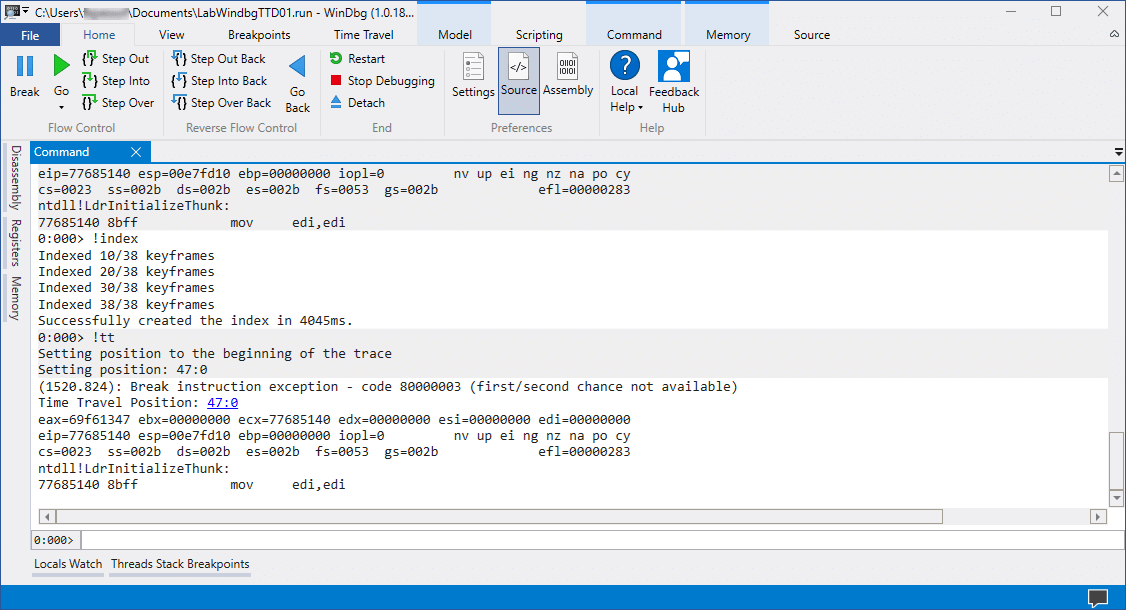
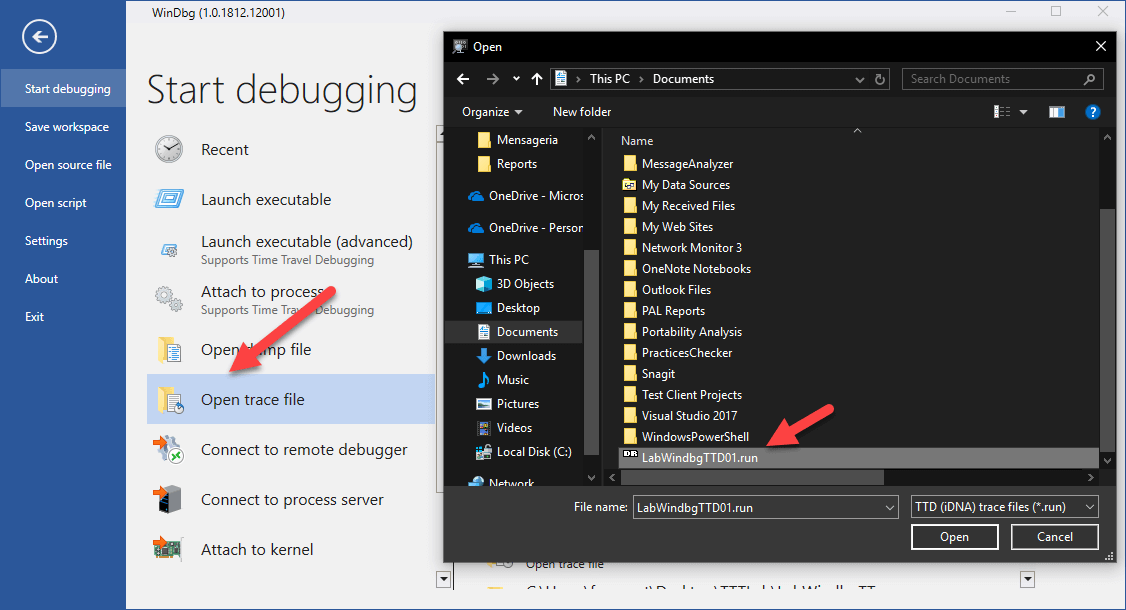
5. You can also open it later clicking on File -> Open trace file and select the .run file:
Replay and Analyze
Copy the files to your machine, you can use WinDbg or WinDbg Preview to analyze it and don’t forget to set up the symbols to be able to resolve the function names. We’ll use WinDbg Preview, but the steps are similar in WinDbg, click File -> Open Trace File and select the “.run” file.
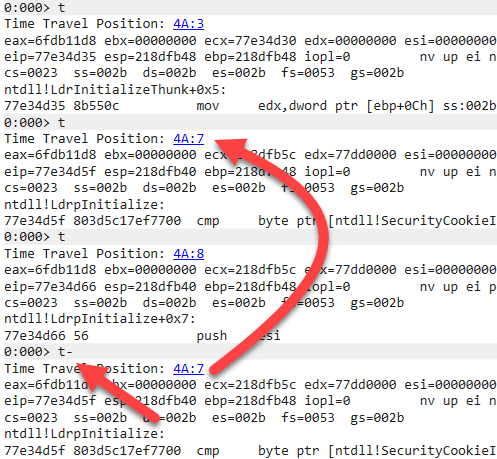
When debugging a TTD file, you can Step Into (t), Step Out and Step Over (p) like you do when Live Debugging:
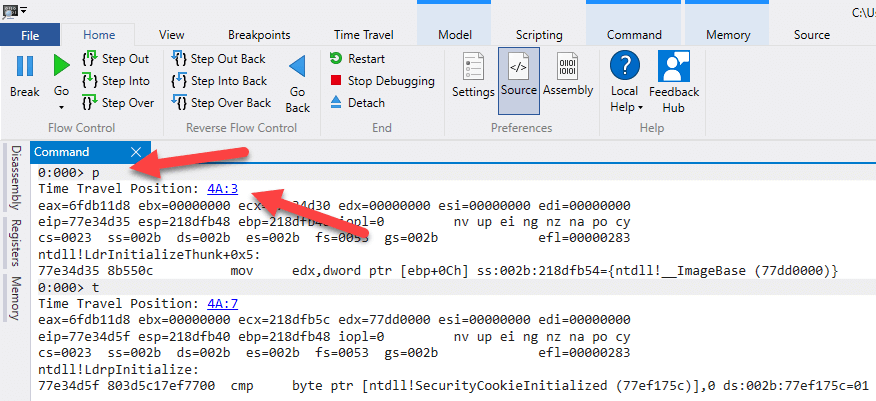
You can see the current Time Travel Position when stepping through the application, like in the image above.
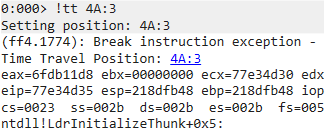
Using the !tt <POSITION> command you can navigate to a specific position:
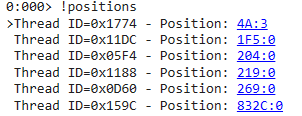
The !positions command show the positions for all threads:
But it gets interesting when using the Step command contrariwise, instead of p, t, and g, you can execute p- (Step Back), t- (Trace Back), and g- (Go Back):
Loading Data Access Component and SOS debugging extension
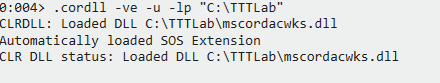
When debugging .NET applications in a different machine from where the dump or trace was created, you need to copy the Data Access and SOS dlls:
- For .NET Framework: mscordacwks.dll and SOS.dll in C:\Windows\Microsoft.NET\Framework\v4.0.30319\ (or C:\Windows\Microsoft.NET\Framework64\v4.0.30319\ for 64 bits processes)
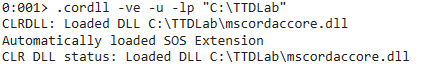
- For .NET Core: mscordaccore.dll and SOS.dll in C:\Program Files\dotnet\shared\Microsoft.NETCore.App\X.X.X\
And execute this command in WinDbg:
.cordll -ve -u -lp <PATH>
Finding the problem
Now we know how to navigate into the TTD file, how can we find the bug?
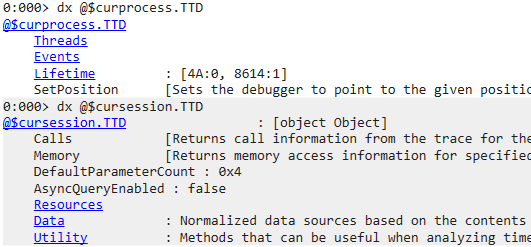
Let’s try to stop when the error occurs, to do this you could use “sxe clr;g” like you would do in a Live Debug, but the TTD extends the Session and Process data model objects, exposing events like Exceptions. To see them all, execute “dx @$curprocess.TTD” and “dx @$cursession.TTD“:
We can take advantage of this feature and filter the Exception events, “dx -r2 @$curprocess.TTD.Events.Where(t => t.Type == “Exception”).Select(e => e.Exception)“:
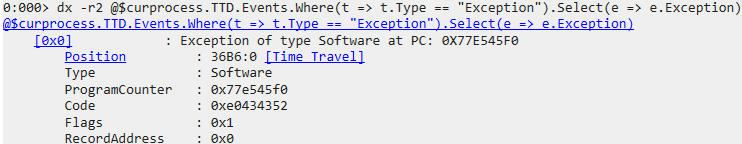
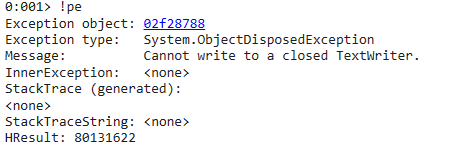
Click on [Time Travel] to navigate to the moment when the Exception was thrown and execute !pe to see the System.ObjectDisposedException.
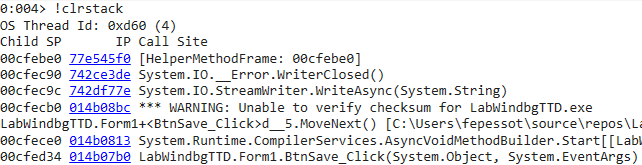
You can now execute !clrstack to see exactly which method is throwing the Exception, but it isn’t helpful since the BtnSave_Click just call StreamWriter.WriteAsync and is not disposing the object.
In this case, a log containing the Stack Trace, or a Dump file wouldn’t help. The application is small and simple enough that looking the code you would easily find the problem, but let’s continue the analysis using the WinDbg.
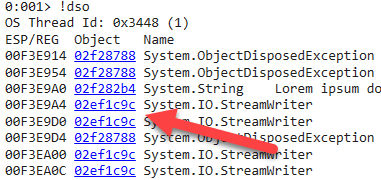
Execute !dso (or !DumpStackObjects) to see the objects in the current stack and click on StreamWriter address.
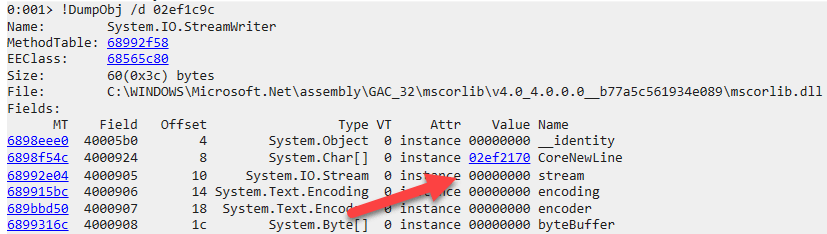
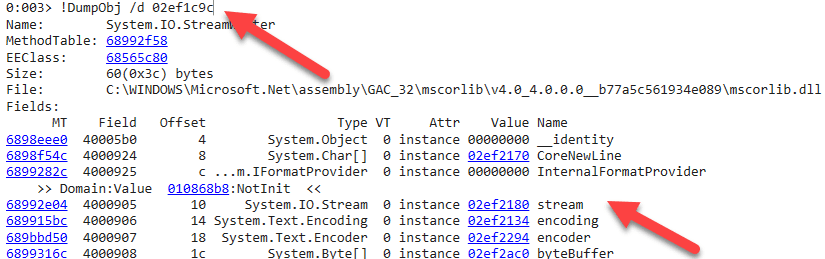
Click the address to execute !do (or !DumpObj) that shows the details of the object, including its fields, where we can see the stream is null, which means it is disposed.
We know that at this point the StreamWrite.Dispose method has been called and we need to find out who called it. Set a breakpoint to this method and continue the execution in reverse, “!bpmd mscorlib.dll System.IO.StreamWriter.Dispose;g-“:
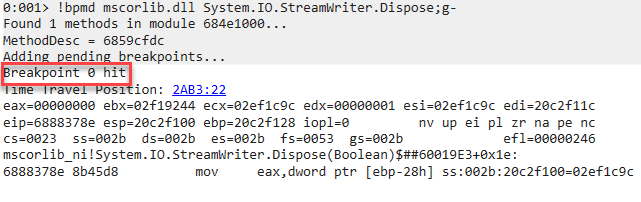
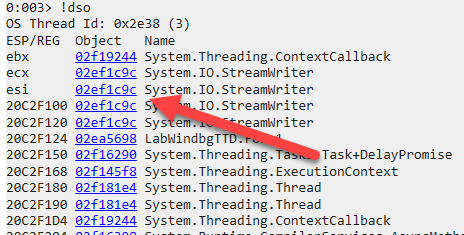
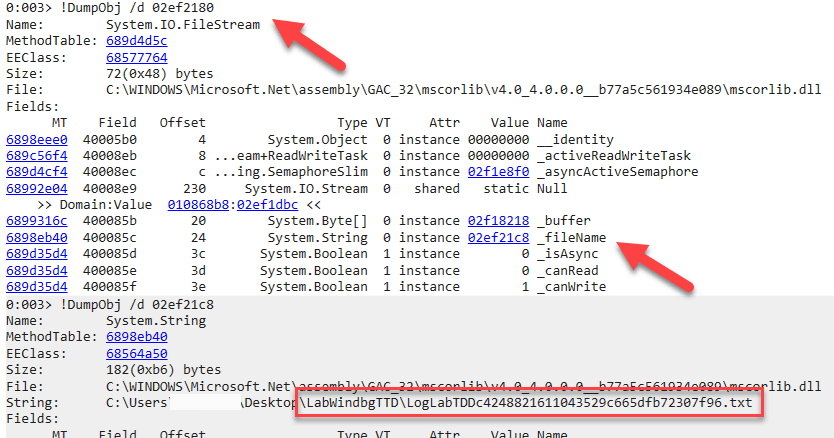
You’ll stop at Dispose method of StreamWriter. Execute !dso again, we can see a StreamWriter in the same address as before, let’s inspect the object and the underlying stream to find more details about it.
The object address may be different because a Garbage Collection happened or just because we are looking at a different instance of StreamWriter. In this case, you would need to check if the object is the same.
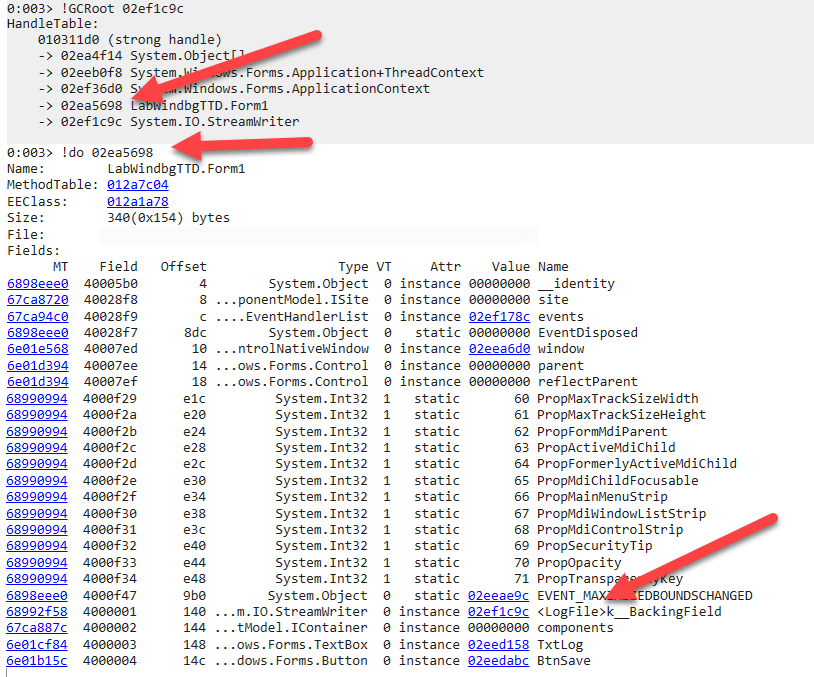
Another option, to see if the object is the same, is to use !GCRoot to find references to the object, this way we can see if in both moments the StreamWriter object is the LogFile field in Form1.
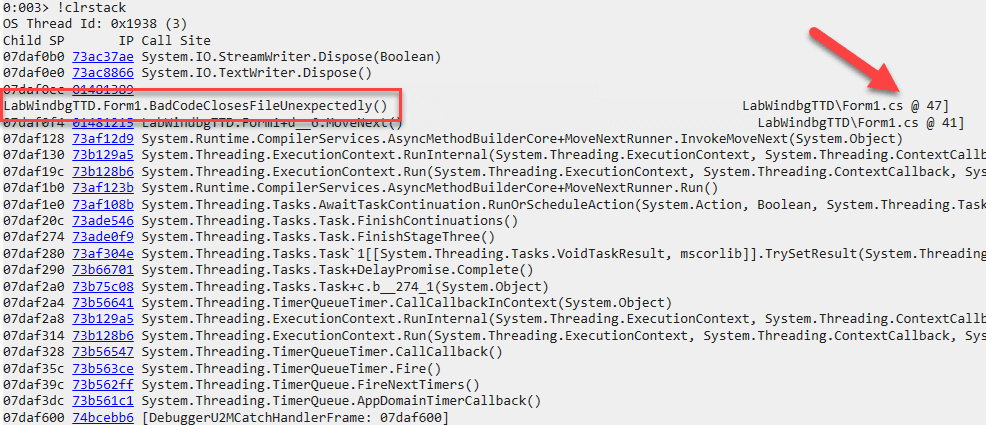
If it is not the object you are looking for, execute g- again until you find it, then execute !clrstack to show the Stack Trace and find the method that is Disposing the StreamWriter:

Conclusion
TTD makes it viable to analyze many scenarios that would be extremely difficult to reproduce or to collect the right data. The possibility of going back and forth is powerful and has the potential to greatly reduce troubleshooting time.
Microsoft Docs has many more details about TTTracer and Windbg Preview.
 Light
Light Dark
Dark
0 comments