With the release of ASP.NET and Web Tools 2012.2 RC (details here), we have added a couple of new features to Page Inspector in Visual Studio 2012, namely CSS Auto-Sync and JavaScript Selection Mapping.
I explain these features in the context of a MVC 4 Single Page Application (SPA app) below, which is a new template available in this release. But the Page Inspector improvements are available for all the other kinds of web projects as well, such as other types of MVC projects and web forms projects.
CSS Auto-Sync
Let’s get started by creating a new MVC 4 SPA application using VS 2012.
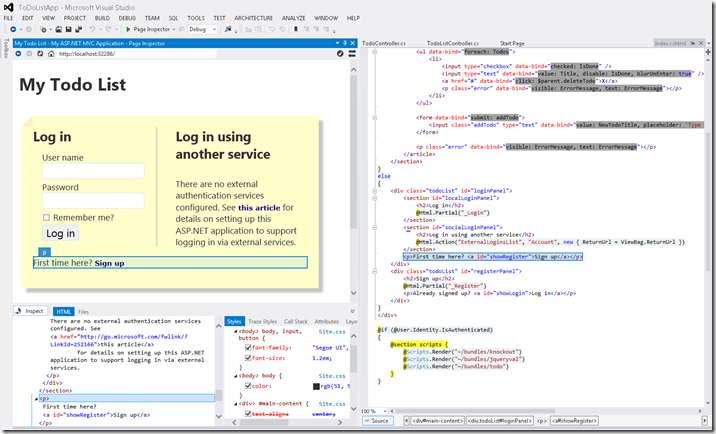
With VS 2012, once the application is created, you can right-click the MVC project and ‘View in Page Inspector’ and the page will load in the Page Inspector browser. You can click ‘Inspect’ and as you inspect various elements on the page (see figure 1), and Page Inspector provides you a visual representation of the element in the page’s DOM tree, lists the CSS properties for the element in the Styles pane and performs Source Code Selection Mapping, ie. range selection in the source file that generated the HTML element (for non-dynamically generated elements).
Figure 1 : Inspecting the paragraph containing the ‘Sign Up’ link
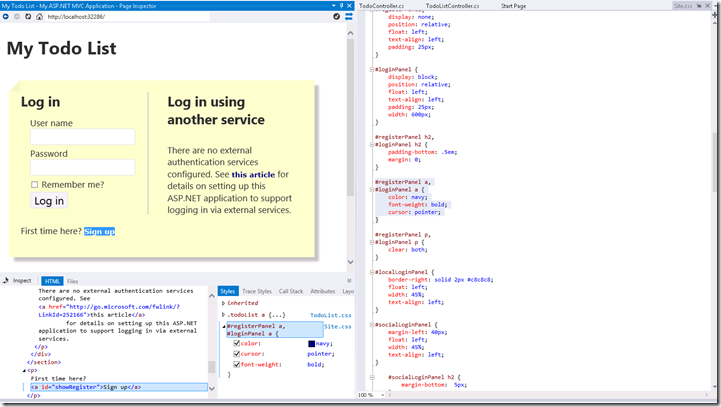
Similar to other browser tools, you can change values in the Page Inspector DOM Explorer, and the browser automatically reflects the changes. You can click on a selector in the Styles pane and that will take you directly to the rule in the CSS file (See figure 2).
Figure 2 : Click on a selector to take you directly to the rule in the CSS file
Editing styles in the Styles pane of the DOM Explorer was useful to try out different styles, but there were limitations. If you made a bunch of changes in the Styles pane and wanted to save those changes, you had to manually port those changes over to the CSS file. You could only edit existing rules, but could not add new rules.
New CSS Auto-Sync feature –
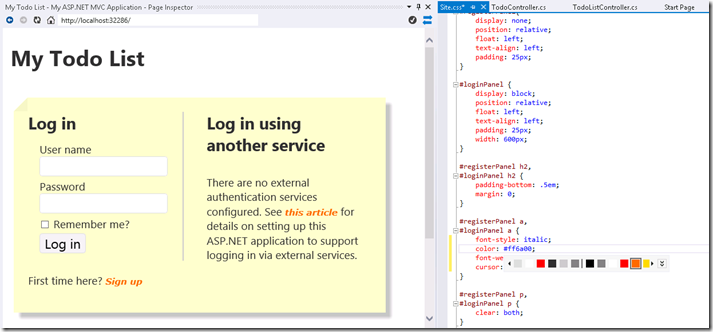
With this release, Page Inspector now has a new CSS Auto-Sync feature that allows you to edit the CSS file directly and as you type, the changes will get automatically sync-ed back to the Page Inspector browser. For example, I can add a new property font-style: italic in the CSS file and you can see that the Page Inspector browser immediately reflects the change to the ‘Sign Up’ link (see figure 3). I can also change the color of the link and by typing color: #, the CSS color picker gets invoked and as I try out different colors in the color picker, those get immediately pushed to the browser. (Note: With the RC, to notice the change in color, you might need to click once on the browser to clear selection. This will get fixed for the RTM release and we will automatically clear selection.)
Note that there’s a new icon with two blue arrows at the top right corner of the Page Inspector tool window. This new icon serves as a visual indicator that CSS Auto-Sync is working correctly and that the page you are viewing is in-sync with your CSS file.
Figure 3 – CSS Auto-Sync causes edits in your CSS file to get automatically sync-ed to the Page Inspector browser
Thus, you can now leverage the full power of the CSS editor to make changes in your CSS file and be able to immediately view changes in Page Inspector. If you have used Page Inspector in the past, you might be familiar with the Ctrl-Alt-Enter shortcut, and you can still use that at any time when editing the CSS file. Hitting Ctrl-Alt-Enter will cause any unsaved changes to get saved and refresh the page in the Page Inspector browser.
The CSS Auto-Sync feature is supported only when editing CSS files at the moment and is not supported when editing style blocks and style attributes (inline styles).
JavaScript Selection Mapping
With this release, Page Inspector now has the capability to map items that were dynamically added to the page back to the corresponding JS code. Continuing with our example SPA application above, let’s go ahead and sign-up for a new user. Once you sign-up, the application logs you in and creates a to-do list with a couple of sample items.
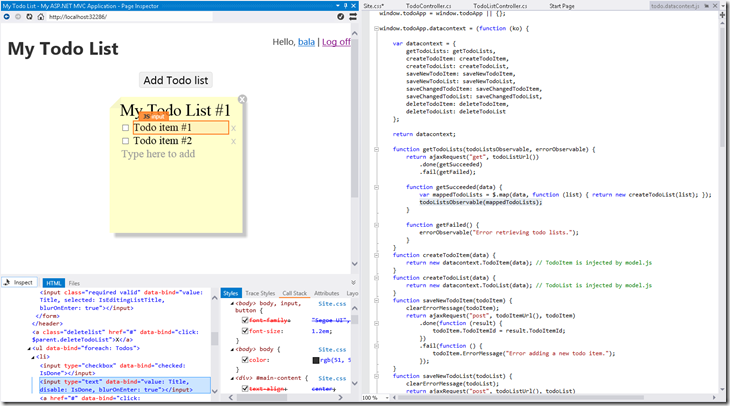
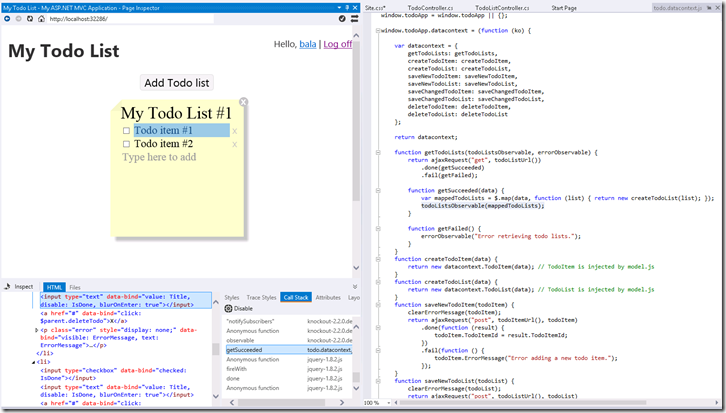
If you now switch to ‘Inspect’ mode in the Page Inspector browser and inspect the elements inside the to-do list, you will notice that the feedback in the Page Inspector browser is now in orange with “JS” next to the element name (see figure 4). The new ‘Call Stack’ pane lights up with an orange underline to indicate that a call stack is available for this element, and the source code selection mapping takes you to the line of JS user code that created the element. This happens because Page Inspector detected the item was dynamically added to the DOM using JavaScript.
Figure 4 – JavaScript Selection Mapping for dynamically created elements
JS Call Stack –
You can click on the item in the Page Inspector browser, and switch to the Call Stack pane and Page Inspector will show you the call stack for how that element was created, containing JS calls from both user code and library code (grayed-out). You can use arrow keys to navigate up and down the call stack pane and see the corresponding line of JS source show up in the editor.
While the source code selection mapping takes you to the topmost call in the call stack coming from user code, when you first switch to the call stack pane, you might notice that corresponding item is not selected in the Call Stack pane. This should get fixed for the RTM release. For the RTM release, we are also considering other improvements to the Call Stack pane such as adding the ability to hide and/or collapse the calls made through library code.
Figure 5 – Call Stack pane
– Bala Chirtsabesan.

0 comments