
Thank you Sergey Kanzhelev for the support and review of this ASP.NET Core Apps Observability article.
Modern software development practices value quick and continuous updates, following processes that minimize the impact of software failures. As important as identifying bugs early, finding out if changes are improving business value are equally important. These practices can only work when a monitoring solution is in place. This article explores options for adding observability to .NET Core apps. They have been collected based on interactions with customers using .NET Core in different environments. We will be looking into OpenTelemetry and Application Insights SDKs to add observability to a sample distributed application.
Observability Basics
Identifying software error and business impact require a monitoring solution with the ability to observe and report how the system and users behave. The collected data must provide the required information to analyze and identify a bad update. Answering questions such as:
- Are we observing more errors than before?
- Were there new error types?
- Did the request duration unexpectedly increase compared to previous versions?
- Has the throughput (req/sec) decreased?
- Has the CPU and/or Memory usage increased?
- Were there changes in our KPIs?
- Is it selling less than before?
- Did our visitor count decrease?
The impact of a bad system update can be minimized by combining the monitoring information with progressive deployment strategies. Such as canary, mirroring, rings, blue/green, etc.
Observability is Built on 3 Pillars:
-
Logging: collects information about events happening in the system. Helping the team analyze unexpected application behavior. Searching through the logs of suspect services can provide the necessary hint to identify the problem root cause. Such as: service throwing out of memory exceptions and app configuration not reflecting expected values. As well as calls to external service with incorrect address, calls to external service returns with unexpected results, and incoming requests with unexpected input.
-
Tracing: collects information to create an end-to-end view of how transactions are executed in a distributed system. A trace is like a stack trace spanning multiple applications. Once a problem has been recognized, traces are a good starting point in identifying the source in distributed operations. Like calls from service A to B are taking longer than normal, service payment calls are failing, etc.
-
Metrics: provide a real-time indication of how the system is running. It can be leveraged to build alerts, allowing proactive reactance to unexpected values. As opposed to logs and traces, the amount of data collected using metrics remains constant as the system load increases. Application problems are often first detected through abnormal metric values. Such as CPU usage being higher than before, payment error count spiking, and queued item count keeps growing.
Adding Observability to a .NET Core Application
There are many ways to add observability aspects to an application. Dapr for example, is a runtime to build distributed applications, transparently adding distribute tracing. Another example is through the usage of service meshes in Kubernetes (Istio, Linkerd).
Built-in and transparent tracing are typically covering basic scenarios and answering generic questions, such as observed request duration or CPU trends. Other questions, such as custom KPIs or user behavior, require adding instrumentation to your code.
To illustrate how observability can be added to a .NET Core application we will be using the following asynchronous distributed transaction example:

- Main Api receives a request from a “source”.
- Main Api enriches the request body with current day, obtained from Time Api.
- Main Api enqueues enriched request to a RabbitMQ queue for asynchronous processing.
- RabbitMQProcessor dequeues request.
- RabbitMQProcessor, as part of the request processing, calls Time Api to get dbtime.
- Time Api calls SQL Server to get current time.
To run the sample application locally (including dependencies and observability tools), follow this guide. The article will walkthrough adding each observability pillar (logging, tracing, metrics) into the sample asynchronous distributed transaction.
Note: for information on bootstrapping OpenTelemetry or Application Insights SDK please refer to the documentation: OpenTelemetry and Application Insights.
Logging
Logging was redesigned in .NET Core, bringing an integrated and extensible API. Built-in and external logging providers allow the collection of logs in multiple formats and targets. When deciding a logging platform, consider the following features:
- Centralized: allowing the collection/storage of all system logs in a central location.
- Structured logging: allows you to add searchable metadata to logs.
- Searchable: allows searching by multiple criteria (app version, date, category, level, text, metadata, etc.)
- Configurable: allows changing verbosity without code changes (based on log level and/or scope).
- Integrated: integrated into tracing, facilitating analysis of traces and logs in the same tool.
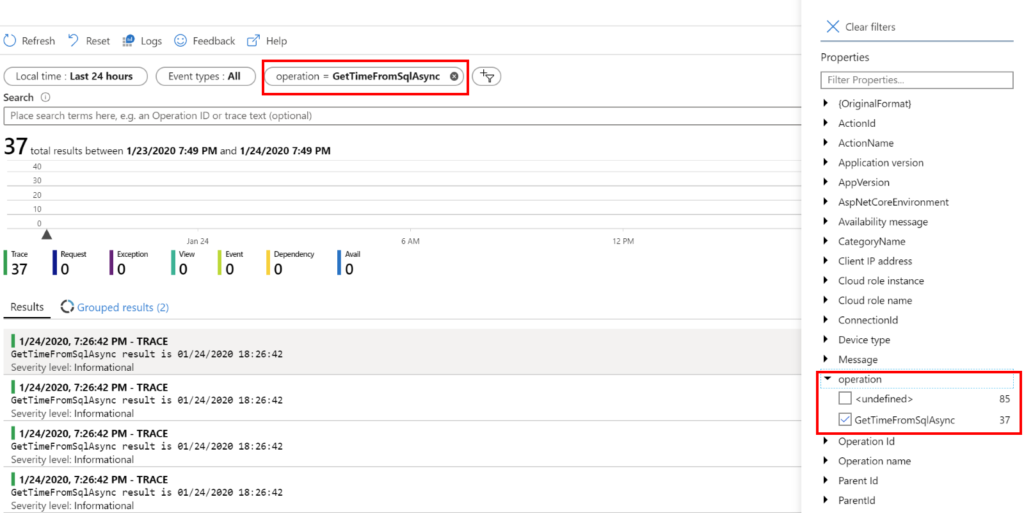
The sample application uses the ILogger interface for logging. The snippet below demonstrates an example of structure logging. Which captures events using message template and generates information that is human and machine readable.
var result = await repository.GetTimeFromSqlAsync();
logger.LogInformation("{operation} result is {result}", nameof(repository.GetTimeFromSqlAsync), result);
When using a logging backend that understands structured logs, such as Application Insights, search instances of the example log items where “operation” is equal to “GetTimeForSqlAsync”:
Tracing
Tracing collects required information to enable the observation of a transaction as it “walks” through the system. It must be implemented in every service taking part of the transaction to be effective.
.NET Core defines a common way in which traces can be defined through the System.Diagnostics.Activity class. Through the usage of this class, dependency implementations (i.e. HTTP, SQL, Azure, EF Core, StackExchange.Redis, etc.) can create traces in a neutral way, independent of the monitoring tool used.
It is important to notice that those activities will not be available automatically in a monitoring system. Publishing them is responsibility of the monitoring SDK used. Typically, SDKs have built-in collectors to common activities, transferring them to the destination platform automatically.
In the last quarter of 2019 OpenTelemetry was announced, promising to standardize telemetry instrumentation and collection across languages and tools. Before OpenTelemetry (or its predecessors OpenCensus and OpenTracing), adding observability would often mean adding proprietary SDKs (in)directly to the code base.
The OpenTelemetry .NET SDK is currently in alpha. The Azure Monitor Application Insights team is investing in OpenTelemetry as a next step of Azure Monitor SDKs evolution.
Quick Intro on Tracing with OpenTelemetry
In a nutshell, OpenTelemetry collects traces using spans. A span delimits an operation (HTTP request processing, dependency call). It contains start and end time (among other properties). It has a unique identifier (SpanId, 16 characters, 8 bytes) and a trace identifier (TraceId, 32 characters, 16 bytes). The trace identifier is used to correlate all spans for a given transaction. A span can contain children spans (as calls in a stack trace). If you are familiar with Azure Application Insights, the following table might be helpful to understand OpenTelemetry terms:
| Application Insights | OpenTelemetry |
| Request, PageView | Span with span.kind = server |
| Dependency | Span with span.kind = client |
| Id of Request and Dependency | SpanId |
| Operation_Id | TraceId |
| Operation_ParentId | ParentId |
Adding Tracing to a .NET Core Application
As mentioned previously, an SDK is needed in order to collect and publish distributed tracing in a .NET Core application. Application Insights SDK sends traces to its centralized database while OpenTelemetry supports multiple exporters (including Application Insights). When configured to use OpenTelemetry, the sample application sends traces to a Jaeger instance.
In the asynchronous distributed transaction scenario, track the following operations:
HTTP Requests between microservices
HTTP correlation propagation is part of both SDKs. With the only requirement of setting activity id format to W3C at application start:
public static void Main(string[] args)
{
    Activity.DefaultIdFormat = ActivityIdFormat.W3C;
    Activity.ForceDefaultIdFormat = true;
    // rest is omitted
}
Dependency calls (SQL, RabbitMQ)
Unlike Application Insights SDK, OpenTelemetry (in early alpha) does not yet have support for SQL Server trace collection. A simple way to track dependencies with OpenTelemetry is to wrap the call like the following example:
var span = this.tracer.StartSpan("My external dependency", SpanKind.Client);
try
{
    return CallToMyDependency();
}
catch (Exception ex)
{
    span.Status = Status.Internal.WithDescription(ex.ToString());
    throw;
}
finally
{
    span.End();
}
Asynchronous Processing / Queued Items
There is no built-in trace correlation between publishing and processing a RabbitMQ message. Custom code is required, creating the publishing activity (optional) and referencing the parent trace during the item dequeuing.
We covered previously creating traces by wrapping the dependency call. This option allows expressing additional semantic information such as links between spans for batching and other fan-in patterns. Another option is to use System.Diagnostics.Activity, which is a SDK independent way to create traces. This option has limited set of features, however, is built-in into .NET.
These two options work well with each other and .NET team is working on making .NET Activity and OpenTelemetry spans integration better.
Creating an Operation Trace
The snippet below demonstrates how the publish operation trace can be created. It adds the trace information to the enqueued message header, which will later be used to link both operations.
Activity activity = null;
if (diagnosticSource.IsEnabled("Sample.RabbitMQ"))
{
    // Generates the Publishing to RabbitMQ trace
    // Only generated if there is an actual listener
    activity = new Activity("Publish to RabbitMQ");
    diagnosticSource.StartActivity(activity, null);
}

// Add current activity identifier to the RabbitMQ message
basicProperties.Headers.Add("traceparent", Activity.Current.Id);

channel.BasicPublish(...)

if (activity != null)
{
     // Signal the end of the activity
     diagnosticSource.StopActivity(activity, null);
}
A collector, which subscribes to target activities, is required to publish the trace to a backend. Implementing a collector is not a straightforward task and is intended to be used by SDK implementors. The snippet below is taken from the sample application, where a simplified and not production-ready, RabbitMQ collector for OpenTelemetry was implemented:
public class RabbitMQListener : ListenerHandler
{
    public override void OnStartActivity(Activity activity, object payload)
    {
            var span = this.Tracer.StartSpanFromActivity(activity.OperationName, activity);
            foreach (var kv in activity.Tags)
                span.SetAttribute(kv.Key, kv.Value);
    }

    public override void OnStopActivity(Activity activity, object payload)
    {
        var span = this.Tracer.CurrentSpan;
        span.End();
        if (span is IDisposable disposableSpan)
        {
            disposableSpan.Dispose();
        }
    }
}

var subscriber = new DiagnosticSourceSubscriber(new RabbitMQListener("Sample.RabbitMQ", tracer), DefaultFilter);
subscriber.Subscribe();
For more information on how to build collectors, please refer to OpenTelemetry/Application Insights built-in collectors as well as this user guide.
Activity
As mentioned, HTTP requests in ASP.NET have built-in activity correlation injected by the framework. That is not the case for the RabbitMQ consumer. In order to continue the distributed transaction, we must create the span referencing the parent trace. This was injected into the message by the publisher. The snippet below uses an extension method to build the activity:
public static Activity ExtractActivity(this BasicDeliverEventArgs source, string name)
{
    var activity = new Activity(name ?? Constants.RabbitMQMessageActivityName);

    if (source.BasicProperties.Headers.TryGetValue("traceparent", out var rawTraceParent) && rawTraceParent is byte[] binRawTraceParent)
    {
        activity.SetParentId(Encoding.UTF8.GetString(binRawTraceParent));
    }

    return activity;
}
The activity is then used to create the concrete trace. In OpenTelemetry the code looks like this:
// Note: OpenTelemetry requires the activity to be started
activity.Start();
tracer.StartActiveSpanFromActivity(activity.OperationName, activity, SpanKind.Consumer, out span);
Using Applications Insights
The snippet below creates the telemetry using Application Insights SDK:
// Note: Application Insights will start the activity
var operation = telemetryClient.StartOperation<Dependencytelemetry>(activity);
The usage of activities gives flexibility in terms of SDK used, as it is a neutral way to create traces. Once instrumented the distributed end-to-end transaction in Jaeger looks like this:

The same transaction in Application Insights looks like this:
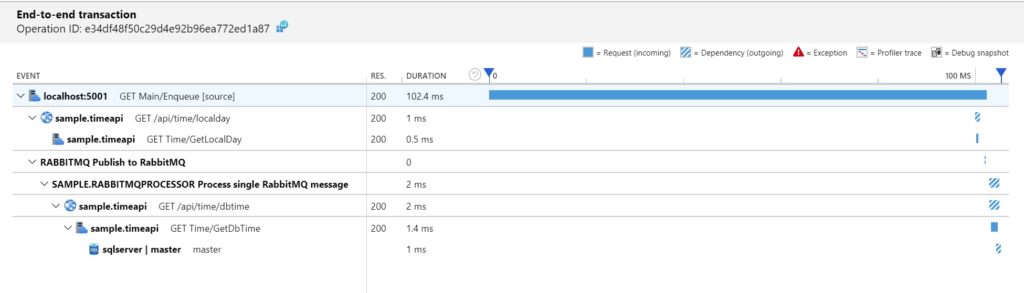
When using single monitoring solution for traces and logs, such as Application Insights, the logs become part of the end-to-end transaction:

Metrics
There are common metrics applicable to most applications, like CPU usage, allocated memory, and request time. As well as business specific like visitors, page views, sold items, and sent items. Exposing business metrics in a .NET Core application typically requires using an SDK.
Collection metrics in .NET Core happens through 3rd-party SDKs which aggregate values locally, before sending to a backend. Most libraries have built-in collection for common application metrics. However, business specific metrics need to be built in the application logic, since they are created based on events that occur in the application domain.
In the sample application we are using metric counters for: enqueued items, successfully processed items and unsuccessfully processed items. The implementation in both SDKs is similar, requiring setting up a metric, dimensions and finally, tracking the counter values.
OpenTelemetry supports multiple exporters and we will be using Prometheus exporter. Prometheus combined with Grafana, for visualization and alerting, is a popular choice for open source monitoring. Application Insights supports metrics as any other instrumentation type, requiring no additional SDK or tool.
Defining a metric and tracking values using OpenTelemetry looks like this:
// Create counter
var simpleProcessor = new UngroupedBatcher(exporter, TimeSpan.FromSeconds(5));
var meterFactory = MeterFactory.Create(simpleProcessor);
var meter = meterFactory.GetMeter("Sample App");
var enqueuedCounter = meter.CreateInt64Counter("Enqueued Item");

// Incrementing counter for specific source
var labelSet = new Dictionary<string, string>()
                {
                    { "Source", source }
                };
enqueuedCounter.Add(context, 1L, this.meter.GetLabelSet(labelSet));
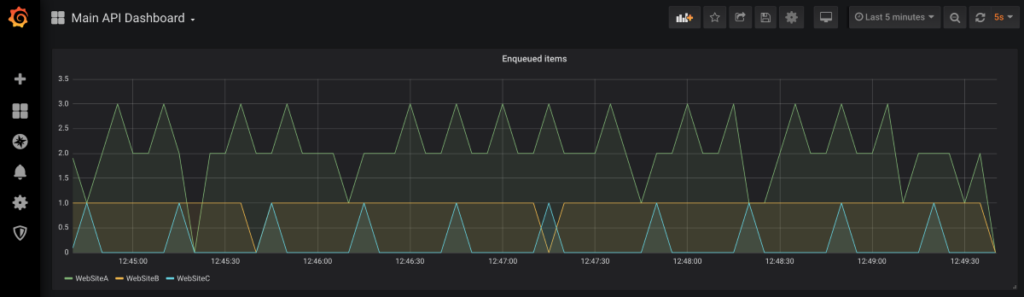
The visualization with Grafana is illustrated in the image below:
The snippet below demonstrates how to define a metric and track its values using the Application Insights SDK:
// create counter
var enqueuedCounter = telemetryClient.GetMetric(new MetricIdentifier("Sample App", "Enqueued Item", "Source"));

// Incrementing counter for specific source
enqueuedCounter.TrackValue(metricValue, source);
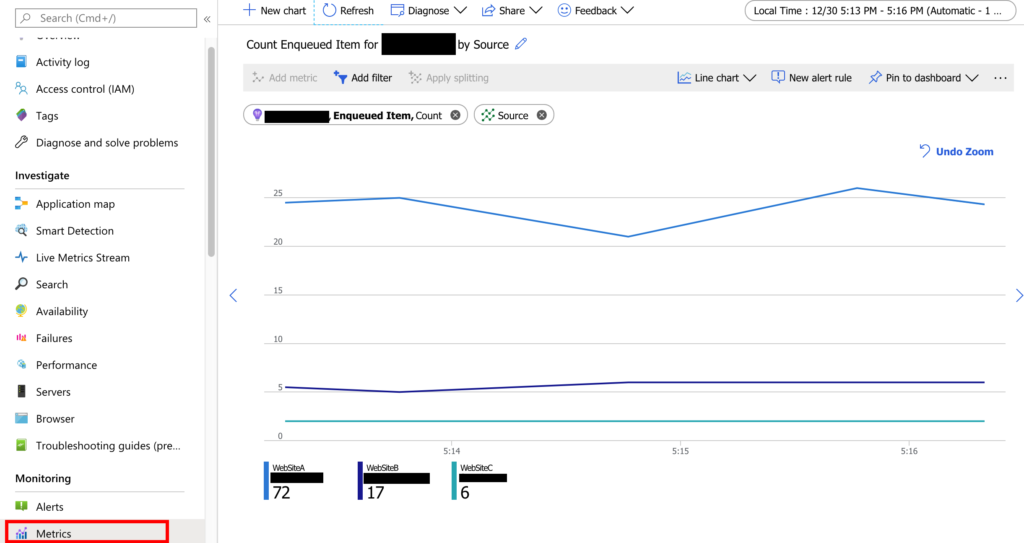
The visualization in Application Insights is illustrated below:
Troubleshooting
Now that we have added the 3 observability pillars to a sample application, let’s use them to troubleshoot a scenario where the application is experiencing problems.
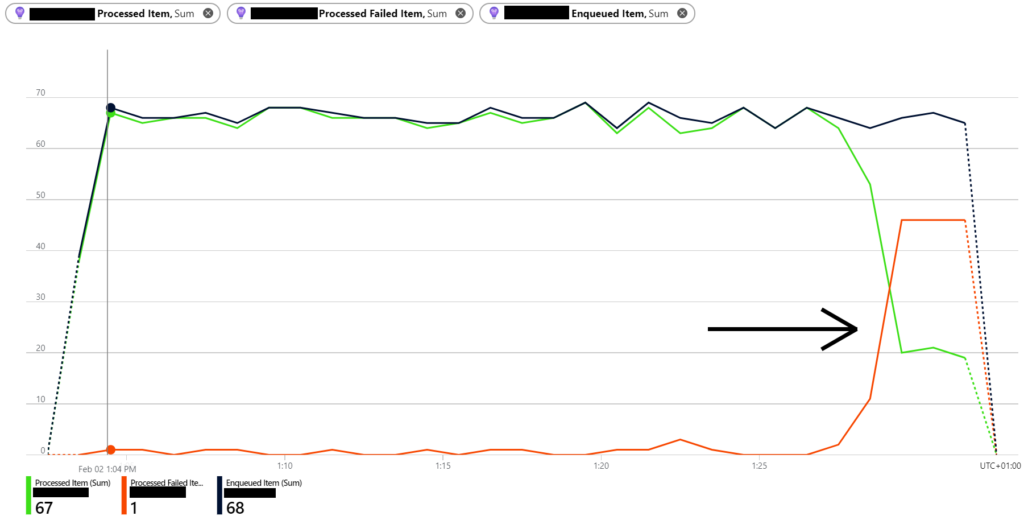
The first signals of an application problems are usually detected by anomalies in metrics. The snapshot below illustrates such a scenario, where the number of failed processed items spikes (red line).
A possible next step is to look for hints in distributed traces. This should help us identify where the problem is happening. In Jaeger, searching with the tag “error=true” filters the results, listing transaction where at least one error happened.

In Application Insights, we can search for errors in end-to-end transactions by looking in the Failures/Dependencies or Failures/Exceptions.


The problem seems to be related to the Sample.RabbitMQProcessor service. Logs of this service can help us identify the problem. When using Application Insights logging provider, log and traces are correlated, being displayed in the same view:

Looking at the details, we discover that the exception InvalidEventNameException is being raised. Since we are logging the message payload, details of the failed message are available in the monitoring tool. It appears the message being processed has the eventName value of “error”, which is causing the exception to be raised.
Wrapping Up Observability with .NET Core
When introducing observability into a .NET Core application, two decisions need to be taken:
- The backend(s) where collected data will be stored and analyzed.
- How instrumentation will be added to the application code.
Depending on your organization, the monitoring tool might already be selected. However, if you do have the chance to make this decision, consider the following:
- Centralized: having all data in a single place makes it simple to correlate information. For example, logs, distribute traces and CPU usage. If they are split, more effort is required.
- Manageability: how simple is to manage the monitoring tool? Is it hosted in the same machines/VMs where your application is running? In that case, shared infrastructure unavailability might leave you in the dark. When monitoring is not working, alerts won’t be triggered and metrics won’t be collected.
- Vendor Locking: if you need to run the same application in different environments (i.e. on premises and cloud), choosing a solution that can run everywhere might be favored.
- Application Dependencies: parts of your infrastructure or tooling that might require you to use a specific monitoring vendor. For example, Kubernetes scaling and/or progressive deployment based on Prometheus metrics.
Once the monitoring tool has been defined, choosing an SDK is limited to two options. Using the one provided by the monitoring vendor or a library capable of integrating to multiple backends.
Vendor SDKs typically yield little/no surprises regarding stability and functionality. That is the case with Application Insights, for example. It is stable with a rich feature set, including live stream, which is a feature-specific to this specific monitoring system.
OpenTelemetry
Using OpenTelemetry SDK gives you more flexibility, offering integration with multiple monitoring backends. You can even mesh them: a centralized monitoring solution for all collected data, while having a subset sent to Prometheus to fulfill a requirement. If you are unsure whether OpenTelemetry is a good fit for your project, consider the following:
- When is your project going to production? The SDK is currently in alpha, meaning breaking changes and non-production-ready is expected.
- Are you using vendor specific features not yet available through the OpenTelemetry SDK (specific collectors, etc.)?
- Is your monitoring backend supported by the SDK?
- Are you replacing a vendor SDK with OpenTelemetry? Plan some time to compare both SDKs, OpenTelemetry exporters might have differences compared to how the vendor SDK collects data.
Source code with the sample application can be found in this GitHub Repository.
It was really great. Thank you
https://sirooz.com/
That’s really good
https://sanjamusics.ir/
Also:
https://developercommunity.visualstudio.com/idea/595756/fix-your-blog.html
From reading the comments from the developers of this blog, they could stand to read this article, in particular, a few times
Some of the comments are simply striking, to put it politely.
For instance, it's been nearly nine months since long load times have been reported on this blog and they still have not been adequately resolved. It would seem some good old fashioned observability and some basic tracing could stand to improve the experience. Perhaps a follow-on post on exploring this very topic with your very own blog might be a good next post in this series.
What an amazing and valuable article! Thank you for putting the time in putting it together. Especially so that I am now actively developing my first .NET Core 3.1 application that I intend on publicly publishing for consumption and use.
The aspect that strikes me that's quite remarkable is that there really isn't a unified story here for these three pillars. That is, you would think that this story would be one of the first APIs completed and available with .NET Core, considering how critical it is to operations.
In any case, thank you for publishing this. I...