
Diagnosing Errors on your Cloud Apps
One of the most frustrating experiences is when you have your app working on your local machine, but when you publish it it’s inexplicably failing. Fortunately, Visual Studio provides handy features for working with apps running in Azure. In this blog I’ll show you how to leverage the capabilities of Cloud Explorer to diagnose issues in Azure. If you’re interested in developing apps in the cloud, we’d love to hear from you. Please take a minute to complete our one question survey.
Prerequisites – If you want to follow along, you’ll need
Visual Studio 2017 with Azure development workload installed. – This blog assumes you have an Azure subscription and have an App running in Azure App Services. If you don’t have an Azure subscription, click here to sign up for free credits. – For the purposes of this blog, we’ve developed a simple one-page web app. The source is available here.
Open the solution If you have your app running on Azure, open the solution in Visual Studio. Alternatively,
clone the source for the sample app and open it in Visual Studio. Publish the app to Microsoft Azure App Services.
Connect to your Azure subscription with Cloud Explorer Cloud Explorer is a powerful tool that ships with the Azure development workload in Visual Studio 2017. We can use Cloud Explorer to view and interact with the resources in our Azure subscription. To view your Azure resources in Cloud Explorer, enable the subscription in the Account Manager tab. – Open
Cloud Explorer (View -> Cloud Explorer) – Press the Account Management button in the Cloud Explorer toolbar. – Choose the Azure subscription that you are working with, then press Apply.  Your Azure subscription now appears in the Cloud Explorer. You can toggle the grouping of elements by Resource Groups or Resource Types using the drop-down selector at the top of the window.
View Streaming Logs When I ran my app after publishing, there was an error. The error message shown on the web page was not very descriptive. So what can I do? How can I get more information about what’s going wrong? One easy way to diagnose issues on the server is to inspect the application logs. Using Cloud Explorer, you can access the streaming logs of any App Service in your subscription. The streaming logs output a concatenation of all the application logs saved on the App Service. The default log level is “Error”. To
view streaming logs for your application running on Azure App Services: – Expand the subscription node and select your App Service. – Click View Streaming Logs in the Actions panel. 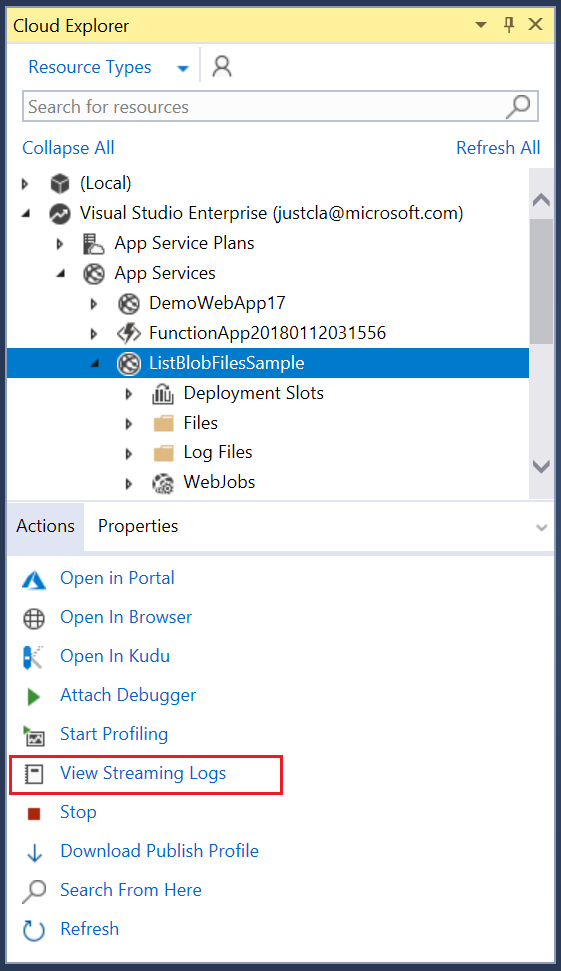 The Output window opens with a new log stream from the App Service running on the cloud. – If you’re using the sample app, refresh the page in the web browser and wait for the page to complete rendering. This might take ten seconds or more, as the server waits for the fetch operation to time out before returning the result. You can read the log messages to see what’s happening on the server.
  If you switch to Verbose output logging, you see a lot more.
  Notice the [Error] that appears in the streaming logs: “Exception occurred while attempting to list files on server.” It doesn’t tell us much, but at least now we can start looking in the ListBlobFiles.StorageHelper for clues. We know it works locally, so we’ll need to debug the version running on the cloud to see why it’s failing. For that, we need remote debugging. Once again, Cloud Explorer to the rescue!
Remote Debugging App Service running on Azure Using Cloud Explorer, you can attach a remote debugger to applications running on Azure. This lets you control the flow of execution by breaking and stepping through the code. It also provides an opportunity to view the value of variables and method returns by utilizing Visual Studio’s debugger tooltips, autos, watches, call stack and other diagnostic tools.
Publish a Debug version of the Web App Before you can attach a debugger to an application on Azure, there must be a debug version of the code running on the App Service. So, we’ll re-publish the app with Debug release configuration. Then we’ll attach a remote debugger to the app running in the cloud, set breakpoints and step through the code. • Open the publish summary page (Right-click project, choose “Publish…”) • Select (or create) the publish profile for your web app • Click
Settings • When the settings dialog opens, go to the Settings tab. • In the Configurations drop-down, select “Debug”. • Save the publish profile settings. • Press **Publish **to republish the web app 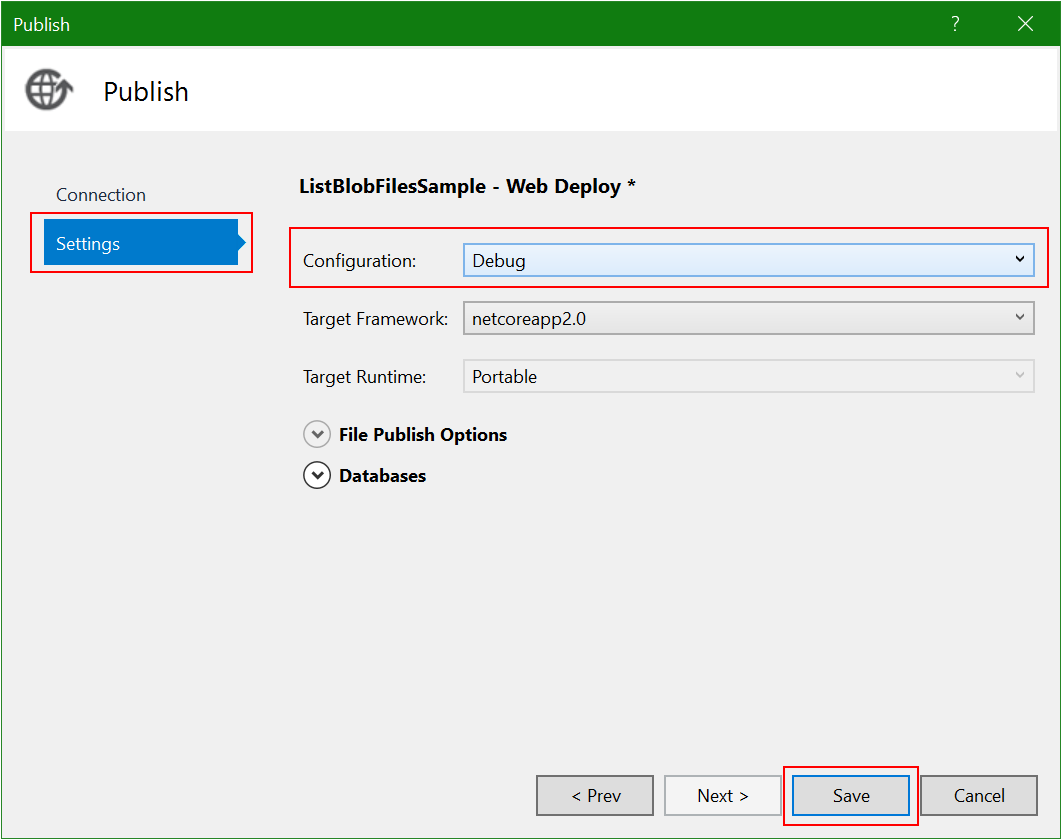
Attach Remote Debugger You can attach a remote debugger to allow you to step through the code that’s running on your Azure App Service. This lets you see the values of variables and watch the flow of control in your app. To
attach a remote debugger: • In the Cloud Explorer, select the web app. • Click Attach Debugger in the Actions panel. Visual Studio will switch over to Debug mode. Now you can set breakpoints in the code and watch the execution as the program runs.
Set breakpoint and execute the code If you’re following along from the sample, try this: • Set breakpoints in the
GetBlobFileListAsync() method of the StorageHelper.cs • Refresh the page in the web browser • Execution will stop at your first breakpoint. • Hover your mouse cursor over the _storageConnectionString variable and inspect its value. • Notice that the connection string is “UseDevelopmentStorage=true”. 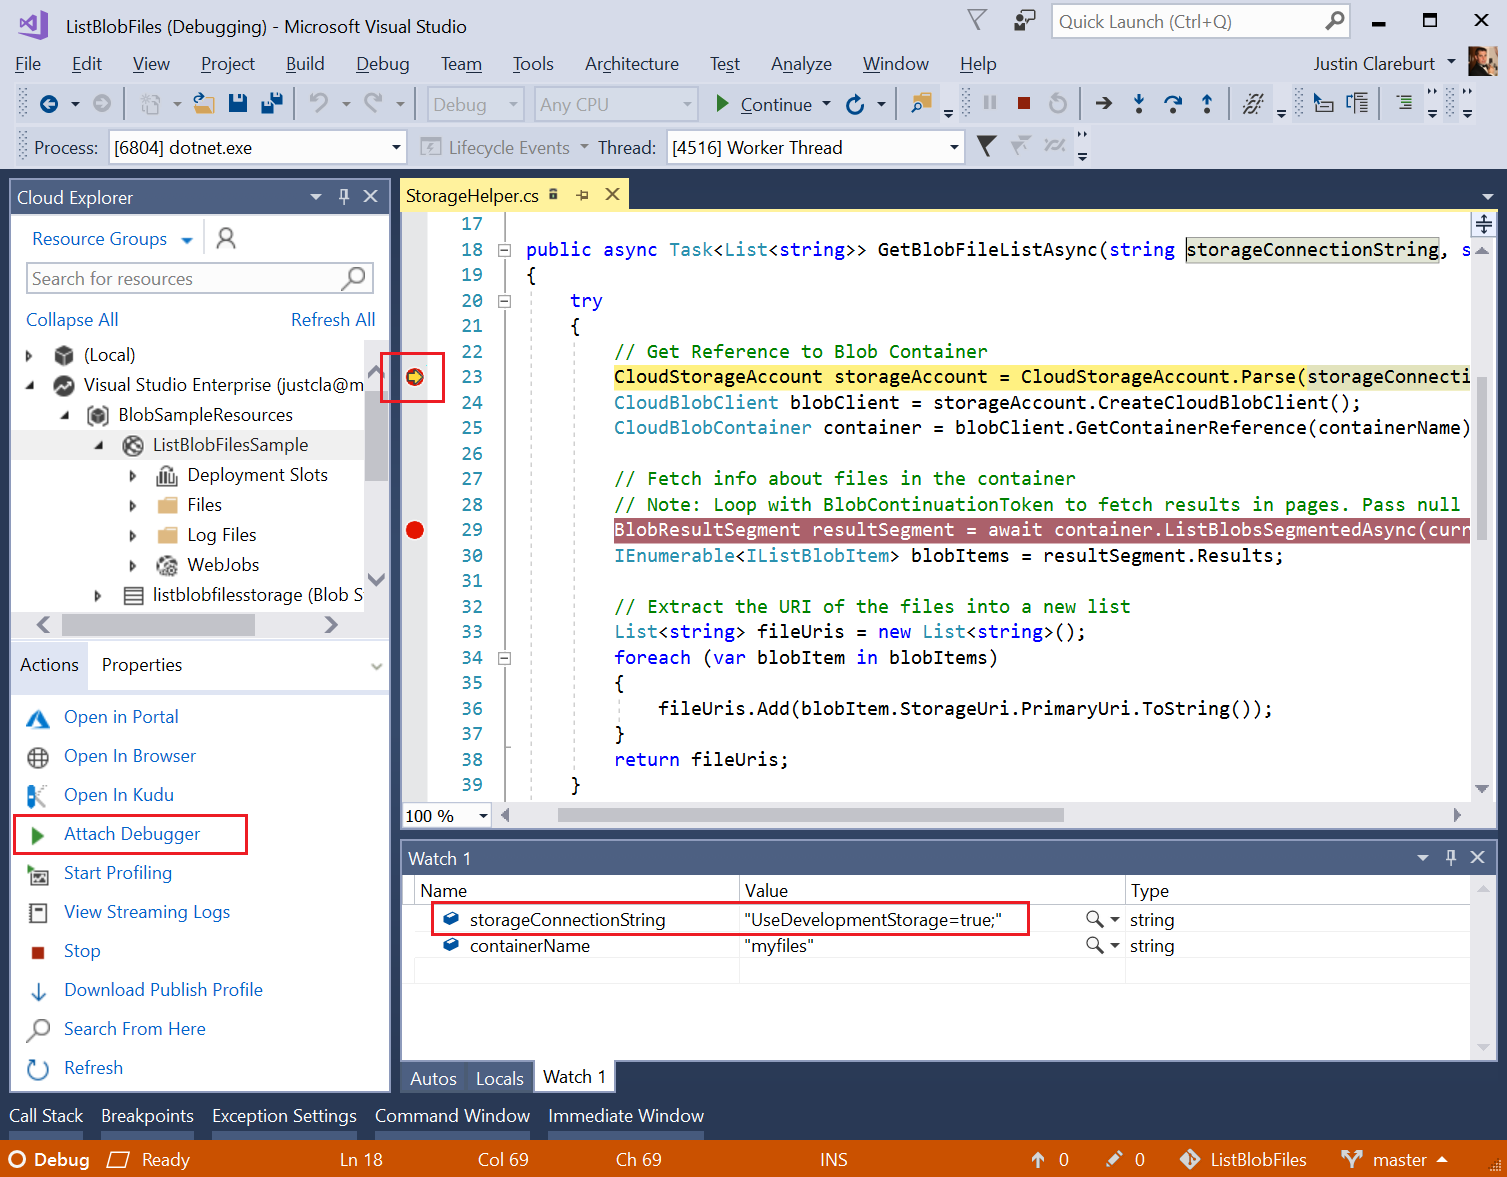 Problem found! We’re referencing our local Storage (“UseDevelopmentStorge=true”), which won’t work in the cloud. To fix it, we’ll need to provide a connection string to the app running in the cloud that points to our Blob storage container. Complete the debugging session. – Press F5 to allow the request to complete. – Then press Shift+F5 to stop the remote debugging session.
Next steps
Re-publish with Release configuration Once you’ve finished debugging and your app is working as expected, you can republish a Release version of the app for better performance. Go to the Publish page, find the Publish Profile, select “Settings…” and change the configuration to “Release”.
Related Links Get started with Azure Blob storage using .NET
https://docs.microsoft.com/en-us/azure/storage/blobs/storage-dotnet-how-to-use-blobs Use the Azure Storage Emulator for development and testing https://docs.microsoft.com/en-us/azure/storage/common/storage-use-emulator Introduction to Razor Pages in ASP.NET Core https://docs.microsoft.com/en-us/aspnet/core/mvc/razor-pages/?tabs=visual-studio ASP.NET Core – Simpler ASP.NET MVC Apps with Razor Pages MSDN Magazine article by Steve Smith https://msdn.microsoft.com/en-us/magazine/mt842512.aspx Upload image data in the cloud with Azure Storage https://docs.microsoft.com/en-us/azure/storage/blobs/storage-upload-process-images Azure Blob Storage Samples for .NET https://github.com/Azure-Samples/storage-blob-dotnet-getting-started
 Light
Light Dark
Dark
0 comments