
Today we released PIX version 2310.30, which can be downloaded here. We also released WinPixEventRuntime version 2310.30, which can be downloaded here.
This release includes many new features and improvements along several key themes:
- Improving PIX’s performance.
- Adding new raytracing features.
- Miscellaneous changes in direct response to feedback from users.
Thank you for all of your feedback and suggestions, and please them coming! The best ways to contact us are via the “Send Feedback” button in PIX and via the #pix channel on the DirectX Discord.
This release includes:
GPU Captures (misc features)
- Major PIX Performance Improvements
- Revamped NVIDIA Plugin
- Updated AMD Plugin
- Better DRED Integration and Collection
- New Texture Diff Visualizers
- New “Take Capture” hotkeys (tl;dr: F11 now takes a GPU Capture!)
GPU Captures (raytracing features)
- Hit and Miss Shader Debugging
- Acceleration Structure Hierarchy Tree
- DXR 1.0 Invocations View
- DXR 1.0 Ray Visualization
Timing Captures
- Circular Timing Captures
- Capture Summary and Metadata
- More D3D Object Types
- Import and Export of Timing Capture UI Configurations
- Metrics View Consolidated Events Editor
- Sampled Functions Flamegraph
- Enhanced Comparison Features
- New Checklist View
- Improved Idle Time Display in Core Lanes
- Other Metrics View Improvements
WinPixEventRuntime
And some bug fixes and other improvements.
GPU Captures (misc features)
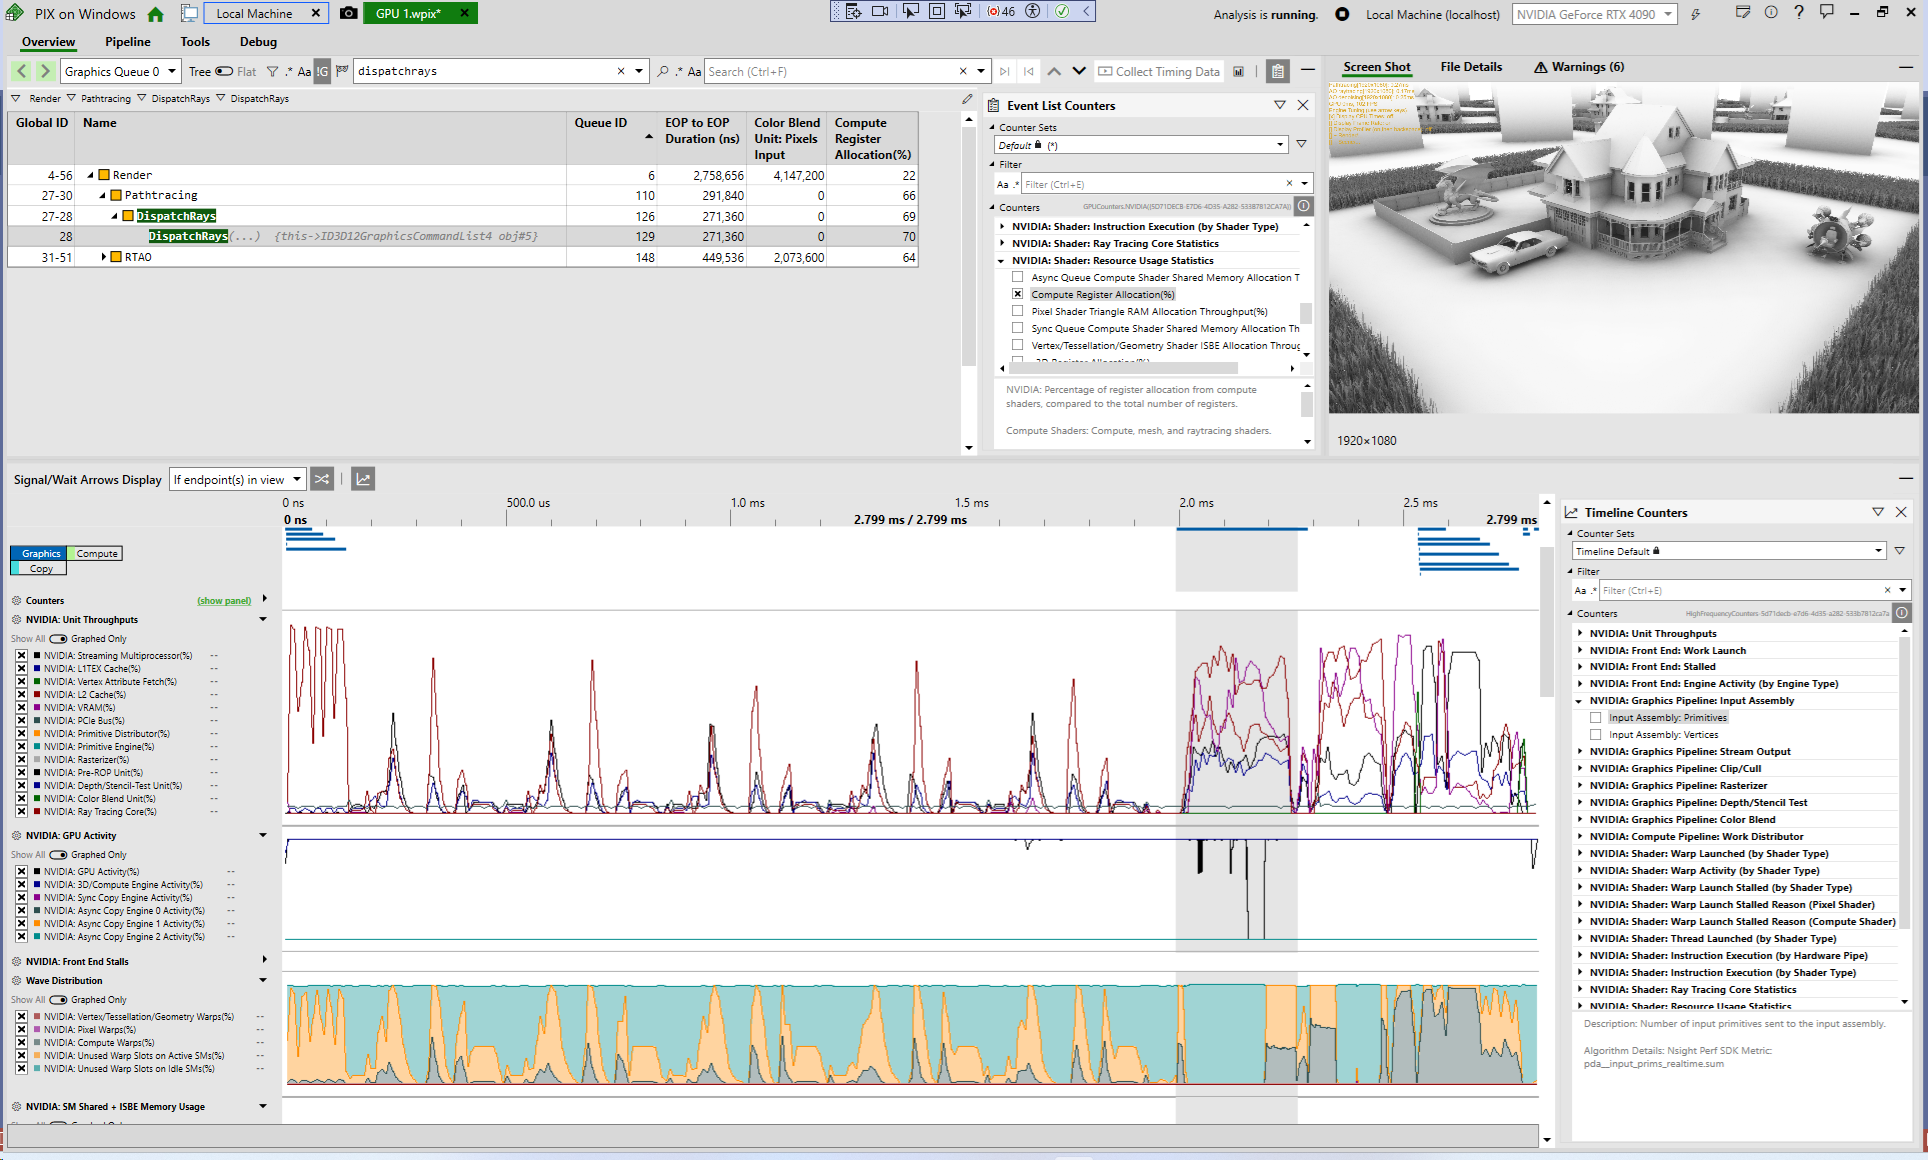
Major PIX Performance Improvements
The Pipeline tab should now be much (much!) faster than previous PIX releases. We hope this will greatly improve PIX usability and dev iteration times.
Some of the biggest improvements we’ve seen are for AAA raytracing games. For two famous games the Pipeline tab used to take several hours to populate for DispatchRays() events. With today’s PIX release, a lot of the tab is available within 5 secs of opening the capture file. The remainder is typically accessible less than 30 secs after starting analysis.
As another example, with a famous game engine sample it used to take ~6 minutes to start analysis and view the backbuffer contents. It now takes 20 seconds.
Here are the specific improvements:
- A lot of information is available before starting analysis.
- This includes the resources bound to each GPU event, the API objects view, the command list state view, the descriptor heaps view, the shader table viewer, the resources view, and the resource history view.
- These all load within seconds of opening the capture file.
- After starting analysis, the Pipeline tab is now far faster to populate.
- Shader Access Tracking is now an optional feature.
- The feature lets PIX tell you exactly which resources were accessed by a particular GPU event, but it’s susceptible to issues in PIX and other components.
- To optionally collect this information, click on the “Gather Accessed Resources” button.
- Side note: you should never have to set the “DisableShaderAccessTracking” regkey again!
- PDB resolution is significantly faster.
- NVIDIA plugin initialization + counter collection is faster (see NVIDIA plugin section below).
- Relatedly we have also made significant improvements to UI performance, e.g. scrolling speed and responsiveness.
Since a lot of information is available before starting analysis now (i.e. before PIX creates a D3D12 device), that information is accessible even if the original application TDRed. We have started to make use of this today by adding deeper DRED integration, but we will continue to add new functionality in this area in the future. Stay tuned!
Some parts of PIX continue to be slower than we would like, such as starting analysis, collecting timing information, viewing the Pipeline tab while using certain D3D12 APIs (e.g. AddToStateObject), and shader debugging. We expect to make significant improvements to these areas in future PIX releases.
Revamped NVIDIA plugin
The NVIDIA plugin has been almost completely rewritten to significantly improve performance and usability. Many thanks to our partners at NVIDIA for making this happen! Improvements include:
- Counter group reorganization
- Transitioned from hardware unit-based organization to a logical graphics pipeline-based structure.
- Improved counter names and descriptions.
- Redefined names and descriptions for over 140 key counters, emphasizing clarity and user-friendliness. Hardware terms are now either explained inline or through the updated description system.
- Expanded counter graphs:
- Introduced 3x more counter graphs, covering from high-level unit throughput to detailed insights on SM resource or cache usage.
- Performance improvements
- Greatly reduced plugin initialization time.
- Introduced dynamic counter groupings based on hardware profiling capacity, leading to fewer collection passes, enhancing both efficiency and accuracy.
Updated AMD Plugin
The new AMD plugin includes many improvements and fixes. Many thanks to our partners at AMD for the update! The new plugin:
- Adds support for AMD Radeon RX 7700 XT and AMD Radeon RX 7800 XT graphics cards.
- Adds support for additional AMD Radeon 700M Series devices.
- Improves support for Multi-GPU systems.
- Fixes the “Unspecified Error” in the Wave Distribution graph on AMD Radeon RX 7000 Series hardware.
- Re-introduces 23 counters on newer RDNA hardware generations:
- Timing:
- TessellatorBusy, TessellatorBusyCycles
- VsGsBusy, VsGsBusyCycles, VsGsTime
- PreTessellationBusy, PreTessellationBusyCycles, PreTessellationTime
- PostTessellationBusy, PostTessellationBusyCycles, PostTessellationTime
- VertexGeometry:
- VsGsVerticesIn, VsGsPrimsIn, GSVerticesOut
- PreTessellation:
- PreTessVerticesIn
- PostTessellation:
- PostTessPrimsOut
- PrimitiveAssembly:
- PrimitivesIn
- TextureUnit:
- TexTriFilteringPct, TexTriFilteringCount, NoTexTriFilteringCount
- TexVolFilteringPct, TexVolFilteringCount, NoTexVolFilteringCount
- Timing:
Better DRED Integration and Collection
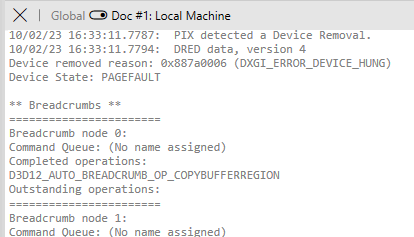
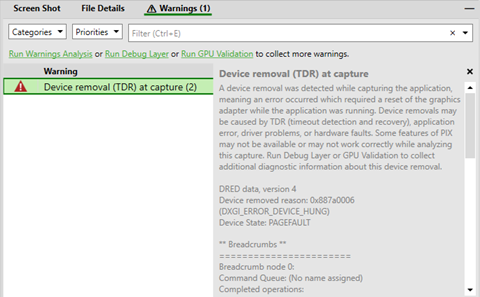
PIX now has a feature to automatically enable DRED (Device Removed Extended Data) in your application and log the data if your application TDRs. The data will be logged to PIX’s Output window and, if the TDR occurred during a capture, the data will also be saved to the capture file. When opening a capture that recorded a TDR, this information can be viewed (without needing to Start Analysis) from the Warnings View. However, due to some limitations around PIX’s TDR detection, this feature may interfere with an application’s own TDR detection and recovery.
New Texture Diff Visualizers
This release adds two new render target visualizers to the texture viewer:
- Diff (Absolute) – diffs each pixel’s color after the selected draw call with its color before the draw call
- Formula: output = float4(abs(afterColor.rgb – beforeColor.rgb), 0.0f)
- Diff (Greatest Channel) – similar to Diff (Absolute), but it only shows the channel with the greatest diff
More image visualizers will be added in future PIX releases! Please contact us if you have feedback about existing visualizers or suggestions for future visualizers.
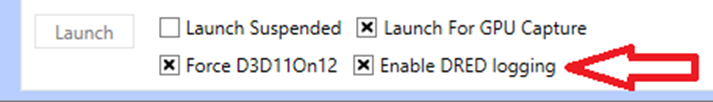
New “Take Capture” hotkeys
By default, PIX now lets you press the “F11” key to take a GPU Capture while your application is running. You can choose a different F-key in the PIX Settings view too, if you prefer. This new option complements the Print-Screen key, Alt+Print-Screen, and Shift-Print-Screen hotkeys which continue to work. This wide range of options should avoid issues when other applications take over some of these hotkeys, e.g. the Windows 11 Snipping Tool.
This is the setting to customize the F-key:
![]()
GPU Captures (raytracing features)
Hit and Miss Shader Debugging
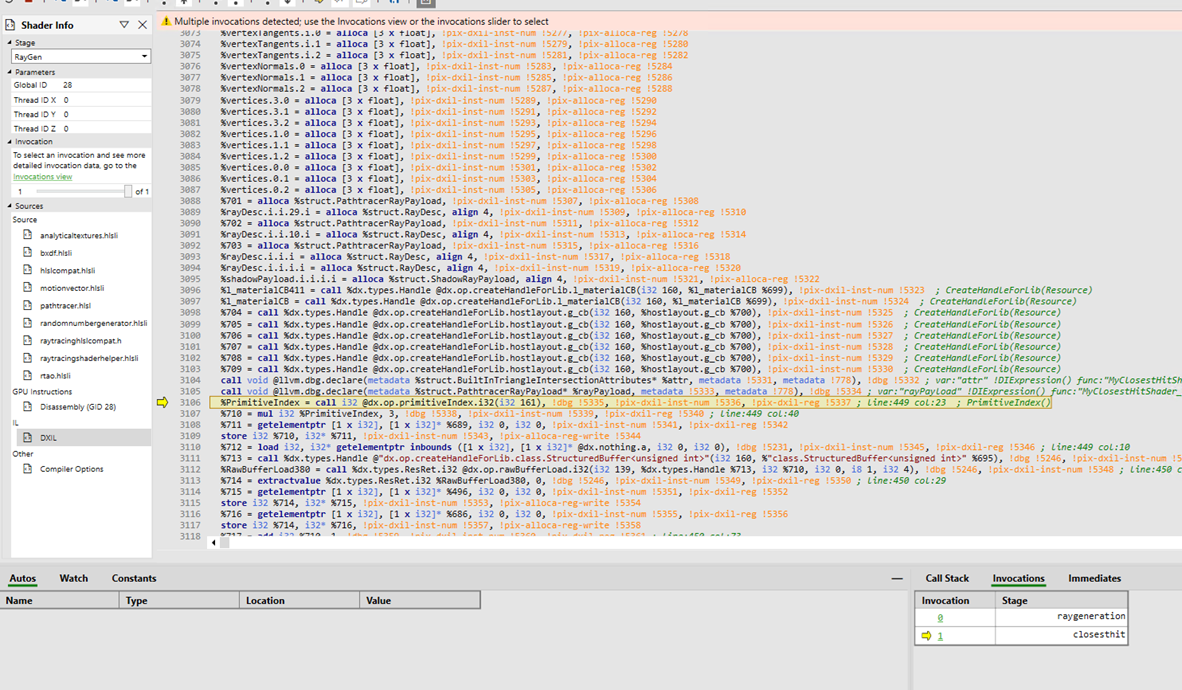
Earlier this year we released a version of PIX that could debug your RayGen shaders. Today’s release can now debug your ClosestHit, AnyHit and Miss shaders too!
To debug a hit or miss shader, first start debugging the raygen shader invocation that spawned it. Any resultant hit/miss shaders invocations will then be shown in the Invocations view, which will allow you to switch to the invocation you want to debug:
Acceleration Structure Hierarchy Tree
There is a new “Hierarchy Tree” panel next to the Acceleration Structure viewer. It shows the instances/geometries that make up your TLAS/BLAS and it lets you see information about each one, including its size, its flags, its transform, and other properties. You can also show or hide each individual instance/geometry in the viewer, and you can sort your BLASes within the TLAS by size.
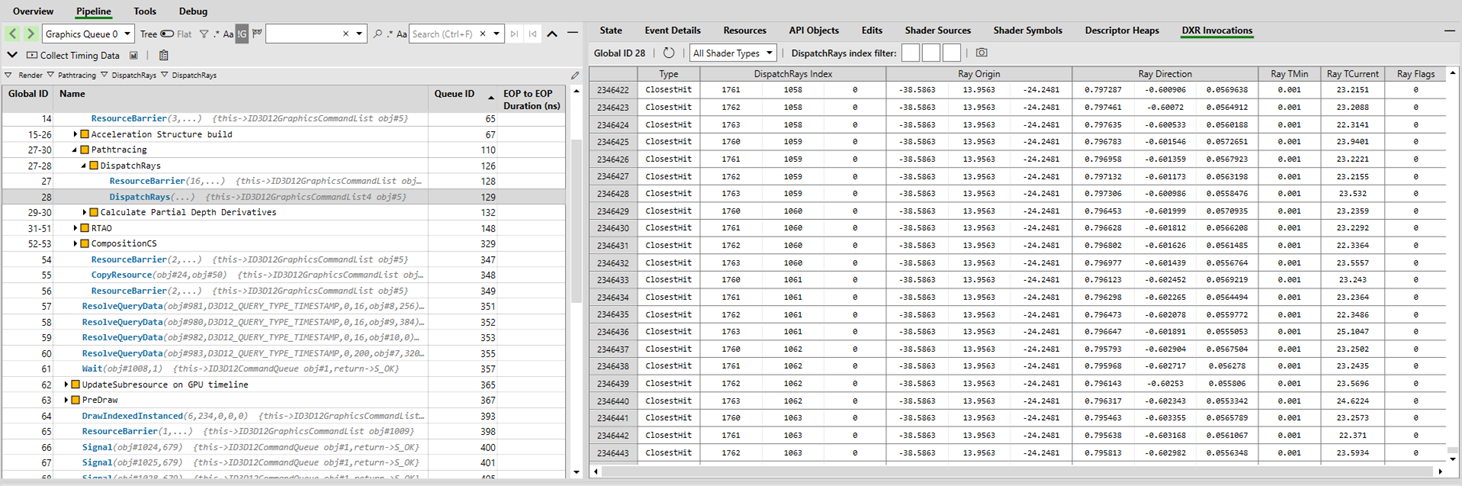
DXR 1.0 Invocations View
The new DXR Invocations view lets you see all of the ClosestHit, AnyHit, Miss or Callable shader invocations for a specific DispatchRays() event, and all of the DXR system values in those shader invocations:
DXR 1.0 Ray Visualization
The DXR 1.0 Invocations View and the Acceleration Structure Viewer work together to let you visualize the rays spawned by a DispatchRays() event. For example, if you select an Acceleration Structure, then go to the DXR Invocations pane and hit the Camera icon, then you can visualize the rays bouncing around your scene.
You can filter the rays down to individual planes/rays using the filter options in the DXR Invocations view, and hit the Camera icon again to refresh the ray visualization.
We plan to improve this feature in future PIX releases. Please contact us with any feedback or suggestions about how we can make this feature better for you!
Timing Captures
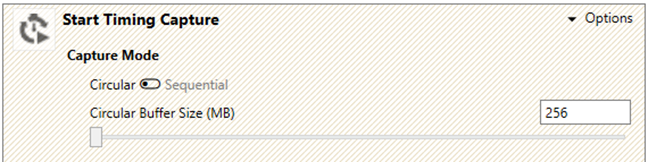
Circular Timing Captures
We have added a new optional mode to Timing Capture: Circular captures. In this mode, PIX will efficiently gather your Timing Capture information in a circular ringbuffer while your application runs. When you stop the capture, the data in the buffer is immediately converted into a PIX Timing Capture file for opening.
Circular mode works best when you want to be able to capture the last few seconds of your application, and you want to have minimal capture overhead while your application runs. This contrasts with the default mode, now called “Sequential” mode, where PIX writes your data into one long capture file while your application runs.
Circular mode only supports CPU data today, such as CPU samples or memory events. GPU information will be available in a future PIX release.
Capture Summary and Metadata
We have added some new system and capture metadata to the capture file, which is visible in the Capture Summary page. This includes the capture time, process, and system information. We have also added the largest allocated D3D API Objects to the Capture Summary page.
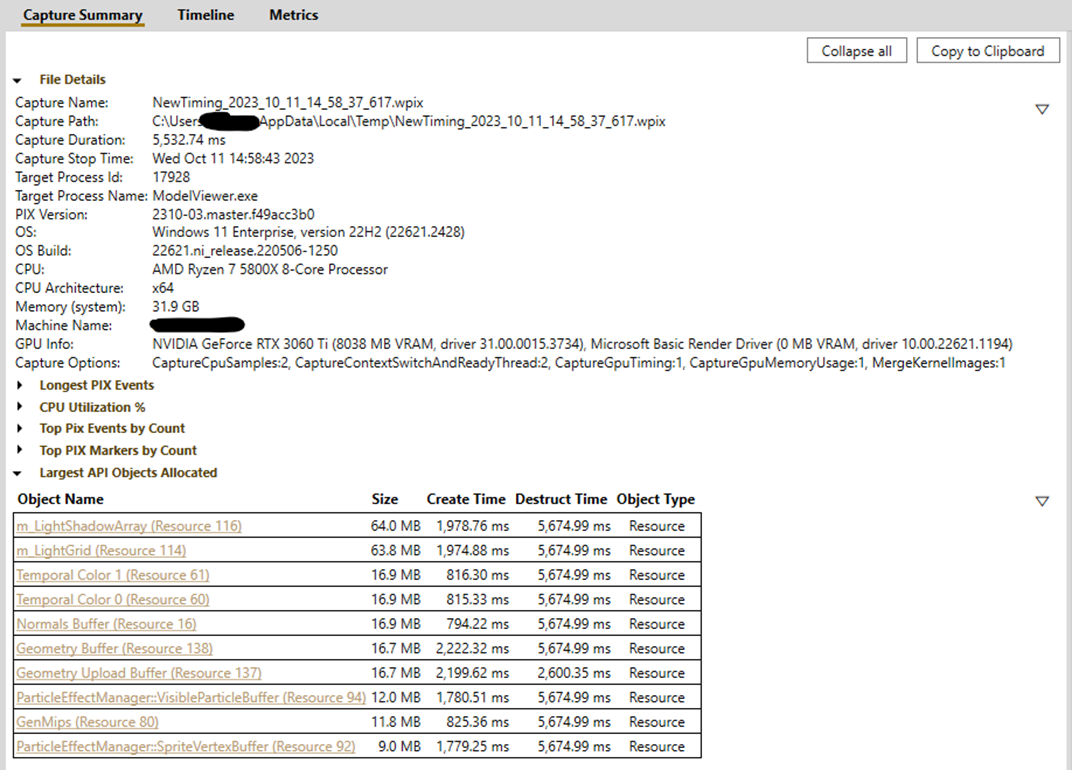
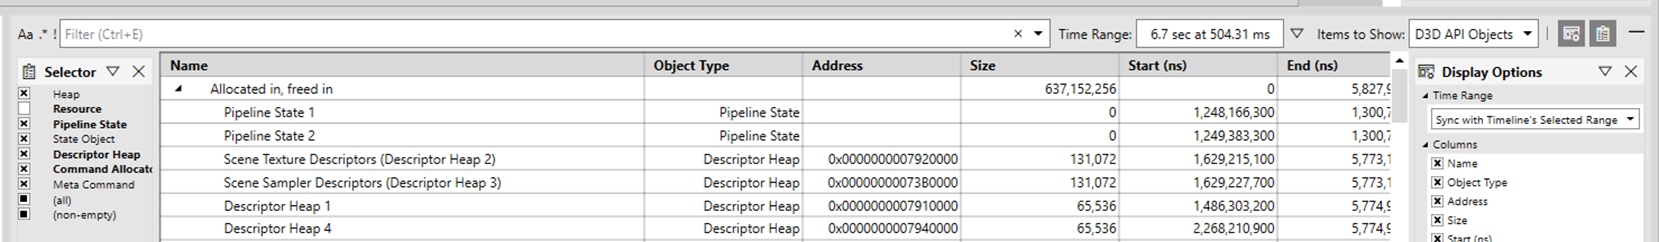
More D3D Object Types
In the previous release we added tracking for Resources and Heaps to help you identify GPU memory usage issues. Now you can see other API objects like Pipeline State Objects, Command Allocators, and more!
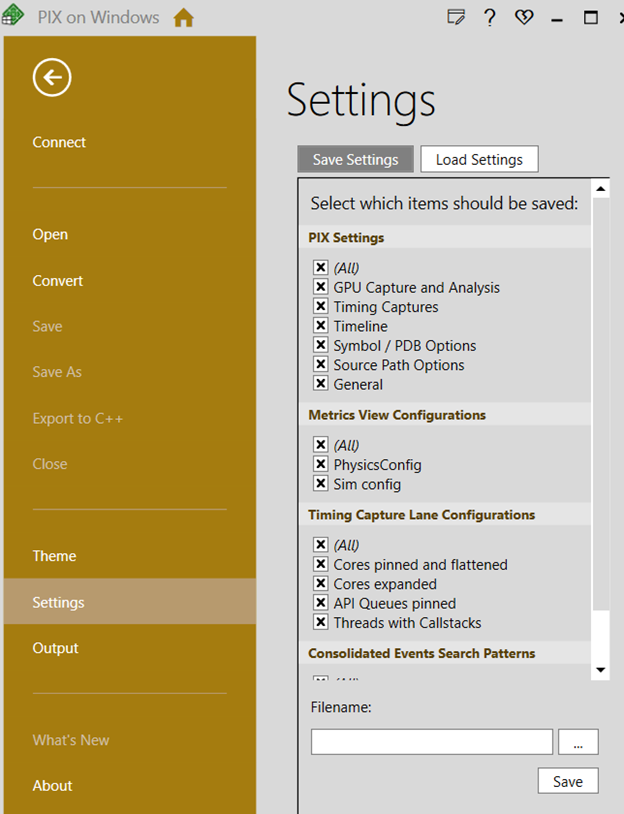
Import and Export of Timing Capture UI Configurations
Timing Captures now preserve various aspects of the user’s UI configuration, including the ordering of lanes and the graphed metrics, across captures and instances of PIX. These configurations can be exported by one user, then imported by others, to help ensure UI consistency when multiple developers are collaborating on captures within a studio.
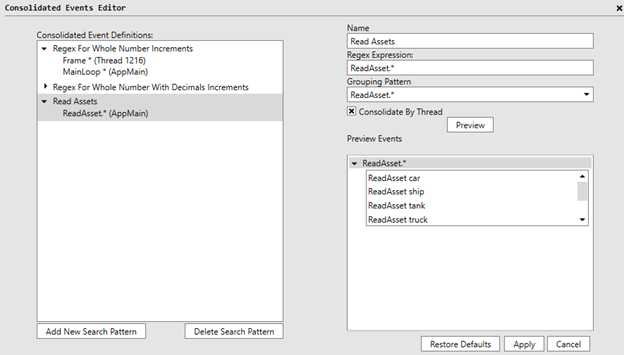
Metrics View Consolidated Events Editor
The Metrics View now includes an editor that lets you enter custom regular expressions to define a consolidated event. This feature if useful for creating consolidated events for cases where the built in regular expressions (for example, “Frame *”) aren’t sufficient.
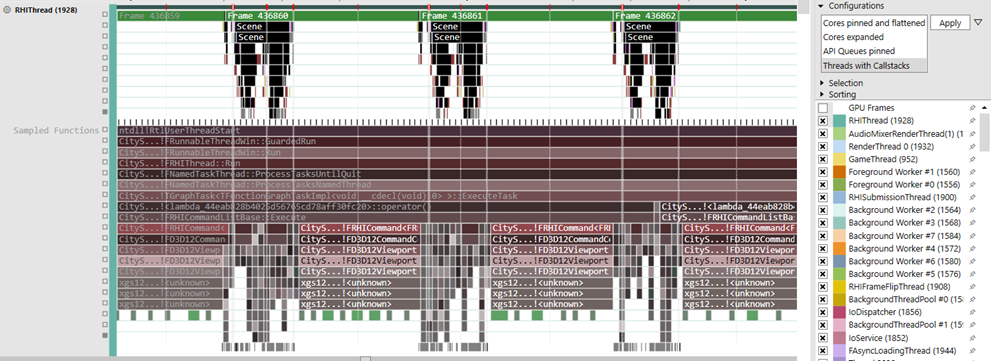
Sampled Functions Flamegraph
The Timeline view includes a new visualization for CPU samples. This visualization is a flamegraph displayed as a sub lane in a thread lane. The flamegraph is constructed by analyzing the callstack for each CPU sample for a given thread. Use the new Threads with Callstacks configuration to enable this visualization.
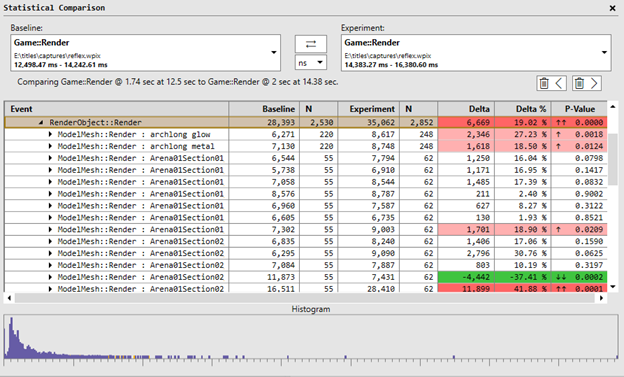
Enhanced Comparison Features
The Timing Capture compare feature now includes a detailed statistical analysis. This analysis can be used to compare two PIX event trees, or to compare the event instances above and below a budget line. Both comparison modes are accessed through the Timing Capture Metrics View.
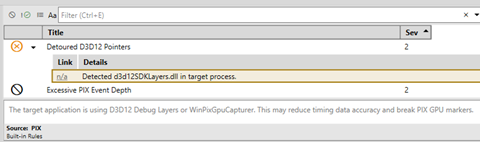
New Checklist View
We have added the Checklist view to Timing Captures, as previously seen in Xbox PIX. For now, the Checklist validates some simple things that may impact your Timing Capture such as the presence of the D3D12 debug layer or WinPixGpuCapturer.dll. We will add new checks in the future. Let us know what other things you would like us to automatically detect + warn you about!
Improved Idle Time Display in Core Lanes
The core lanes in Timing Captures have been updated so the display of idle time is consistent with the way idle time is drawn in the thread lanes. In light mode idle time is now white on the context switch sublane, so it’s clearly distinguished from the black used for other processes. Dark mode has been adjusted to have similar levels of contrast as in light mode for each type of block: Idle time is black so it blends in with the background. Other process blocks are white. Thread time with no PIX event is rendered as black with hatches.
Other Metrics View Improvements
Improvements to the Metrics View in this release include new mouse wheel interactions and a simplified budget UI. Shift + mouse wheel can now be used within the metrics lane or the histogram to change the y axis minimum and maximum values by zooming in and out. Clicking and dragging in the histogram, creates a selection range on the y-axis. The metrics lane will then zoom to show that range. Clicking and dragging the selected region within the histogram allows the user to reposition their viewport.
WinPixEventRuntime
Interpreting char* as UTF-8
For all of you UTF-8 users out there (including 🦀), we have made a breaking change to PIX: we interpret all char* PIX marker strings as UTF-8! For the best UTF-8 experience, we recommend using the latest WinPixEventRuntime together with the latest version of PIX.
New PIX Events Format
This version of WinPixEventRuntime introduces a new breaking change to the PIX events data format. This new format significantly improves performance, and it unlocks exciting new PIX marker-like functionality that we couldn’t do before.
For most PIX users, this change is just an implementation detail. There are some consequences for tools developers who interpret PIX events themselves though:
- If you consume PIX events by listening to ETW events, then this change may be problematic for you. Please contact us and we will happily help.
- If you consume PIX events by intercepting D3D12 API calls, then good news: PIX events pass the old format into the D3D12 APIs to maintain compatibility with other tools. We expect this to change in a year or two though. We are investing significant effort to make this transition be as pain-free as possible. We will share more details in the coming months.
Other improvements
- Fix crash when taking captures repeatedly via pixtool
- Support for taking circular captures via PIXBeginCapture
- Support %.*s in PIX marker format string (here’s a relevant StackOverflow post)
Bug Fixes and Other Improvements
- Connection Pane: Show Wavefront min and max sizes in GPU details
- Connection Pane: Show programmatic capture filepath in PC Connection UI, when applicable
- GPU Captures: Fix OOM issue capturing UE5.3
- GPU Captures: Shader Debugger: support namespaces, derived types, global statics, member functions and resource members
- GPU Captures: Fix shader debugging with certain existing collections
- GPU Captures: Fix false-positive NON_RETAIL_SHADER_MODEL_WONT_VALIDATE GBV warnings in the GPU Captures warnings tab
- GPU Captures: Make SM6.6 dynamically-indexed samplers show up in the Pipeline tab
- GPU Captures: Make Q/E keys move aceleration structure viewer camera up/down
- GPU Captures: Show RTV/DSV information in State view (e.g. flags)
- GPU Captures: Fix false-positive debug layer errors during InitializeMetaCommand() at capture time
- GPU Captures: Fix debug layer errors when using enhanced barriers with acceleration structures
- GPU Captures: Shader Access Tracking: robustify against null global root signature during DispatchRays()
- Timing Captures: Fix incorrect GPU memory usage counter data in Metrics view
- Timing Captures: Add support for generating .etl file (instead of .wpix file). The .etl file can be converted to .wpix in the Home->Convert menu.
- Timing Captures: time out, instead of hanging, when we encounter ETW initialization issues (same fix applies to Timing Data in GPU Captures)
thank you