

Today we released PIX on Windows version 2306.21-preview, which can be downloaded here.
This release includes initial debugging and profiling support for an exciting new D3D12 feature announced today: Work Graphs. You can read more about Work Graphs here.
You can find information about which GPUs support Work Graphs (and other prerequisites) here. PIX supports profiling and debugging Work Graphs on all GPUs that support them.
We only recommend using this version of PIX if you are using preview D3D12 features such as Work Graphs or GPU Upload Heaps. We recommend that all other PIX users use the latest main version of PIX available on our download page.
Work Graphs: Debugging Features
PIX has full capture/replay support for the Work Graphs API. After taking a capture, features available to you include:
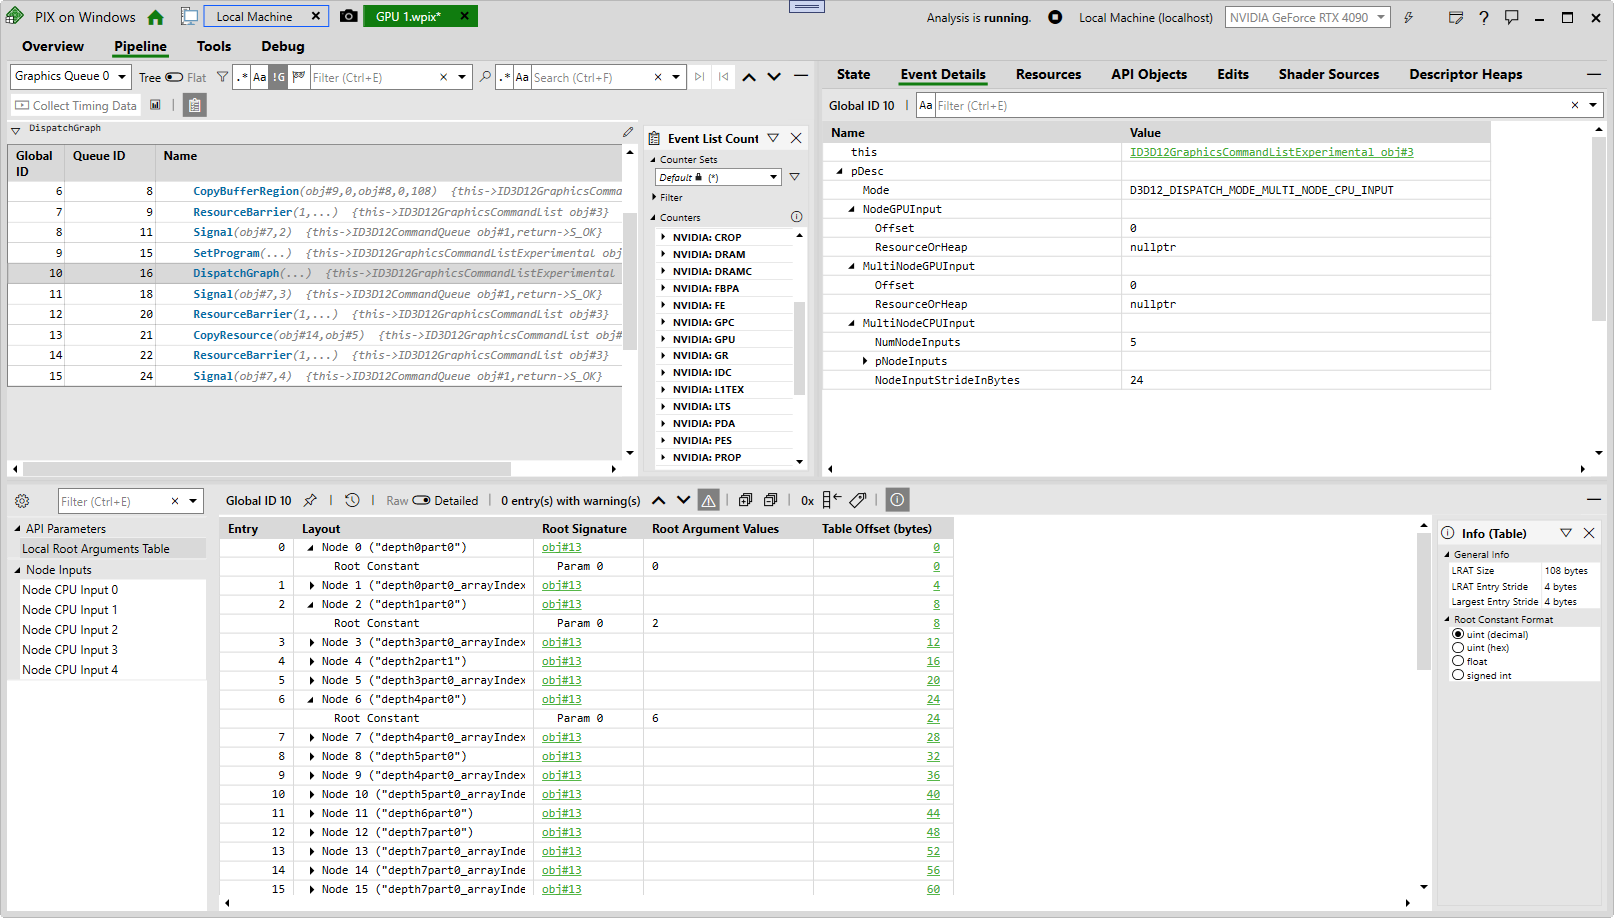
- The Event Details view: see the parameters you passed into the DispatchGraph() call.
- The Local Root Arguments Table (LRAT) view: see the layout of your LRAT and how it will be interpreted by the GPU. PIX will identify and tell you which shaders within your Work Graph correspond to which indices within your LRAT. It will then use the shader’s local root signature to interpret and display the local root parameters.
- The “Node Inputs”: visualize the raw bytes passed into your initial nodes, either via CPU data or via GPU buffers.
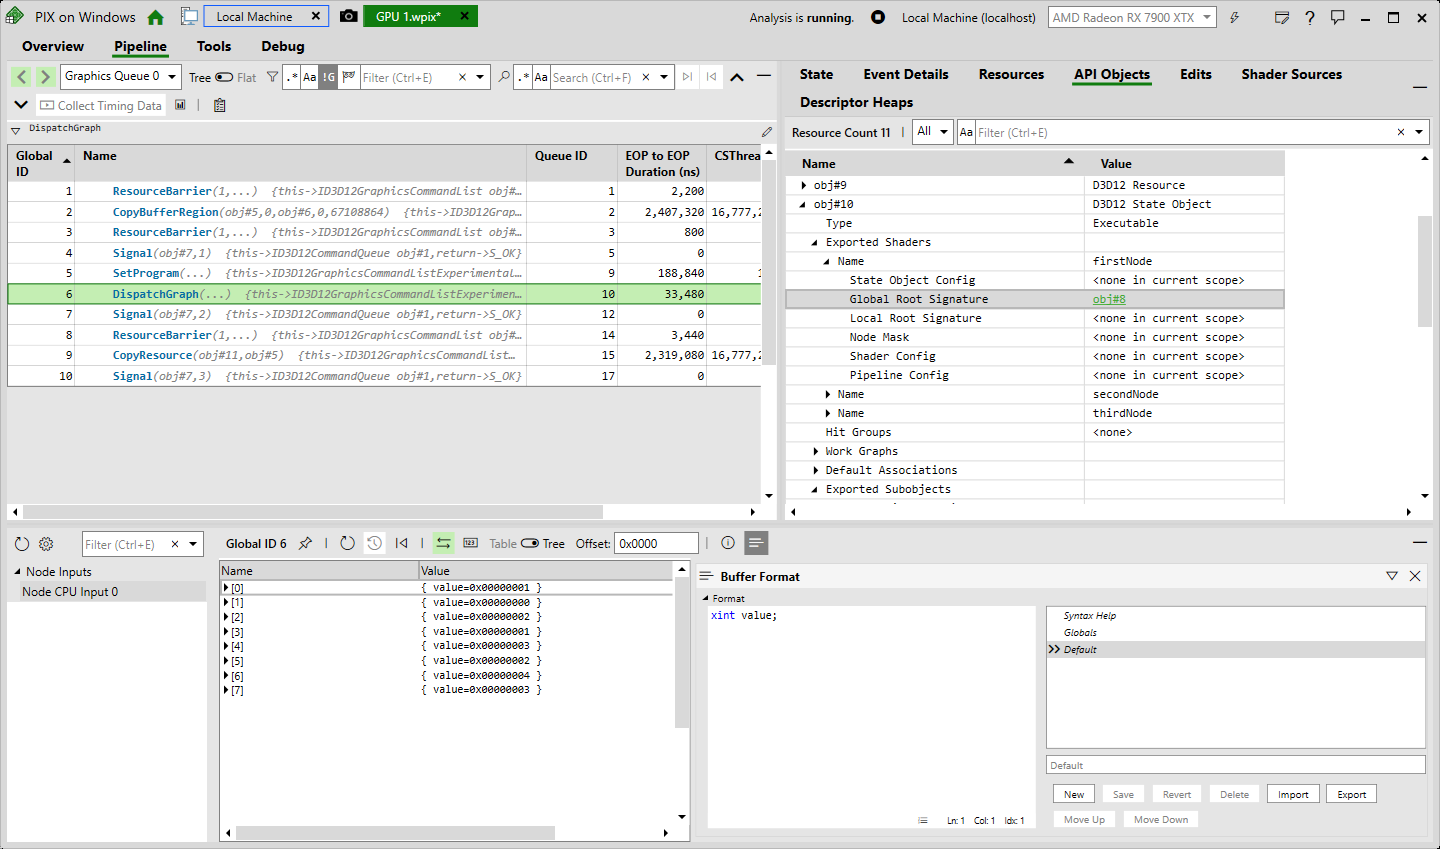
- The “API Objects” view: see the subobjects used to build your executable State Object. PIX will also interpret your implicit and explicit subobject associations, and it will display the subobjects (e.g. root signatures) associated with each shader.
This is just the first phase of debugging features for Work Graphs. There is a lot more to come in the future, including node shader debugging, visualization of the graph structures and the data flow between them, and more. Stay tuned!
Work Graphs: Profiling Features
All existing profiling features in PIX on Windows continue to work with Work Graphs. This includes:
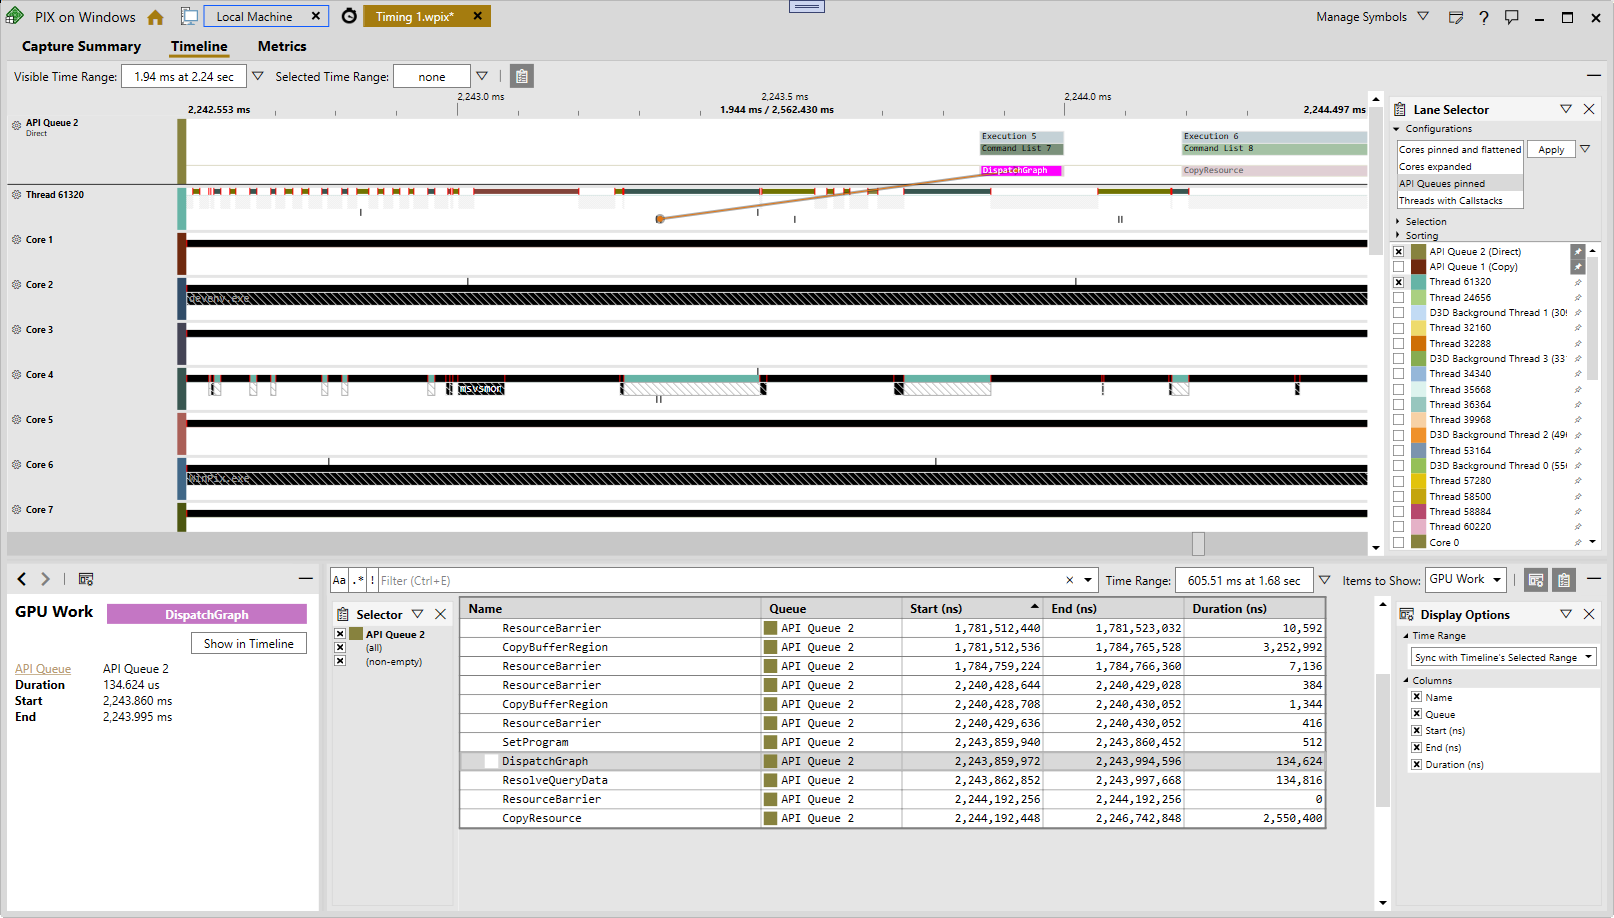
- Basic Timing Information: ToP-EoP and EoP-EoP durations for DispatchGraph events
- Event List Counters, including low-level hardware-specific counters gathered via each hardware vendor’s PIX plugin
- Timeline Counters, a.k.a. “High Frequency Counters”: graphs of low-level counter values over time
- Timing Captures: see your GPU timing information alongside your CPU profiling information
0 comments