

Today we released PIX version 2208.10, which can be downloaded here.
This release has support for many new features, including:
- GPU Capture improvements
- Support for Shader Model 6.7
- Programmatic API improvements
- GPU power state selection
- Experimental capture trimming
- Timing Capture improvements
- D3D Resources in Timing Captures
- Performance budgets in the Timing Capture Metrics View
- Data Export from the Timing Capture Metrics View
- Bug fixes and other smaller improvements
GPU Capture Improvements
Support for Shader Model 6.7
Last month the DirectX team released Shader Model 6.7, and today’s PIX release includes support for it. This support allows you to capture, replay, debug and profile your Shader Model 6.7 shaders.
Programmatic API Improvements
Thank you for the feedback we received about the new programmatic APIs we added last year. This PIX release addresses a lot of the feedback. In particular:
- PIX now shows captures taken via PIXBeginCapture() in the PIX UI, if the PIX UI is attached to the application.
- We’ve added the PIXSetHUDOptions() API, that allows applications to hide the PIX capture-time HUD after loading WinPixGpuCapturer.dll.
- We also display a better HUD by default when the application manually loads WinPixGpuCapturer.dll
- We’ve made PIXBeginCapture()’s capture file path parameter optional.
- If the PIX UI (or pixtool) is attached to the application when it calls PIXBeginCapture() with a NULL capture file path, then PIX will use a temporary file name.
- If the PIX UI (or pixtool) isn’t attached to the application when PIXBeginCapture() is called with a NULL capture file path, then PIXBeginCapture() will fail.
- We’ve added the PIXForceD3D11on12() API.
Please continue to contact us if you have feedback or suggestions, either about this feature or other PIX features.
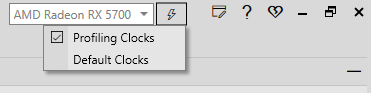
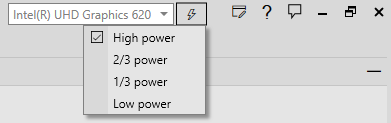
GPU Power State Selection
This release adds the ability to put the GPU into a variety of different power states while profiling a GPU Capture. These power states are stable, but in some extreme circumstances a power state may not be sustainable for long periods of time. PIX will let you know when the GPU wasn’t able to sustain a requested power state.
On some devices, this new functionality lets you put the GPU into a more representative power state that your game would see when its run, compared to the indefinitely-sustainable stable power state achieved via ID3D12Device::SetStablePowerState(). The new functionality also lets you intentionally target less powerful power states (e.g. battery-conscious power states) that better represent user scenarios that you would like to optimize for.
These new power states are defined by each hardware vendor. Currently AMD and Intel define custom power states for their supported hardware. Other hardware vendors will define custom power states in a future PIX release. Many thanks to our hardware partners for making this possible!
Experimental capture trimming
This release adds an experimental option to pixtool that lets you take a large capture file and “recapture” a region of it into a separate smaller capture file. This might be useful for simplifying a bug repro into a targeted capture file that can be sent to another team (or company) for investigation.
The feature pairs particularly nicely with the Export to C++ feature that we added earlier this year. For example, let’s say that you see some rendering corruption in your game: you could take a capture of that frame, trim the capture down to a few problematic Draw calls, export that simplified capture to C++, and then send this simplified C++ code over to a partner team (or company) for investigation.
This command demonstrates how you can take a capture file and create a new capture file that contains the GPU work that was between Global ID 15 and 20 (inclusive) in the original capture file:
pixtool.exe --output=verbose open-capture

“c:\myreadabledirectory\MyOriginalFile.wpix” recapture-region

“c:\mywriteabledirectory\MyRecapturedFile.wpix” --start=15 --end=20
We plan to add this feature to the PIX UI in the feature. In the meantime, we would love to hear feedback about it: please get in touch if you have thoughts.
Timing Capture Improvements
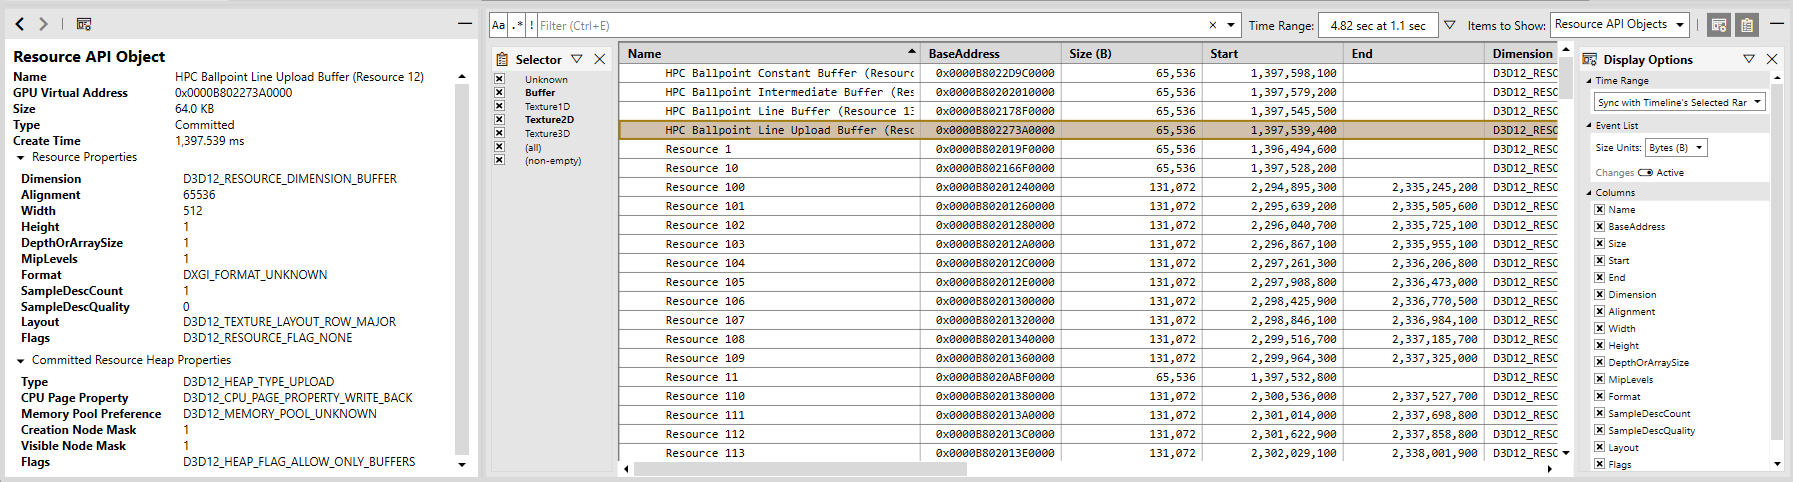
D3D Resources in Timing Captures
Timing Captures now include an option to record information on all D3D resource and heap objects allocated and freed while the capture is running. This option provides insight into the total memory used to hold D3D objects, and identifies the specific objects that are in memory, at any point in the capture.
To enable this feature, ensure the “GPU Resources” checkbox is enabled in Timing Capture options. After taking your capture, select a time range and then select either “Resource API Objects” or “Heap API Objects” in the “Items to Show” dropdown. Note only committed and placed resources are supported in this release.
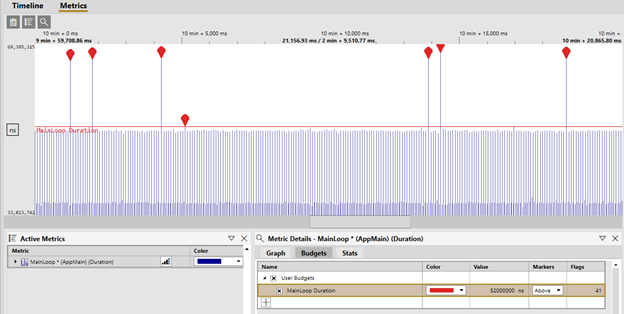
Performance budgets in the Timing Capture Metrics View
Performance budget lines are now available in the Metrics View. Budgets and budget markers make it easy to quickly find points in the graph that are over their budget. Performance budgets can be specified for any metric. Budgets are often assigned for a variety of scenarios, including frame time, the amount of time a particular subsystem is allowed to run per-frame, or to help track memory usage.
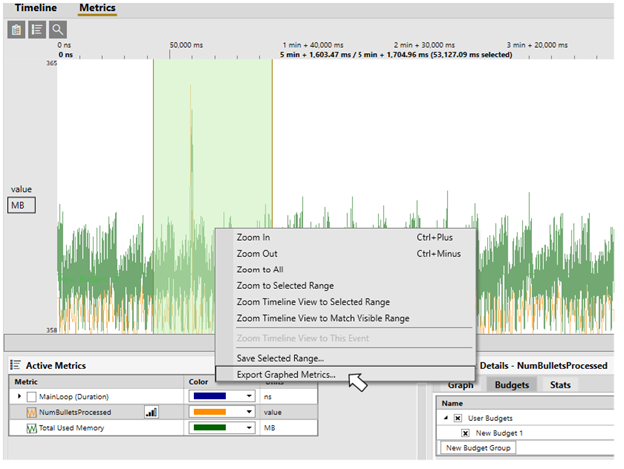
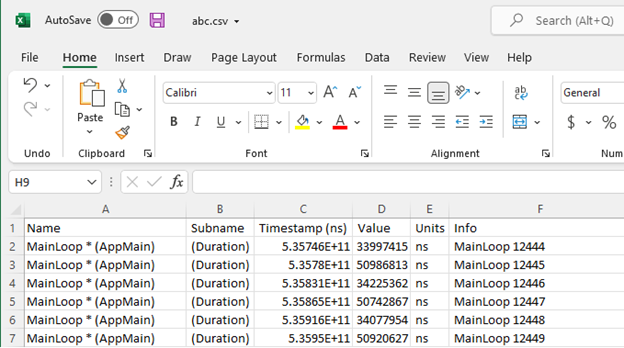
Data Export from the Timing Capture Metrics View
The Metrics view now supports exporting data for analysis in other tools such as Microsoft Excel. Data is exported in csv format. The values for all points of the currently graphed metrics are exported.
Bug fixes and other smaller improvements
- Fix DXR debug layer error at capture time
- Fix engine crash when PDB file is set to the compiled shader
- Make adapter selection more resilient to driver changes
- Fix “Capture Time” string to show UTC time
- Fix timing capture race condition when using a short-lived app
- Restore sorting behavior for Autos view
- Fix alpha channel only display in texture viewer
- Fix some issues with x86 apps on ARM64
- Fix engine sending PDB name instead of hash for UI strings
- Support viewing buffer contents before selected event
- Make the ‘Work In Progress’ bar show in the API Objects Table view
- Make IA Output look for “SV_Position” case insensitive
- Fix timing captures with a very short duration not automatically stopping
- Fix null reference crash on shutdown
- Fix crash when loading corrupted metrics view state at startup.
- Fix BlendOpAlpha reporting as BlendOp in state view
- Make sure doc tab strip item goes away on last doc close
- Fix crash when using old layouts with no-longer-existent view names
- Ensure doc dropdown disappears when parent becomes non-compressed
- Bind Ctrl+F9 to enable/disable breakpoint
- Force tab name to match new view in layout editor
- Fix/add theme colors for watch values changed/NanInf
- Fix unnecessary range details refresh on symbol load
- Fix crash when range details event list loading is cancelled
- Improve edit mode in breakpoint conditions
- Add out-of-bounds messages to include null descriptor heaps
- Speed up HLSL coloring
0 comments