
PIX on Windows
Performance tuning and debugging for DirectX 12 games on Windows
Latest posts
PIX 2605.28-preview: previewing new PIX and D3D12 features
Today we released PIX version 2605.28-preview, which can be downloaded here. This release complements the new D3D12 Agility SDK that was released today, version 721. This PIX release also includes initial preview versions of a lot of the exciting PIX features that we announced in our GDC session in collaboration with AMD, Intel, NVIDIA and Qualcomm. You can read more about those announcements here, and you can watch our session in the GDC vault. Please try out these new features and let us know your thoughts. The best ways to reach us are via the Send Feedback button in the PIX UI, and via the #pix channel ...
PIX 2604.27004-preview – support for new D3D12 Preview features, and more
Today we released PIX version 2604.27004-preview, which can be downloaded here. This release has initial support for the new D3D12 features, notably Batched Asynchronous Command List APIs, that was released in a preview DirectX Agility SDK today. Please visit this blog post for more information about the Agility SDK release. This version also includes some bug fixes compared to the last Preview PIX release, 2602.25-preview. Details are listed below. PIX 2604.27004-preview is a preview version of PIX. We only recommend using this version of PIX if you are using a preview D3D12 feature like Batched Asynchrono...
PIX 2603.25 – misc bug fixes and improvements
Today we released PIX 2603.25 which can be downloaded here. These releases include everything in the previous 2602.25 release, plus the following bug fixes: Thank you to everyone who reported issues and suggestions to us. Please keep them coming! The best ways to contact us are via the DirectX Discord and via the Send Feedback buttons in PIX.
PIX 2602.25 and 2602.25-preview – support for new D3D features and misc quality-of-life improvements
Today we released PIX 2602.25 and 2602.25-preview, which can be downloaded here. These releases include everything in the previous 2601.15 release, plus: By default we recommend that all PIX users use non-preview versions of PIX (e.g. 2502.25). We only recommend that you use preview versions of PIX (e.g. 2602.25-preview) if you are trying out new preview D3D12 features. Both versions of PIX include correctness fixes and quality-of-life improvements listed below. As usual, please get in touch with us if you have any feedback or hit any issues! The best ways to contact us are via the Send Feedback b...
PIX 2601.15 – new Intel plugin, many buffer viewer improvements, and more
Today we released PIX version 2601.15, which can be downloaded here. This release includes everything in the previous 2509.25 release, plus: As usual, please get in touch with us if you have any feedback or issues. The best ways to contact us are via the Send Feedback button in PIX or via the #pix channel on the DirectX Discord server. New Intel Plugin This version of PIX includes a revamped plugin from Intel, giving you a far better profiling experience for Intel GPUs in PIX than ever before. Many thanks to our partners at Intel for making this happen! Improvements include: ...
PIX 2509.25 – support for new D3D features and devices, and misc bug fixes
Today we released PIX version 2509.25, which can be downloaded here. This release includes everything in the previous 2507.11 release, plus: Patch Tuesday Compatibility Fix TL;DR: If you are hitting errors where PIX says that it can't enable experimental features, then please update to PIX 2509.25 (or later) and try again. More details: Windows 11 update KB5065789, initially releasing as a preview in late Sept 2025, updates the system32 copy of D3D12Core.dll to be roughly the same as DirectX Agility SDK 616.1. That new Agility SDK introduced a breaking change to the D3D12EnableExperimenta...
PIX 2507.11 – misc bug fixes + improvements
Today we released PIX version 2507.11, which can be downloaded here. This release includes everything in the previous 2505.30 release, plus the following bug fixes: As usual, if you hit any issues or have any suggestions for us then please contact us via the "Send Feedback" button in PIX or via #pix on the DirectX Discord.
PIX 2505.30 and 2505.30-preview: support for DXR 1.2, Cooperative Vectors and more
Today we released two new versions of PIX, which can be downloaded here. These complement the new D3D12 Agility SDKs released today. The new versions of PIX are: Both versions also include some bug fixes compared to the last PIX release, 2505.09. Details are listed below. We recommend that you only use PIX 2505.30-preview if you are using a preview D3D12 feature like Cooperative Vectors or SER. We recommend that all other PIX users use 2505.30. As usual, if you have any feedback or suggestions for PIX then please get in touch! The best ways are via the DirectX Discord...
New memory profiling features in Timing Captures
The 2505.09 release of PIX on Windows adds several new features to help you optimize your game's use of memory. These features include: Memory-related Metrics The memory metrics for your game's process are available in both the Metrics layout and the System Monitor. These counters enable you to track your commit charge, or page file usage, along with the number of page faults and the overall working set size. Memory Usage Lane in the Timeline A new lane named Memory Usage is now available in the Timeline. The amount of memory allocated per allocator throughout the capture is graphed, al...
Power status, CPU frequency and CPU C-State counters
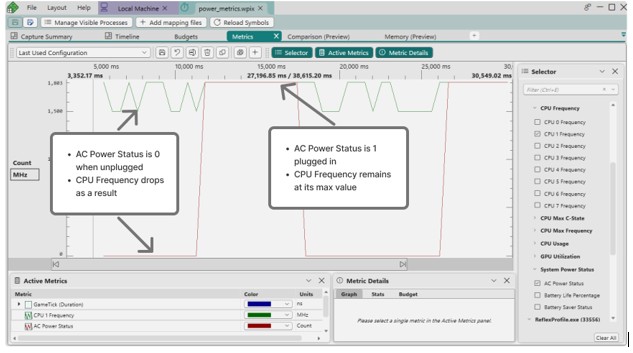
Starting with the 2505.09 release of PIX on Windows, new metrics have been added to help you optimize your title on battery powered devices such as tablets and Windows handheld gaming devices. With these counters, you can see whether performance issues in your game can be correlated with power-related events, such as a change in CPU C-state, or a device going into power saving mode, for example. These metrics are available in System Monitor, and in the Metrics, Comparison, and Budgets layouts in Timing Captures. The following metrics are provided: System Power Status Metrics Per-Processor...
PIX 2505.09 – Revamped UX, Improved Usability, and Many New Features
Today we released PIX on Windows version 2505.09, which can be downloaded here. Since our preview announcement at GDC, we have been working hard to deliver the changes we promised and more. Today’s release includes many new improvements to PIX, including big overall changes and changes specific to GPU Captures and Timing Captures. Other improvements, such as information about the PIX API preview, will be available in the coming weeks – stay tuned! As usual, if you have any feedback or suggestions for PIX then please get in touch! The best ways are via the DirectX Discord (#pix) or via the Help->Send Feed...
Introducing Budget Profiles in Timing Captures
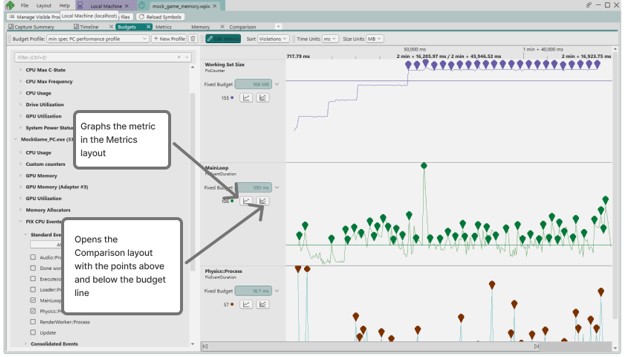
The 2505.09 release of PIX on Windows introduces the concept of Budget Profiles in Timing captures. A Budget Profile is a grouping of budgets defined for their respective metrics. A common use of Budget Profiles is to define the performance targets, or profiles, for different hardware specifications. For example, your studio likely has different performance targets for min-spec, mid-range and high end PCs. Budget Profiles are defined and managed using a new Budgets layout. Click the New Profile button on the Budgets layout to create a new profile. A dialog will appear, prompting you to name your new...
Changes to PIX Events with a D3D context parameter
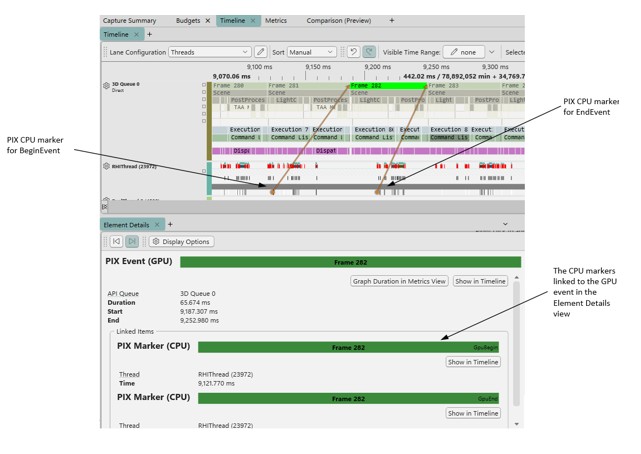
Prior to the 2505.09 release of PIX on Windows, calls to PIXBeginEvent and PIXEndEvent that include a Direct3D context were required to be called from the same CPU thread. Starting with the 2505.09 release, PIXBeginEvent and PIXEndEvent calls that include a context (referred to as PIX GPU events) may now be made on different CPU threads. This change has been made based on customer feedback that became more prominent after the release of Unreal Engine 5.5 as Epic changed the way in which they emit these events. With this change, the starting and ending times for the corresponding CPU work will be rendered ...
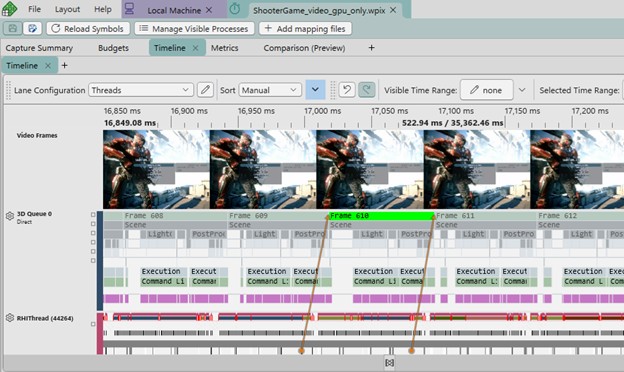
Capturing video frames in Timing Captures
Starting with the 2505.09 release of PIX on Windows, an option has been added to Timing Captures to record video frames along with the timing data. If the option to collect video frames is selected before a capture is taken, PIX will add a lane named Video Frames to the Timeline view. This lane will contain images that show the video frames over the duration of a capture. Viewing video frames alongside timing data allows you to see the state of the title at the point where a performance problem occurred. Select the “Select a video capture source…” button to opt in to collecting video frames. Doing so d...
PIX 2503.24: misc bug fixes
Today we released PIX version 2503.24, which can be downloaded here. This release includes everything in the previous 2501.30 release, plus the following bug fixes:
PIX 2501.30-preview: Application Specific Driver State, Recreate At GPUVA and Tight Alignment
Today we released PIX version 2501.30-preview, available for download here. This release has initial support for the exciting new D3D12 features that were released in a preview DirectX Agility SDK today. Please visit this blog post for more information about the Agility SDK release. 2501.30-preview is a preview version of PIX. It is identical to 2501.30 (non-preview) except it also has support for the new preview D3D12 features. We only recommend using this version of PIX if you are trying out the new D3D12 features. We recommend that all other PIX users stick to the most recent regular version of PIX availabl...
PIX 2501.30 – Support for Shader Hash Bypass, bug fixes, and everything in 2412.12
Today we released PIX version 2501.30, which can be downloaded here. This release includes support for everything that was in the 2412.12 version of PIX, plus the following improvements: Support for Shader Hash Bypass PIX has full support for this new D3D12 feature that allows apps to bypass shader hash validation in D3D12 runtime by embedding a sentinel BYPASS hash value in any shader binary. For more information about Shader Hash Bypass, please visit this blog post. GPU Captures: Timing Captures: As usual, please send your suggestions and/or feedback to us via the feedbac...
PIX 2412.12 – Texture/Buffer/Visualizer improvements, Work Graph Shader Debugging, and many Timing Capture improvements
Today we released PIX on Windows version 2412.12, which can be downloaded here. This release includes several new improvements to GPU Captures and Timing Captures, including: GPU Captures: Timing Captures: As always, nearly all of the new functionality in this release was added in direct response to customer feedback. Please continue to contact us with your issues and requests! The best ways to reach us are via the "Send Feedback" button in the top-right corner of PIX, and via the #pix channel on the DirectX Discord. GPU Captures Custom Buffer/Texture/Mesh Visualizer Impro...
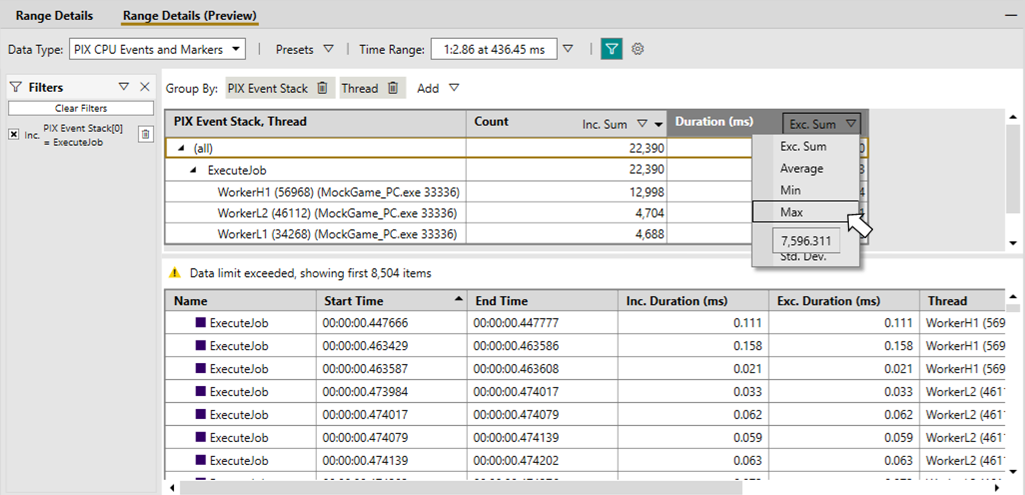
Timing Capture Range Details “v2”
Release 2412.12 of PIX on Windows includes a Preview of a new implementation of the Range Details view in Timing Captures. The initial implementation of the Range Details view allowed you to list individual data items for a given range of time. While this capability provided several basic scenarios, it was not flexible enough to support many of the analysis scenarios that PIX users have requested over the last few years. Limitations of the current Range Details view include a limited, hard-coded set of filtering and grouping capabilities per data type. Additionally, aggregations are not provided for most ...
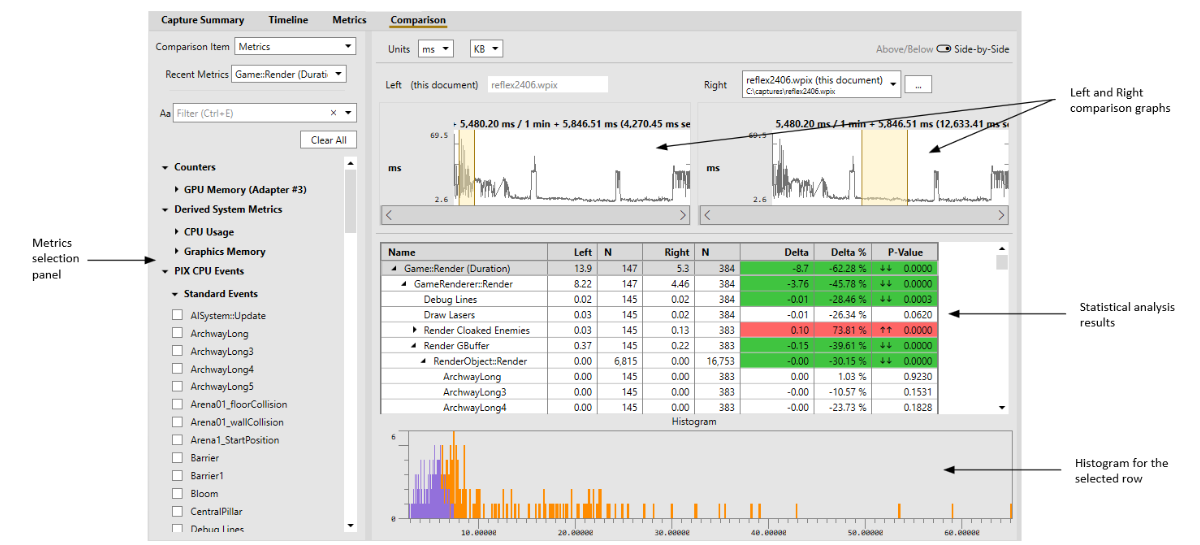
The Timing Capture comparison layout
Starting with version 2408.05 of PIX on Windows, the Timing Capture comparison features have been moved from the Metrics view to a new dedicated Comparison Layout. This layout improves several comparison workflows, including the ability to compare data from multiple captures. The Comparison Layout produces a statistical comparison of the average duration for the points that represent PIX event hierarchies in two selected ranges of time, or for the points above and below a metric's budget. Statistical comparisons help determine which portions of the event hierarchies had statistically different durations for t...
PIX 2409.23 – Support for new devices, bug fixes, and everything in 2408.09
Today we released PIX version 2409.23, which can be downloaded here. This release includes everything that was in the 2408.09 version of PIX, plus the following improvements: GPU Captures: Timing Captures:
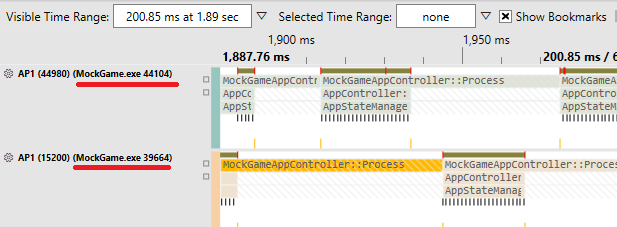
Multi-process profiling support in Timing Captures
Starting with the 2408.05 release of PIX on Windows, performance data from multiple processes can be analyzed with a single Timing Capture. The ability to analyze multiple processes simultaneously is useful in scenarios where multiple copies of a game server are running on the same machine, for example. PIX will capture data from all running processes on a machine when a Timing Capture is taken. However, callstacks are only captured for the title process that you started, or attached to, from the PIX UI. In multi-process scenarios, you'll want to check the Callstacks for non-title processes checkbox before ...
PIX 2408.09 – Bug fixes + everything in 2408.05
Today we released PIX version 2408.09, which can be downloaded here. This release includes everything that was in the 2408.05 version of PIX, plus the following bug fixes:
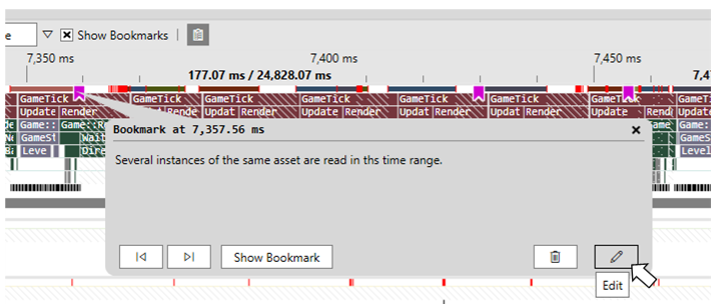
Timing Capture bookmarks
Starting with the 2408.05 release of PIX on Windows, developers can add bookmarks, or annotations, to lanes in the Timeline layout of Timing Captures. Bookmarks are text notes that can be added at either a specific point in time, or to a range of time, on any lane in the Timeline. These notes are used to annotate aspects of a capture that are interesting from a performance perspective. Bookmarks are saved in the capture, thereby allowing one developer to add a note for another developer to look at. The ability to save and share bookmarks helps developers collaborate on captures within a studio. The Summary lay...
Querying the PIX Timing Capture file format
The Timing Capture file format is a Sqlite database. Queries written in standard SQL syntax can be used to extract data from Timing Capture files to perform a variety of analysis tasks without requiring the PIX user interface. PIX on Windows includes a Sqlite extension that simplifies the queries for common tasks such as determining the duration and execution times for a PIX event, extracting counter values and so on. The Sqlite extension is named PixStorage.dll. The extension can be found in the PIX on Windows installation directory ("C:\Program Files\Microsoft PIX\2408.05", for example). ...
PIX 2408.05 – Custom Mesh/Texture Visualizers, faster playback, and a lot more
Today we released PIX version 2408.05, which can be downloaded here. This release includes a lot of new improvements in GPU Captures, Timing Captures and the System Monitor, including: GPU Captures Timing Captures Other Almost all of the new functionality in this release was added in direct response to customer feedback we received. Please continue to reach out to us with your thoughts, feedback, and bug reports! The best ways to reach us are via the “Send Feedback” button in the top-right of PIX and via the #pix channel on the DirectX D...
PIX 2407.17-preview: Mesh Nodes in Work Graphs
Today we released PIX version 2407.17-preview, which can be downloaded here. This release has initial support for the exciting new Mesh Nodes in Work Graphs feature that was released in a preview DirectX Agility SDK today. Please visit this blog post for more information about the Agility SDK release. 2407.17-preview is a preview version of PIX. We only recommend using this version of PIX if you are trying out Mesh Nodes in DirectX. We recommend that all other PIX users stick to the most recent regular version of PIX available on our download page. The support for Mesh Nodes includes: ...
PIX 2405.15: Agility SDK 1.614 support and misc bug fixes
Today we released PIX version 2405.15, which can be downloaded here. This release has a handful of bug fixes and also adds support for the Direct3D 12 Agility SDK version 1.614. Notably this SDK adds support for the 999e5 texture format. You can find download links and more information about the Agility SDK here.
Open sourcing the WinPixEventRuntime under MIT
The WinPixEventRuntime has been open sourced on GitHub under the MIT license! This includes the pix3.h headers (and friends), the code needed to build WinPixEventRuntime.dll, the code needed to decode PIX events, and a wide range of unit tests. The WinPixEventRuntime NuGet package has also switched to the MIT license. We hope this will make it easier than ever to integrate PIX events into your games, applications, and tools. We have also published a proposal for a new PIX CPU Frame / Task API. We would love to hear your feedback. Please visit this GitHub issue and leave your thoughts. Further links: ...
PIX 2403.08 – New D3D12 features + misc PIX improvements
Today we released PIX on Windows version 2403.08, which can be downloaded here. This release coincides with today’s Agility SDK release, which includes support for new features including the final Work Graphs API, GPU Upload Heaps, and more. Please visit this post on the DirectX blog for more information about the Agility SDK release. New features and improvements in this PIX release include: GPU Captures Timing Captures plus some bug fixes and other improvements. GPU Captures Support for new D3D12 Features Work Graphs This r...
PIX 2402.07 – misc bug fixes
Today we released PIX version 2402.07, which can be downloaded here. This release fixes two bugs: Stay tuned for our next big PIX update in March!
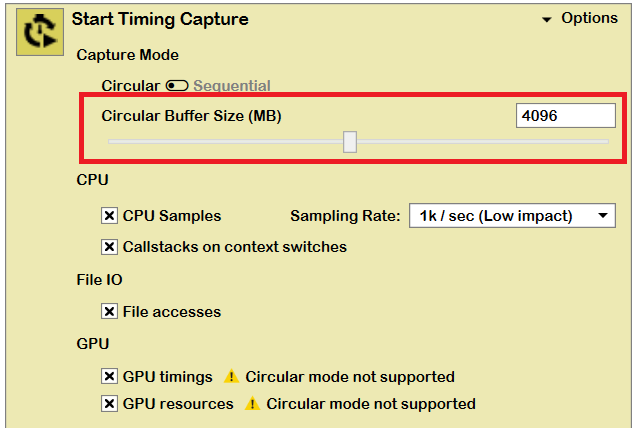
Circular Timing Captures
Starting with the 2402.07 version of PIX on Windows and version 1.0.231030001 of the WinPIXEventRuntime, Timing Captures can now be run in a new "Circular", or "ring-buffer" mode, in addition to the previously available "Sequential" mode. The new Circular mode is available both through the PIX UI and programmatically using the PIXBeginCapture API. When capturing in Circular mode, PIX stores the capture data in a fixed sized buffer on disk. When the buffer is full, the oldest capture data is aged out to make room for newer data. Because the amount of space needed to store capture data is fixed, Circular capt...
PIX 2312.08: misc bug fixes and improvements
Today we released PIX version 2312.08, which can be downloaded here. This fixes a lot of issues reported to us since our last major PIX release (version 2310.30, details here). Thank you all for reporting these issues. Please keep sending feedback to us through the usual ways, such as emailing us at askwinpix@microsoft.com or contacting us via the DirectX Discord. You may also want to see our Known Issues page. Here are all of the improvements: GPU Captures Timing Captures
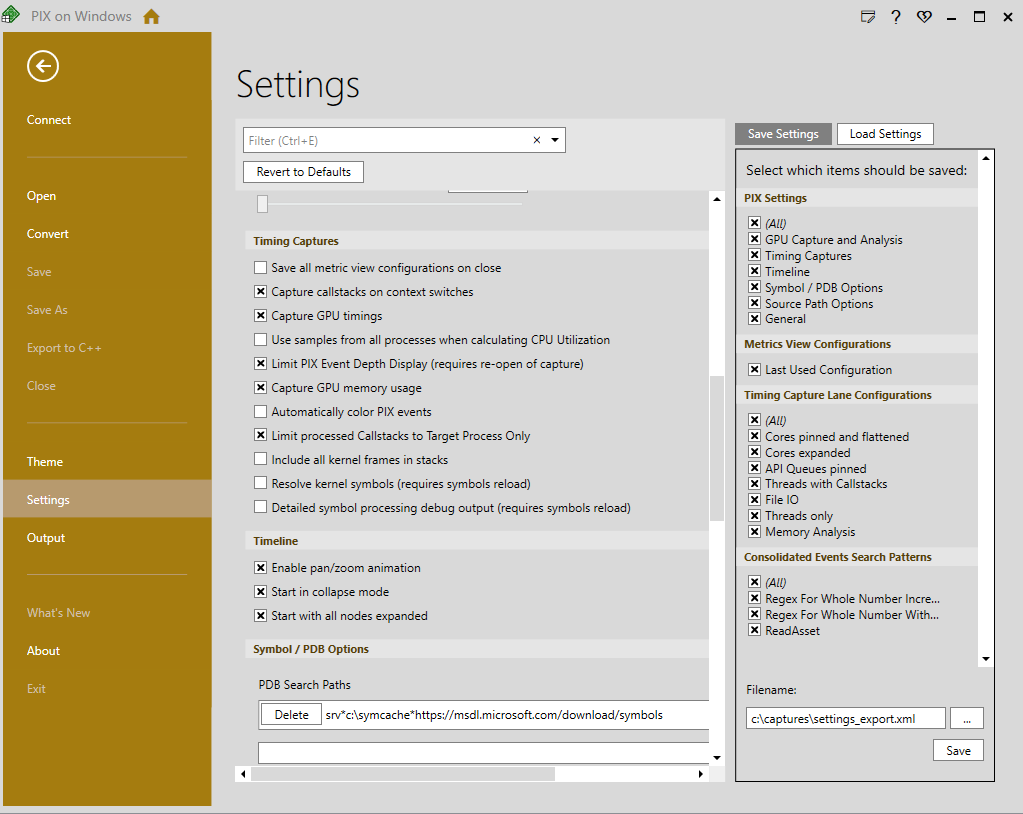
Saving and Loading PIX Settings
The Settings layout, accessible from the PIX Home tab, provides several controls for configuring various aspects of the PIX user interface and capturing experience. These settings, along with Timing Capture Timeline configurations, Metrics view configurations, and Metrics View Consolidated Event Patterns can be exported from PIX and saved to a file. These files can then to imported into other instances of PIX. The ability to export and import settings makes it easier for multiple users to collaborate in a studio. For example, a studio may wish to create a custom Timing Capture configuration for use by all d...
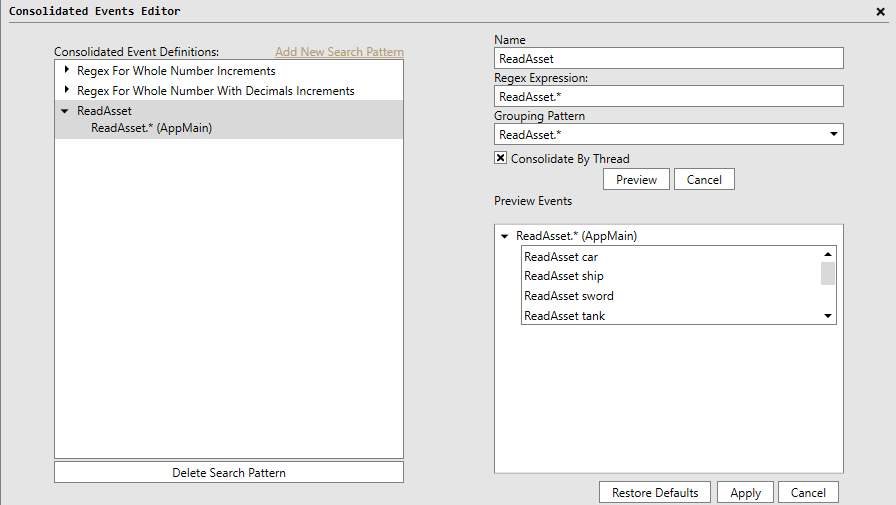
Defining custom regular expressions for consolidated events in the Timing Capture Metrics view
The consolidated events feature in the Timing Capture Metrics view is used to group, or consolidate, PIX events that follow a common pattern into a single event for purposes of graphing in the Metrics View. A common use of this feature is to group events such as "Frame 1", "Frame 2", "Frame 3" and so on into a single event. Prior to the 2310.30 release of PIX on Windows, PIX events were grouped using two regular expressions built into PIX. Starting with 2310.30, custom regular expressions can be defined if the two built-in regular expressions do not result in the event groupings you expect. Use the Consolid...
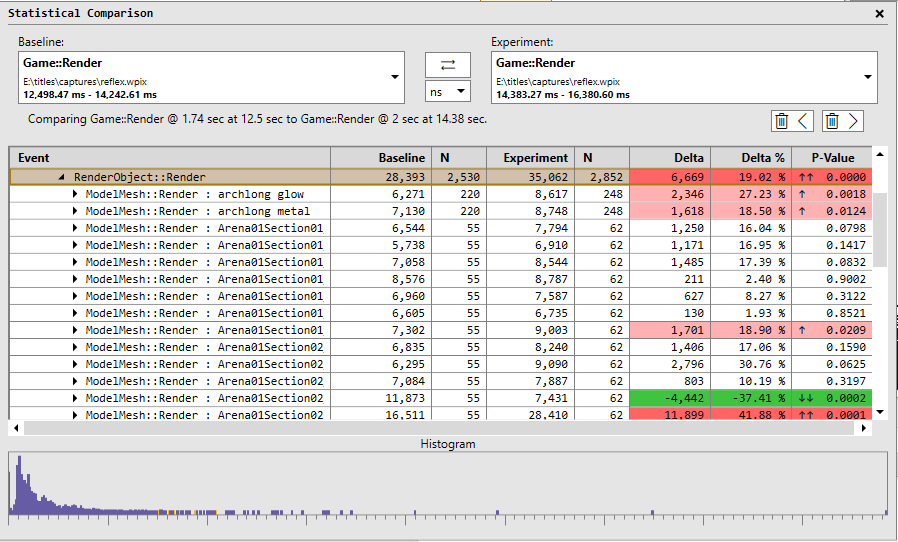
Timing Capture Statistical Comparison Features
Starting with the 2310.30 version of PIX on Windows, the Timing Capture Metrics view can produce a statistical comparision of the average duration for the points that represent PIX event hierarchies in two selected ranges of time. Statistical comparisions help determine which portions of the event hierarchies had statistically different durations for the set of points being compared. For example, the following graph of a metric named Game::Render shows several ranges of time where the event durations are relatively consistent, but there are also ranges of time in which the event's duration is significantly lo...
PIX 2310.30: a faster PIX with many raytracing + other improvements
Today we released PIX version 2310.30, which can be downloaded here. We also released WinPixEventRuntime version 2310.30, which can be downloaded here. This release includes many new features and improvements along several key themes: Thank you for all of your feedback and suggestions, and please them coming! The best ways to contact us are via the "Send Feedback" button in PIX and via the #pix channel on the DirectX Discord. This release includes: GPU Captures (misc features) GPU Captures (raytracing features) Timing Captures ...
PIX 2308.30: updated plugins + bug fixes
Today we released PIX on Windows version 2308.30, which can be downloaded from this link. This version of PIX is the same as our last main release, 2305.10, with the following changes:
PIX 2306.21-preview: Work Graphs support
Today we released PIX on Windows version 2306.21-preview, which can be downloaded here. This release includes initial debugging and profiling support for an exciting new D3D12 feature announced today: Work Graphs. You can read more about Work Graphs here. You can find information about which GPUs support Work Graphs (and other prerequisites) here. PIX supports profiling and debugging Work Graphs on all GPUs that support them. We only recommend using this version of PIX if you are using preview D3D12 features such as Work Graphs or GPU Upload Heaps. We recommend that all other PIX users use the latest mai...
PIX 2305.10: support for updated RenderPasses + misc other improvements
Today we released a new version of PIX on Windows: version 2305.10. It can be downloaded here: link. This release includes support for the latest DirectX Agility SDK features, such as the updated RenderPasses and minor Vulkan compatibility features. The release also includes fixes for several bugs that were impacting PIX 2303.30. Change list
PIX 2303.30: Misc bug fixes + preview GPU Upload heap support
Today we released two versions of PIX on Windows: version 2303.30 and version 2303.30.002-preview. Both can be downloaded here: link. If you’re using today’s new preview D3D12 features (GPU Upload Heaps or Non-normalized Sampling) then we recommend that you use PIX 2303.30.002-preview to debug and profile your application. For all other users, we recommend that you use PIX 2303.30. GPU Upload Heaps and Non-normalized Sampling Only supported in PIX 2303.30.002-preview Today the DirectX team released a new preview D3D12 Agility SDK with support for GPU Upload Heaps and Non-normalized Samp...
PIX and ID3D12ManualWriteTrackingResource
Summary If you’re using GPU_UPLOAD heaps and you are experiencing capture-time performance issues when you launch your application via PIX (e.g. your game’s framerate drops) then read on to learn how ID3D12ManualWriteTrackingResource might help you. Background When taking a GPU Capture, PIX (and other graphics debugging tools) often use WRITE_WATCH to automatically detect modifications to CPU-writeable (a.k.a. “mappable”) resources such as UPLOAD or GPU_UPLOAD resources. This was a reliable solution, but it poses a problem for GPU_UPLOAD heaps because current versions of Windows* don’t allow WRITE_WA...
Programmatic Timing Captures now available
As described in Programmatic Captures, the PIXBeginCapture and PIXEndCapture can now be used to start and stop Timing Captures from code running in your title. Programmatic Timing Captures are available starting with the 2303.02 release of PIX on Windows and version 1.0.230302001 of the WinPIXEventRuntime. Timing captures use several ETW providers. This dependency requires your title to be running with administrator privileges to be able to take programmatic captures. Also note that a helper dll, WinPixTimingCapturer.dll, must be loaded before calling PIXBeginCapture. The easiest way to load this dll is by...
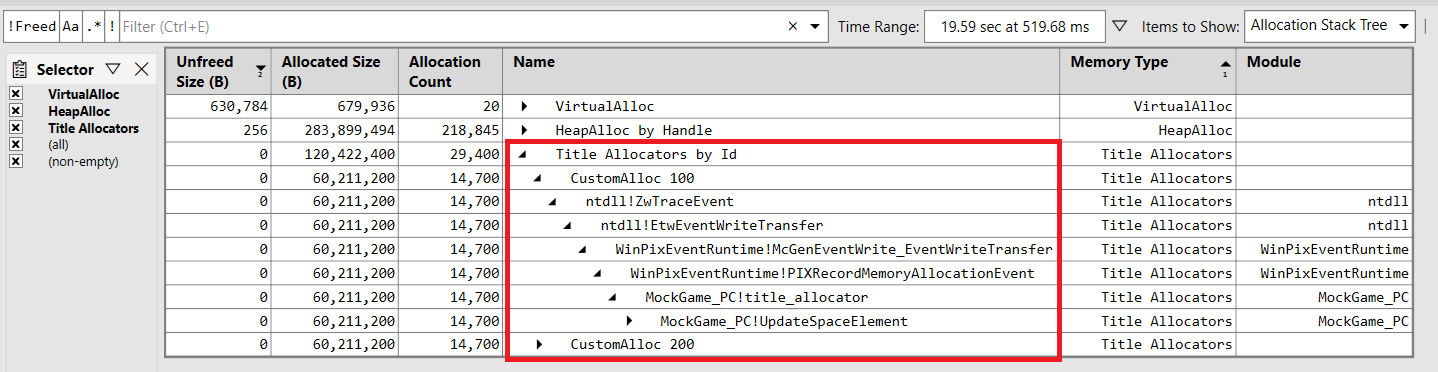
Memory profiling support for allocations made from a title’s custom allocator
Starting with the 2303.02 release of PIX on Windows, PIX timing captures can track memory allocations and frees made by your custom memory allocators. By calling the new APIs, PIXRecordMemoryAllocationEvent and PIXRecordMemoryFreeEvent, you provide PIX with the data it needs to display information about all memory allocations and frees made from within your title’s custom memory allocators. The data shown for your custom allocators is the same as the data shown for allocations made using either VirtualAlloc or HeapAlloc. PIXRecordMemoryAllocationEvent and PIXRecordMemoryFreeEvent are available in version 1....
PIX 2303.02: You asked, we listened! A bumper PIX release
Today we released PIX on Windows version 2303.02, which can be downloaded here. We have also released a new version of WinPixEventRuntime, which can be downloaded here. This release has many new features and bug fixes in direct response to requests and feedback we've received from PIX users. Thank you for all of your feedback and suggestions so far, and please keep 'em coming! Ways to contact us include the DirectX Discord server (discord.gg/directx) and the feedback button in PIX. This release includes: GPU Captures Timing Captures ...
PIX-2212.22-preview: Experimental raygen shader debugging and DXR resource access detection
Today we released PIX-2212.22-preview, available for download here. If you're working with DirectX Raytracing (DXR) then please consider trying out these new PIX features and letting us know how things go. Your feedback will help us improve the debugging experience in future PIX releases. If you aren't using a feature in the "What's New" section below then please use the latest main PIX release on our download page. What's New Contact Us If you try out these new features in PIX then please contact us with your thoughts and bug reports! The best ways to reach us are via t...
PIX 2210.10-preview: Initial support for Preview Agility SDK v706
Announcing Preview Builds PIX on Windows has always been dedicated to keeping pace with the official releases of the Agility SDK. However, developers working with the Preview versions of the Agility SDK - which contain D3D12 features that are still in progress - are left without a meaningful graphics debugger. This can be especially frustrating, as these features are often nuanced and difficult to get right. To address this, we’re excited to announce a series of PIX on Windows Preview releases. These versions of PIX on Windows are designed to work with the latest Preview Agility SDK (v706) and include our ini...
PIX 2208.10: SM 6.7 support, GPU and Timing Capture Improvements
Today we released PIX version 2208.10, which can be downloaded here. This release has support for many new features, including: GPU Capture Improvements Support for Shader Model 6.7 Last month the DirectX team released Shader Model 6.7, and today’s PIX release includes support for it. This support allows you to capture, replay, debug and profile your Shader Model 6.7 shaders. Programmatic API Improvements Thank you for the feedback we received about the new programmatic APIs we added last year. This PIX release addresses a lot of the feedback. In parti...
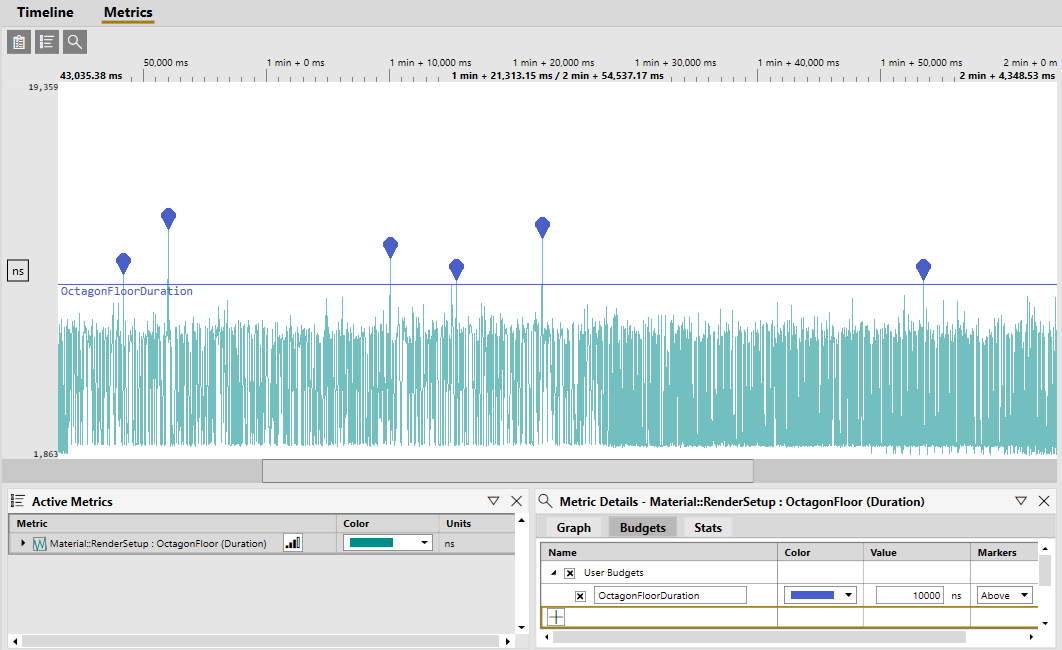
Using performance budgets in the Timing Capture metrics view
The 2208.10 release of PX on Windows adds the ability to specify performance budgets in the Timing Capture metrics view. Performance budgets make it easy to quickly find points in the graph that are over their budget. Performance budgets can be specified for any metric. Budgets are often assigned for a variety of scenarios, including frame time, the amount of time a particular subsystem is allowed to run per-frame, or to help track memory usage. The set of budgets for a metric are specified using the Budgets tab on the Metric Details Panel. Budgets are drawn as horizontal lines in the graph. The followi...
PIX 2206.20: Servicing release with new AMD plugin
Today we released PIX-2206.20, available for download here. The release is identical to the last PIX release (2205.24), except that it comes with a new version of the AMD plugin that supports additional AMD hardware and the latest AMD drivers.
PIX 2205.24: Unlocking Arm and Qualcomm development
Today we released PIX-2205.24, which can be downloaded here. This release contains Arm64 support for PIX and a Qualcomm plugin, bringing first-class support to graphics devs who want their apps to run as well as possible on Arm-based Windows hardware. PIX now runs natively on Arm64 With Arm-based Windows devices becoming more popular, we’ve heard from developers that they needed a better solution for debugging and profiling their apps on Arm64 machines. We listened: with PIX being an essential part of game development, we built an Arm64 version of PIX. From this release onwards, PIX will ship an Arm64 versio...
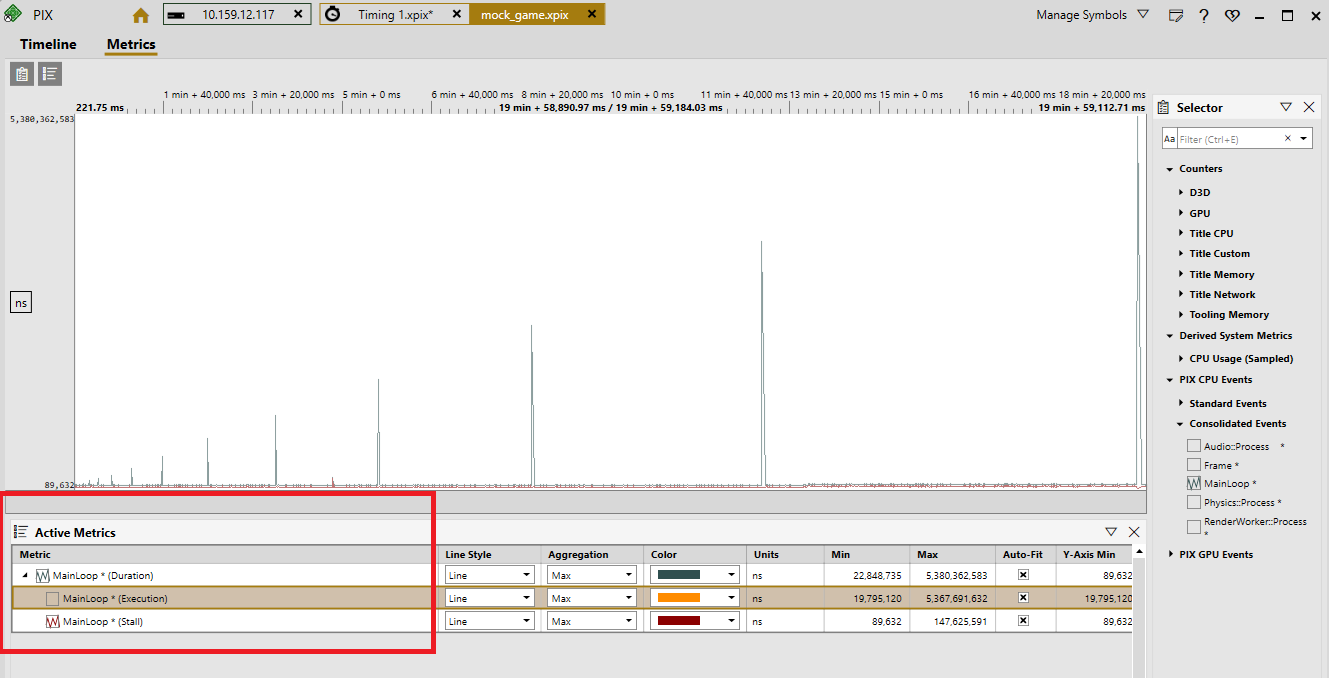
Timing Capture Metrics View improvements in PIX 2203.30
The 2203.30 version of PIX on Windows contains two new features in the Timing Capture Metrics View. We added both of these features based on your feedback. The first new feature is the ability to graph a PIX CPU events execution time and stalled time, in addition to its duration. The second feature is an enhancement to the consolidated events feature. Graphing Execution and Stalled Time When a PIX CPU event is graphed in the Metrics View, the duration of the event is graphed by default. The duration is the amount of time taken from the time the event started running until the time the event stopped running. ...
PIX 2203.30: Export to C++, UI changes and more!
Today we released PIX version 2203.30, which can be downloaded here. This release has a lot of new features, including: Export to C++ This release adds the ability to export a GPU Capture file into a series of C++ files that perform the captured D3D12 work. Potential use cases for this include: The exported code includes a CMakeLists.txt file. You can then use CMake to generate build files for a variety of build systems. Alternatively, you can load the folder in Visual Studio and let Visual Studio autogenerate build files for you (CMake...
PIX-2203.07: Support for DirectStorage
Today we released PIX-2203.07, which adds support for today’s DirectStorage announcement. For more on how to get started with DirectStorage, check out our DirectStorage Landing Page. PIX and DirectStorage New features need new tooling support! It’s been a consistent goal for the PIX team to ensure that developers get tooling support for a new feature as soon as possible. We’re proud to announce that we have PIX support for DirectStorage ready on day 1 with this release! To enable DirectStorage support in PIX, check the ‘File accesses’ checkbox under File IO in the Timing Capture settings. Once t...
PIX 2201.24: New Timing Capture Features
Today we released PIX version 2201.24, which can be downloaded here. New Features Graphing of consolidated PIX events in the Timing Capture metrics view It is common practice to name the PIX events that represent a frame of CPU work (or any other repeated set of work) with a sequential number pattern such as "Frame 123", Frame 124", "Frame 125" and so on. PIX will now look for events whose names follow this pattern and group, or consolidate, them. The individual events that fit the patterns will be treated as the same event in the Metrics View for purposes of graphing and analysis. Critical path ana...

Graphing Consolidated Events in the Timing Capture Metrics View
The 2201.24 release of PIX on Windows includes a feature that treats a set of events that follow a common naming pattern as the same event in the Timing Capture Metrics view. You'll find this feature useful if you follow the common practice of naming the PIX events that represent a frame of CPU work (or any other repeated set of work) with a sequential number pattern, as in this example: In this case, using the Metrics View to analyze an individual frame event, such as "Frame 339" isn’t useful, but analyzing the set of "Frame *" events as a group can be used to find outliers in frame time. When pop...
Critical path analysis in Timing Captures
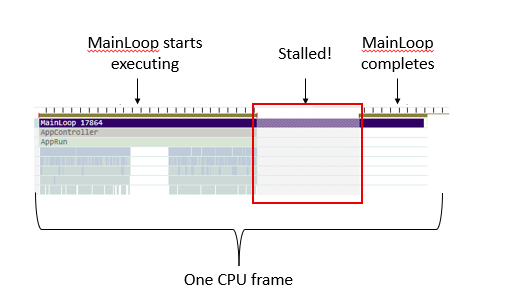
The 2201.24 version of PIX on Windows includes a new feature that uses the CPU context switch data collected during a Timing Capture to compute the critical path for a selected PIX event. The critical path is the series of events and thread dependencies that, if shortened, would reduce the overall duration of the selected event. As an example, consider the following PIX event named MainLoop 17864. This event represents one frame of CPU time. In this frame, we can see where execution begins and ends, as represented by the dark blue boxes. However, there is also a significant portion of the frame drawn in a di...
Improving PIX, thanks to your feedback!
Thanks to everyone who took the time to answer the PIX on Windows survey we sent out! It’s been awesome for us to see the sheer number of responses that came in from people all over the industry who care about our product – it’s because of you that we’re constantly striving to create a premium debugging and profiling experience on PC. We want to tell you more about the survey and upcoming improvements but first a quick note: the survey might be over, but we still want to keep hearing from you. We look at and respond to every message we get on discord.gg/directx. And every email from when you hit the Send...
PIX 2108.18: New programmatic capture APIs and much more
Today we released PIX on Windows version 2108.18, which can be downloaded here. We have also released a new version of WinPixEventRuntime, available here. This release has a lot of new features, including: This release also includes a new Visual C++ Redistributable that may request a reboot during installation. We believe that anyone who has previously installed a 2019 VC++ redist on their computer (such as the one installed by older version of PIX) can safely ignore this reboot request. As a friendly reminder, our PIX survey is still open for responses! If you haven...
File IO profiling support for archive files
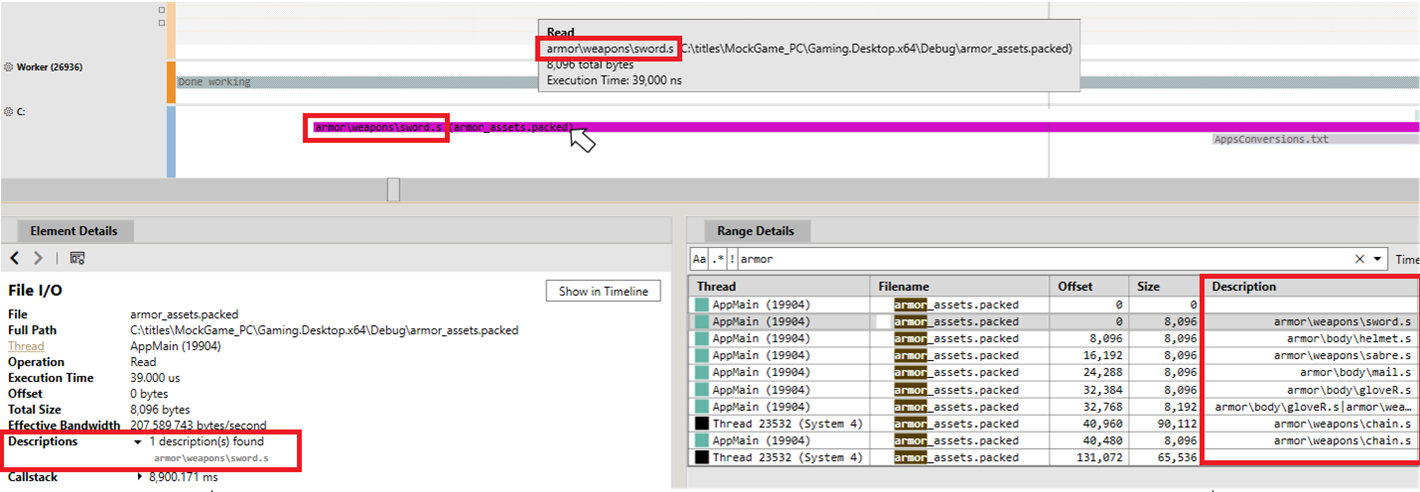
The August release of PIX on Windows adds file io profiling support for archive files to Timing Captures. This new feature allows Timing Captures to identify which individual assets are being read out of archive files such as .zip or .pak. If the File Accesses checkbox is selected before starting a Timing Capture, PIX will collect data on all file accesses that occur when the capture is running. By default, PIX shows file accesses as seen by the underlying file system. If your title packages individual assets into a composite archive file, the file io profiler built into Timing Captures can now show which ...
PIX survey – we want to hear from you!
Are you building games with DirectX 12 on Windows? We want to hear from you! Check out aka.ms/pixsurvey This survey will influence where the PIX team will make our future feature investments and help us better understand which pain points we need to address first. We also hope to better understand whether our past investments had the impact we expected. Please let us know what you think! We also want to tell everyone how we’re planning on using the feedback we hear from the survey. We’re targeting sometime in September for another post describing how what we heard will shape PIX on Windows – watch this b...
New File IO-related counters in the Timing Capture Metrics View
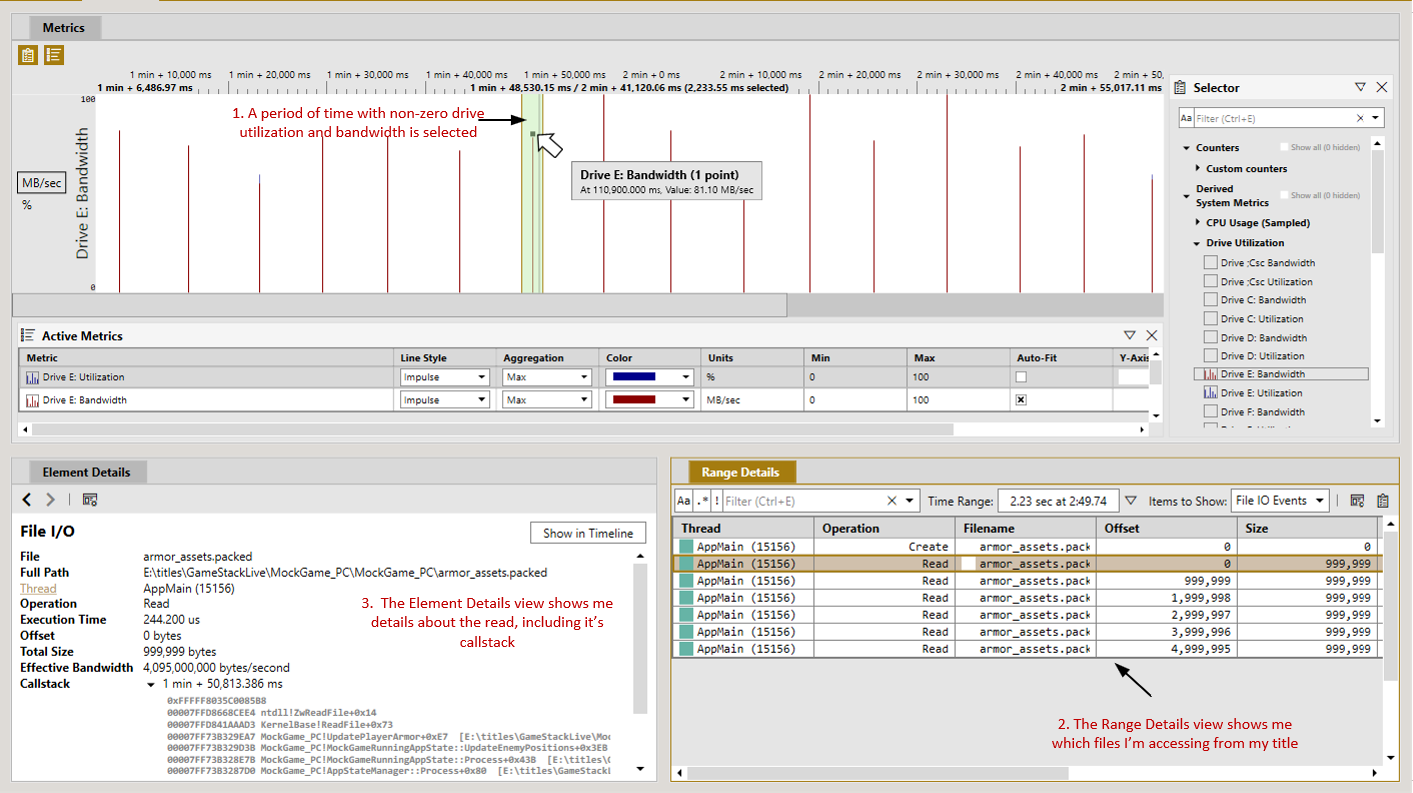
The 2107.01 release of PIX on Windows adds drive bandwidth counters to the Metrics view in Timing Captures. These new counters, along with the existing drive utilization counters and the ability to view data on all file accesses, helps give you a clear picture of how file io is impacting title performance. To collect the counters and the data on file accesses, select the File accesses checkbox before starting the capture. The drive utilization and bandwidth counters can be found under the Derived System Metrics/Drive Utilization node in the Metrics View Selector Panel. Bandwidth and utilization counte...

Symbol loading improvements to PIX Timing Captures
Have you ever opened a Timing Capture only to realize you hadn't configured your symbol path correctly? The good news is that PIX has long had the ability to process symbols after the fact. The bad news is that you had to close and reopen the capture (after fixing up your symbol path) to trigger PIX to reload the symbols. A small, but incredibly useful new feature has been added to Timing Captures in the 2107.01 release of PIX on Windows: the ability to reload symbols without having to close and reopen the capture. If you make changes to your symbol path settings while a Timing Capture is open, use the Re...
PIX 2107.01: GPU Event List Navigation Aids and Column Statistics
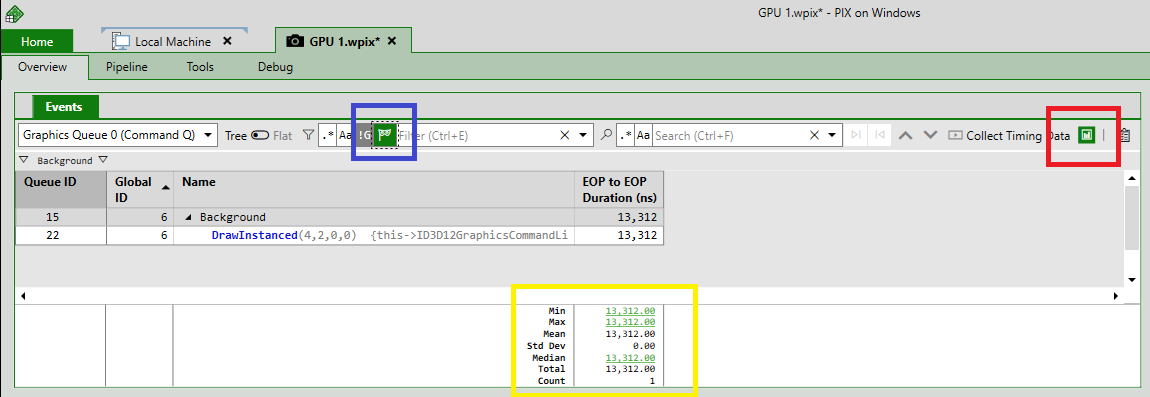
WinPIX version 2017.01 features several ease-of-use features that improve navigation on the GPU event list. Filter masks let you exclude subsets so you can focus on what you want. The new event path explorer navigates through the event hierarchy. There's a new search bar. Finally, column statistics summarize counters for you.
CPU Sample collection issue fixed in a recent Windows Update
Several people have reported that CPU samples were not showing up in Timing Captures starting a few months ago. This ended up being an issue with Windows Defender that has been fixed in a Windows servicing update that was released earlier this week. A description of the fix and how to verify that you've received it is available on the Visual Studio community site. If you have the required update and are still seeing this issue, please let us know! Steven.
Timing Capture Sampling Profiler video
I recently posted a new video to the PIX on Windows YouTube channel that describes some of the features in the Sampling Profiler in Timing Captures. This video shows how to use CPU samples to analyze CPU performance in portions of your title that aren't sufficiently instrumented with PIX events. As always, use the feedback button in the upper right corner of the PIX UI to get in touch with us to report bugs, request features, and so on. Steven.
Converting previous versions of Timing Captures
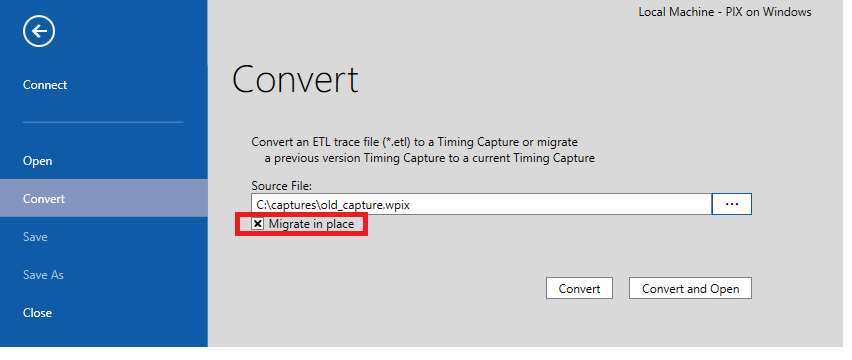
In some releases of PIX, the Timing Capture file format must be changed as new features are added. Such a format change was made in the 2104.20 release of PIX on Windows. If you attempt to open a capture that contains an older file format, a dialog will be displayed with the following text: Please use the Convert menu to migrate this capture file to the latest version. This capture file was created with an older version of PIX and is no longer supported To convert the capture, select the Convert menu under the Home tab. Enter the name of the old Timing Capture in the Source File field or use the browse ...
Usability improvements to the Timing Capture Metrics View
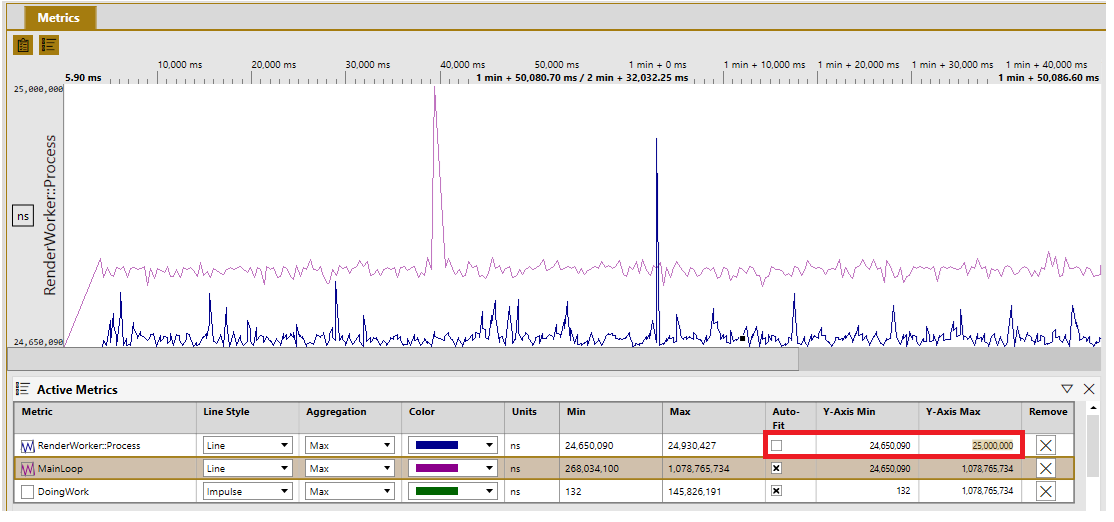
The 2104.20 release of PIX on Windows includes several usability improvements to the Metrics View in Timing Captures. These usability improvements make it easier to manage the set of metrics that are currently graphed. Metrics analysis is also improved through the ability to customize the minimum and maximum values for the y-axis for each metric. These usability improvements are provided by a new Active Metrics panel. This new panel lists all metrics that have been added to the graph from either the Selector panel or the Timeline view. The table of graphed metrics includes a checkbox that can be used to tog...
New CPU Sampling Profiler C++ Source Code View
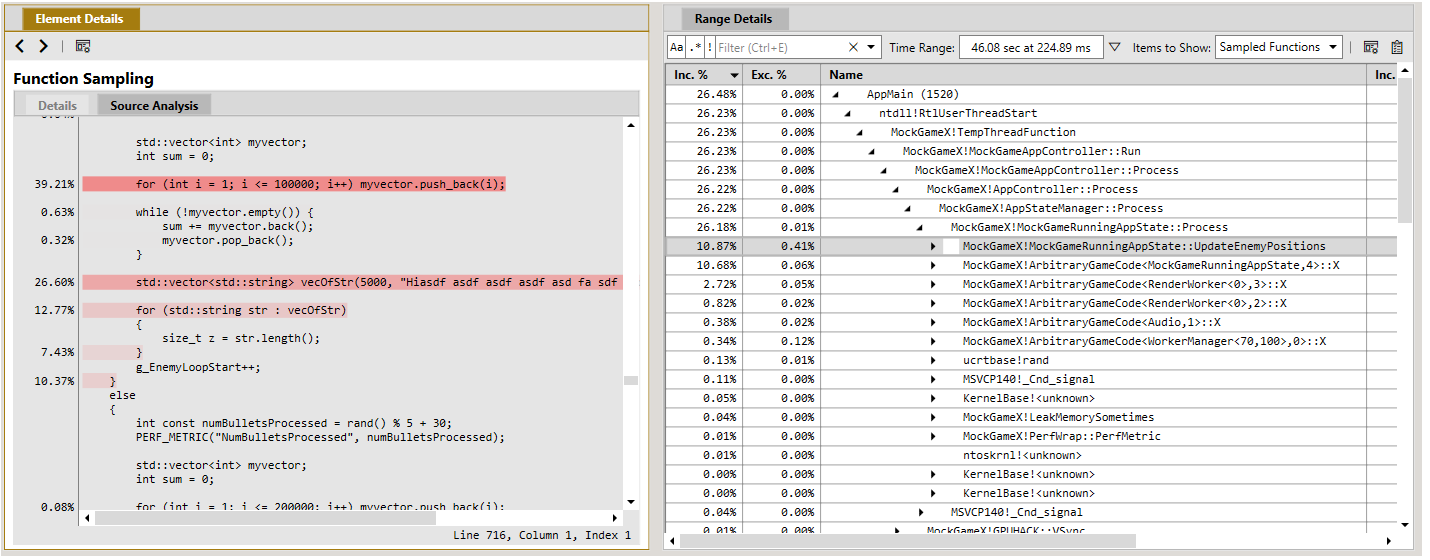
Starting with the 2104.20 release of PIX on Windows, the Sampling Profiler that is built into Timing Captures includes a C++ source code view. The source view uses coloring to attribute the collected CPU samples with source lines, thereby identifying the hot spots within a function. The source view is available when viewing Sampled Functions in the Range Details view. To view the annotated source for a function, select the function in the Range Details view and toggle the Element Details view from Details to Source Analysis as shown in the following figure. The boldness of the highlight on a given sour...

Tips & Tricks: How the Pros Use PIX to Make Their Games Better on Xbox and Windows
Today, you may have caught the PIX session titled "Tips & Tricks: How the Pros Use PIX to Make Their Games Better on Xbox and Windows" at Microsoft's Game Stack Live. If you haven't seen it yet, it's available on demand through the Game Stack Live website, and will air twice more before the end of the GSL event. This blog post contains links to all of the content mentioned in the talk, and will be updated with any common questions that arise throughout the conference. PIX Documentation Download PIX DirectX Discord DirectX 12 Twitter DirectX 12 Youtube Channel PIX on Windows at Dir...

PIX 2104.20: DirectX 12 Agility SDK Support, New Occupancy Graphs, Timing Capture Improvements
Today we released PIX version 2104.20 - adding support for all new DirectX 12 Agility SDK features including Shader Model 6.6. This release adds support for DXCompiler Slim PDBs, adds new occupancy graphs for supported GPUs, and includes an experimental feature that allows you to attach to a running process for GPU capture.
PIX 2103.16: Recently Launched Apps, Environment Variables, Camera Improvements in the Mesh Viewer
PIX 2103.10 was released today. This release adds new options to the app launch process, including launch history and the ability to set environment variables. We've added multi-cam support to the mesh viewer, and other bugfixes. Read the blog to learn more!
PIX Timing Captures require full PDBs
PIX Timing Captures require a title’s PDBs to be generated using the /DEBUG:FULL linker switch. PDBs generated with the /DEBUG:FASTLINK linker switch are not sufficient. Note that, depending on the version of Visual Studio you are using, the linker switch /DEBUG specified without the FULL or FASTLINK option, may default to FASTLINK. I realized the other day that PIX isn't displaying a warning message if it finds a FASTLINK PDB. We'll add a warning to PIX in an upcoming release, but in the meantime I thought I'd make a note of it here as a few customers have contacted us recently about this issue. More deta...
Finding memory leaks using Timing Captures
PIX Timing Captures include several analysis features aimed at making it easy to find memory leaks in your title. These features, coupled with the ability to take captures for extended periods of time, are a compelling combination for finding leaks, even those that can take a considerable amount of time to manifest themselves. To enable the leak tracking features, select one or both of the memory tracking options when starting a Timing Capture. The easiest way to visualize the amount of memory in use over the duration of the capture is to use the Metrics View. The Memory Usage counters under the Deriv...
WinPixEventRuntime 2102.09: Minor fixes and optimizations
It’s hard to believe it’s been over a year since our last update to WinPixEventRuntime! This update brings a couple of minor fixes and optimizations, which should hopefully lead to a slightly better quality of life when using the runtime 😊 You can download the new runtime here. Release notes: Known Issue: As always, feel free to reach out to us with any questions or feedback on our Discord Server, or simply use the little feedback button in the top right corner of your PIX window.
Filtering CPU Samples by one or more PIX Events
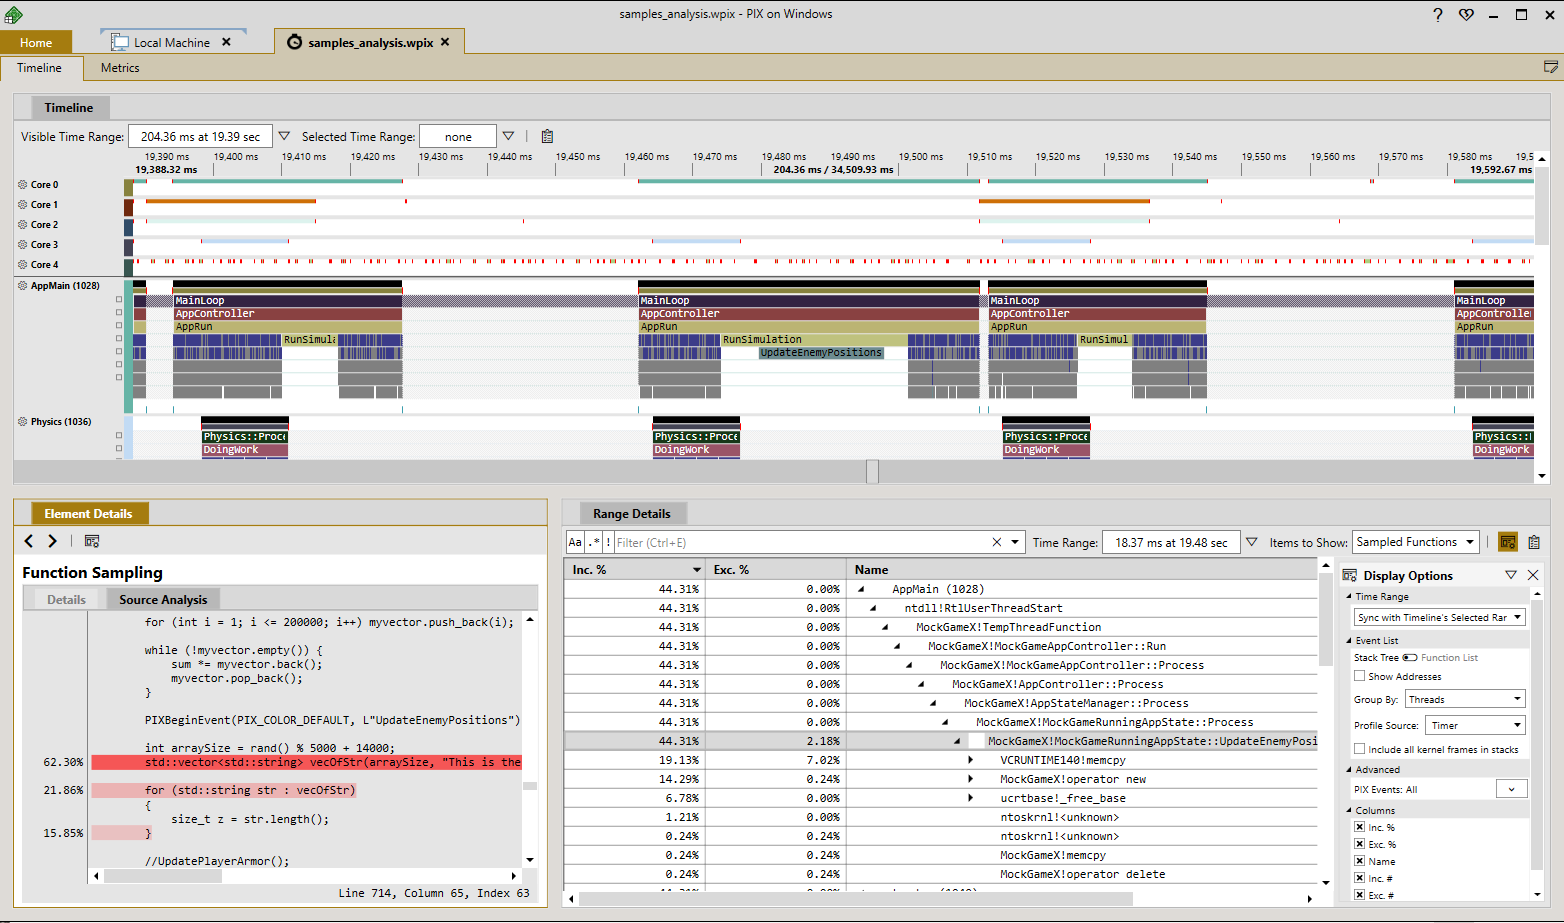
The Sampling Profiler included in the 2101.27 release of PIX on Windows includes a novel new feature that allows you to filter the analysis of CPU samples down to just those samples that were collected during the time when one or more PIX events was running. This capability is particularly useful for seeing which functions ran the most frequently, or took the most time, in places where your title is only sparsely instrumented with PIX events. For example, the following picture shows several CPU frames in the Timeline view of a Timing Capture. The top-most frame event is called MainLoop. It's clear that the ...
Function Summary and Callgraph captures are now deprecated
Function Summary and Callgraph captures are deprecated starting with the 2102.27 release of PIX on Windows. The workflows supported by these legacy capture types have been replaced with enhancements we're recently made to the Sampling Profiler that is part of Timing Captures. These enhancements include the ability to group the tree of aggregated CPU samples by thread or core, and the ability to designate a function as a focus function. In addition, the integration of function data into Timing Captures enables some profiling scenarios that weren't possible before, such as the ability to restrict the set of C...
PIX 2101.27: AMD raytracing counters, DXIL improvements, and more
Today we released PIX version 2101.27, which can be downloaded here. This release adds support for new GPUs and counters to AMD’s PIX plugin, improves the DXIL debugging experience, contains several enhancements to the CPU sampling profiler, and adds many other smaller improvements. AMD plugin improvements This release includes a new AMD plugin. This plugin adds support for AMD RDNA™ 2 Radeon™ RX 6000 series GPUs, which means that PIX features such as Event List Counters and High Frequency Counters are now available on these GPUs. The plugin also adds support for new raytracing counters on RX 6...
New documentation page: Analyzing CPU samples in Timing Captures
Hi PIX users, I've added a new page to our PIX for Windows documentation set. The new page describes how to use Timing Captures to analyze CPU samples. Collecting CPU samples allows you to analyze how functions within your title are impacting performance. We've been steadily adding new features to PIX's sampling profiler and will continue to do so in the new few releases. Steven Pratschner - PIX Team
Analyzing CPU samples in Timing Captures
PIX includes a CPU sampling profiler that can optionally be run when taking a Timing Capture. Collecting CPU samples allows you to analyze how functions within your title are impacting performance. Viewing CPU samples is useful in several scenarios. For example, CPU samples can help you determine what code is running on a thread or core for portions of your title that either have sparse or no instrumentation with PIX events. Diagnosing performance issues using CPU samples in this scenario is more efficient than having to add additional instrumentation to your title, rebuild and redeploy. In addition, lookin...
New documentation page: Analyzing Win32 File IO performance using Timing Captures
Hi all, I've added another page to our PIX for Windows documentation set. The new page describes how to use Timing Captures to analyze file io performance. The addition of file io data to Timing Captures replaces the separate file io capture type that we removed from PIX a few releases ago. Steven Pratschner - PIX Team
Analyzing Win32 File IO performance in Timing Captures
PIX Timing Captures include an option to collect data on your title’s use of the Win32 file IO APIs to access files. The data collected for calls to APIs such as ReadFile and WriteFile include the name of the file being accessed, and the offset, size and duration of the access itself. Full callstacks for each file access are also recorded. If your title packages individual assets into a composite archive file, PIX can show which assets within the composite file were accessed if a mapping file is provided. When file IO data is collected, PIX also computes drive bandwidth and utilization metrics. File IO da...
New documentation page: Analyzing Memory usage and performance in Timing Captures
Hi PIX users, Over the last few releases we've been extending our memory profiling features in Timing Captures. I've written a new documentation page that describes how to use Timing Captures to analyze memory usage and performance. The addition of memory data to Timing Captures replaces the separate memory capture that we removed from PIX a few releases ago. Feedback appreciated as always. Steven Pratschner - PIX team
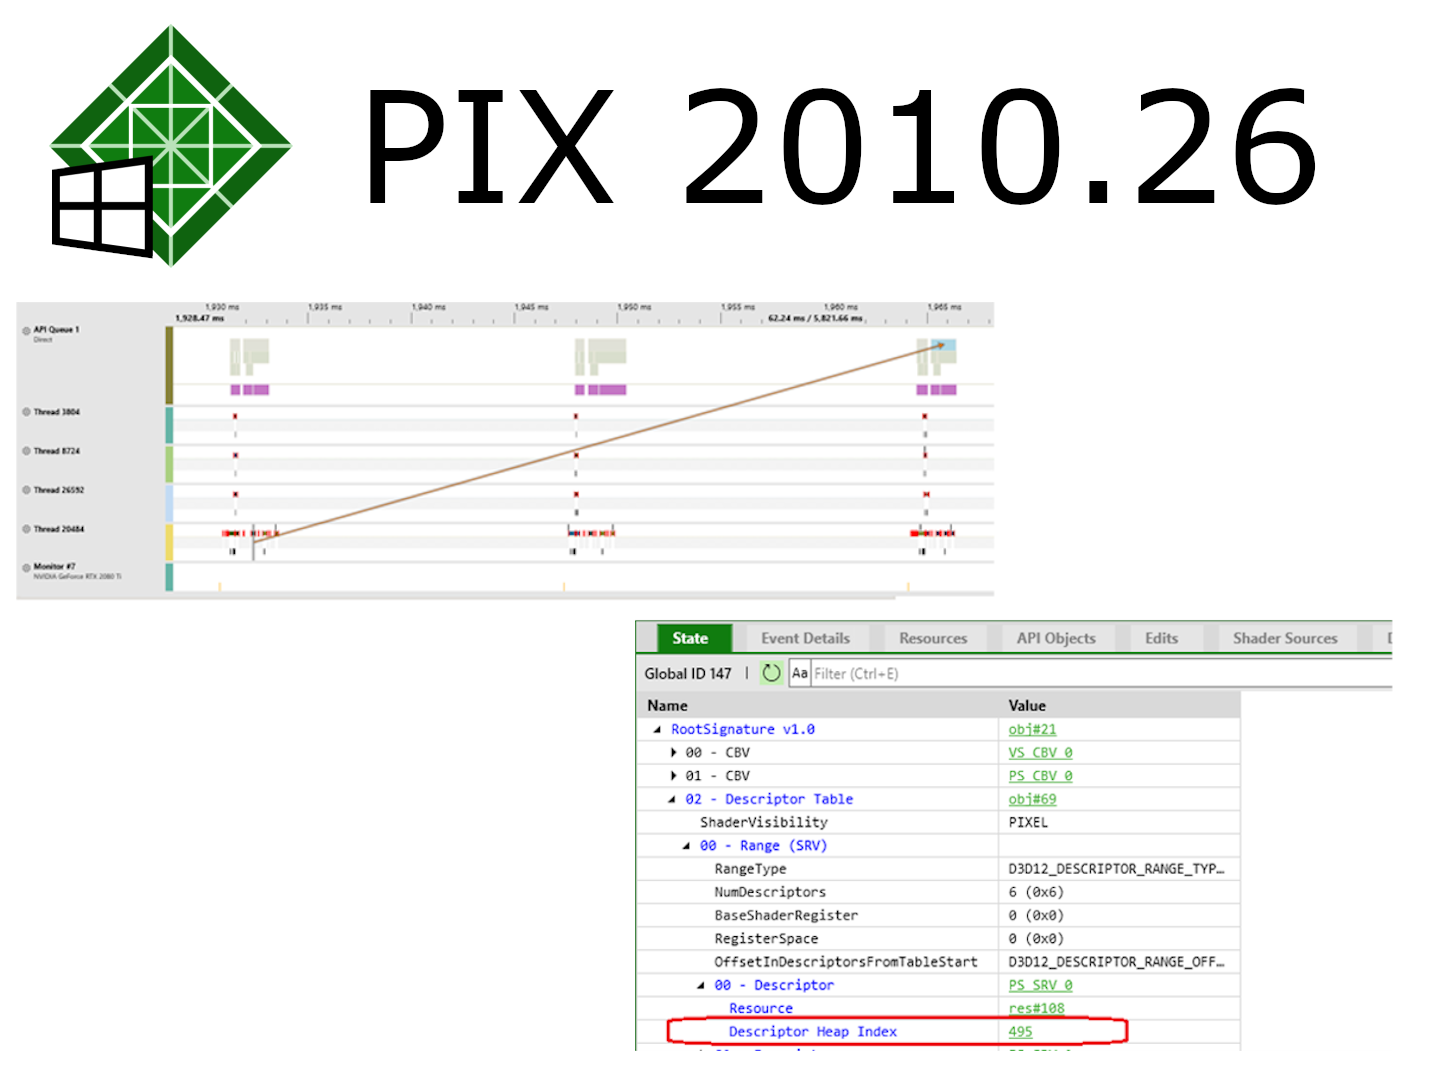
PIX 2010.26 – Updated Command List Execution View & Descriptor Heap Viewer
Today we released PIX 2010.26This release contains better visualizations of Command List executions in timing captures, a brand new Descriptor Heap viewer, and fixes for several user-reported issues.
Analyzing Memory usage and performance in Timing Captures
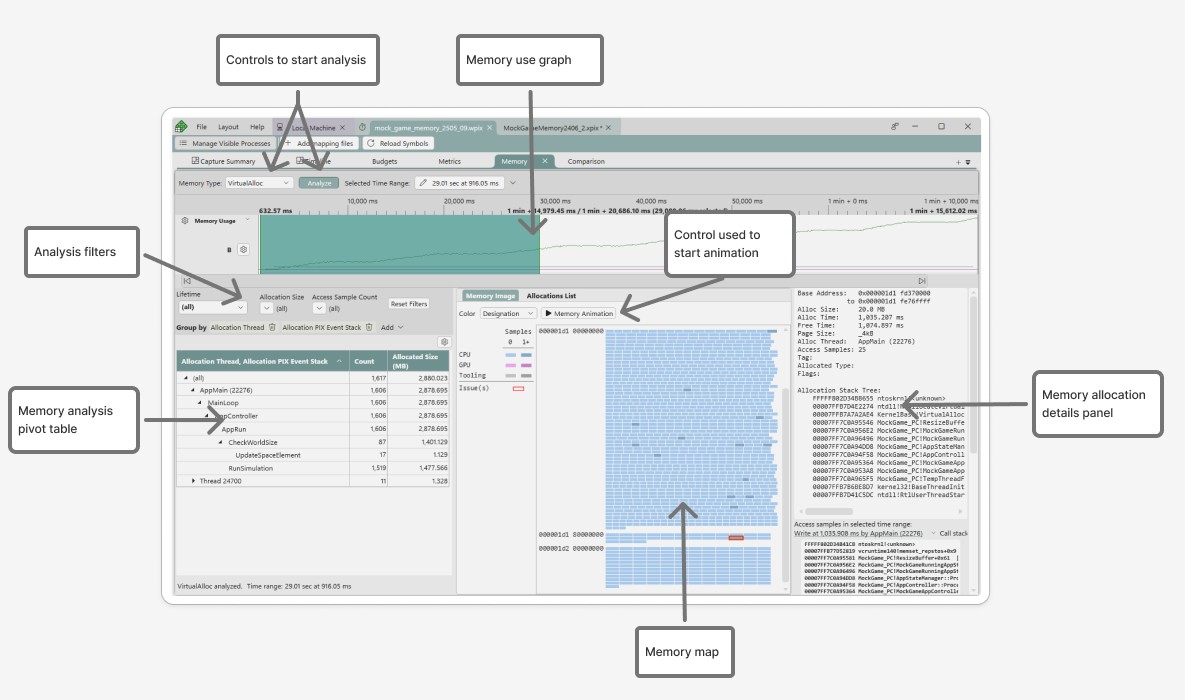
PIX Timing Captures include options to record information on the memory allocations and frees made while the capture is running. This memory data is used to compute a set of memory-related counters that can be graphed in the Metrics View and to build an allocation stack tree and virtual memory allocations list in the Range Details view. The combination of the memory counters and the allocation tree can help you analyze your title’s memory usage and to find memory leaks. A typical usage pattern is to use the counters in the Metrics View to find periods of time where something unexpected is occurring, then use t...
Capturing GPU Work
One of the most significant changes we’ve made in PIX-2008.26 has been to make the GPU capture process focus on capturing GPU work rather than API calls. This blog post will explain how PIX used to work, describe some of the drawbacks with this approach, how it works now, and the benefits we get from it. Hopefully, you’ll find this discussion of PIX’s implementation interesting and be able to use this information to better interpret the data provided by PIX. Capture Layer PIX on Windows supports GPU Captures by inserting a capture layer in-between the application and D3D. For example, PIX intercepts calls to D3...
Debugging D3D11 apps using D3D11On12
PIX is designed for use with Direct3D12 applications. That said, PIX can take advantage of Windows’ ability to convert Direct3D11 API calls into Direct3D12 calls, and thereby allow you to view your Direct3D11 application as if it were Direct3D12. It’s easy to use: just click this check box here before launching your game under GPU capture: PIX will also work if you’ve used the d3dconfig (available as of Windows May 2020 Update) tool to turn on D3D11On12 yourself via a command like d3dconfig apps ‑‑add MyGame.exe d3dconfig device force-d3d11on12=true Either of these mechanisms turns on the D3D11On12 laye...
GPU Captures: Support for D3D video
PIX on Windows version 2008.26 added support for taking GPU Captures of applications that use D3D video APIs. This means that you can now use PIX to capture regions of GPU work that involve videos, such as title screens in games or videos playing in web browsers. In this blog post, we’ll talk about how PIX captures video workloads and what is and isn’t supported. Summary In-Depth Walkthrough Here is a screenshot from a multi-frame GPU Capture of Microsoft Edge playing a video. This was captured using D3D11On12, but the workflow in PIX would be the same if we captured an ap...
Changes to the capture experience
Summary As some of you have likely noticed by now, PIX.2008-26 comes with some improvements to the overall capture and Start-Analysis experience, made possible by the rewrite of the capture layer within PIX on Windows. This is a list of the major changes – read on for a detailed explanation! API selection change - no more "ignore D3D11" Background In previous versions of PIX, there were three different options when launching your application: Default, D3D12 (force 11on12), and D3D12 (ignore D3D11). However, PIX only captures D3D12 work, so you might be wondering: what’s with the “ig...
GPU Captures: How we support placed and reserved resources
Quick Links Summary Recap: placed and reserved resources in D3D12 In D3D12, there are three types of resources: A committed resource has its own dedicated backing memory that isn’t shared with any other resource. This makes them relatively easy for PIX to capture, so we won’t discuss them here. Placed and reserved resources don’t have their own dedicated backing memory. Instead, applications must create ID3D12Heap objects that own the backing memory, and applications must define “mappings” between placed/reserved resources and the ...
PIX 2008.26: Performance Improvements
Earlier today we released PIX on Windows version 2008.26, featuring a 100,000+ line rewrite of our component that takes GPU Captures. Morgan has described this release’s functional improvements in her blog post, but here we’ll take a closer look at the new performance improvements. Recap: GPU Captures in PIX on Windows As a reminder, developers can use GPU Captures in PIX to record the D3D12 GPU work performed by a region of their game or application, and then later play back the work in a controlled environment. This controlled environment allows developers to debug their GPU work or to analyze its...
PIX Release 2008.26 – Our biggest update to GPU captures since 2017
PIX 2008.26 is released today. Our biggest update to GPU captures since 2017, this release contains significantly increased framerate improvements at capture time, capture-replay performance improvements, and broader application compatibility.
New documentation page: Finding and Analyzing Context Switches
Hi PIX users, I've written a new documentation topic on how to use the features in Timing Captures to find and analyze context switches (here). Feedback and questions appreciated as always. Thanks, Steven Pratschner - PIX team
Analyzing stalls and context switches in Timing Captures
A context switch occurs when a CPU core switches from executing code on one thread, to executing code on a different thread, or going to idle. When the OS switches the thread that is running on a CPU, it must save and restore state, both for the thread that is being switched out, and for the thread that is being switched in. This state, or context, includes data such as the current value of all registers, the program counter and so on. Saving and restoring this state is an expensive operation from a performance perspective, so reducing the overall number of context switches is often key to achieving predictable, ...
PIX 2007.29 – Dark Theme, bug fixes
Today we released PIX version 2007.29 which can be downloaded here. This release introduces Dark Theme, a change to timing capture file formats, and includes several bug fixes. Dark Theme PIX now has a Dark Theme! You can enable Dark Theme in the Theme tab in the Settings menu. We hope this often requested feature will keep eyes feeling fresh while working in the dark, and allow you to choose a theme that matches other apps in your toolchain. Theme preference persists between app launches. Note that implementation of dark theme is incomplete for the mesh viewer and message dialog boxes. If you run ...
PIX 2006.26 – Fence Signal/Wait Arrows in GPU Captures
Today we released PIX 2006.26 which can be downloaded here. This release contains support for fence signal-wait arrows in GPU captures, document tab behavior improvements, buffer viewer enhancements, and many bugfixes. Fence Signal-Wait arrows for GPU captures GPU captures now track and visualize fence signals and waits to help you understand synchronization issues. You can also use this feature to spot opportunities for async compute work, by finding work on the graphics queue that can’t overlap with any async compute work due to signals/wait patterns. Buffer Viewer & Memory Viewer...
PIX 2004.27 – Improved struct support in the Buffer Viewer, CPU Memory and File IO Data in Timing Captures
Today we released PIX 2004.27 which can be downloaded here. This release contains improved support for structs in the Buffer Viewer, and support for CPU memory allocation data and file I/O data in Timing Captures. This version also includes an updated plugin for AMD GPUs, and supports a new pixtool flag to help automate grabbing an unknown number of captures. Improved struct support in the Buffer Viewer The format specification syntax used in the buffer viewer has been enhanced. It now supports true nesting of structures, as well as arrays. With these additions, the default format descriptions of constant buffe...
PIX 2003.26 – DirectX 12 Ultimate and DXIL debugging
Today we released PIX 2003.26 which can be downloaded here. This release contains support for DirectX 12 Ultimate, source-level debugging of DXIL shaders, a new GPU capture timeline, CPU/GPU event correlation in new timing captures and many more bug fixes and performance improvements. DirectX 12 Ultimate Support PIX on Windows now has initial support for all the DirectX 12 Ultimate features: Variable Rate Shading support in PIX was first added in PIX 1903.26 and continues to be supported now! Mesh shader output viewer in action: DXIL Source Level Debugging We’ve updated PIX’s shader de...
WinPixEventRuntime 2001.27
Today we released WinPixEventRuntime 2001.27 on Nuget. This release contains the following bug fixes and updates: