
The Butterfly View in Function Summary and Callgraph Captures
The default layouts for Function Summary and Callgraph captures include a Butterfly View. The Butterfly View shows you the callers and callees for the function that is currently selected in the main events list.
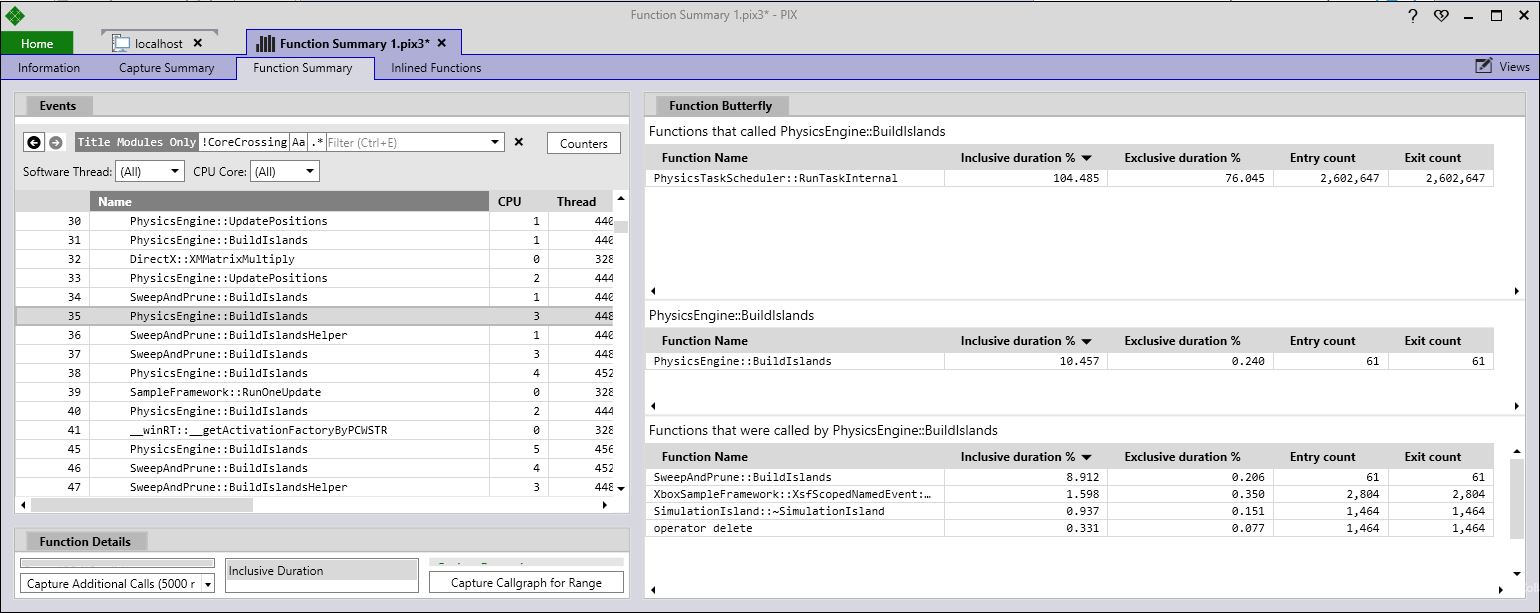
The selected function is shown in the middle of the Butterfly View. Tables on the top and bottom of the view show the callers and callees, respectively. The following figure shows the contents of the Butterfly View when PhysicsEngine::BuildIslands is selected in the main event list.
Double clicking on any row in the Butterfly View will cause the data in the view to be centered around that function. The function you double clicked on will become the center row and it’s callers and callees will be displayed above and below it. Double clicking on any row in the butterfly view will also select that function in the main event list. If the function ran on multiple threads and/or cores, multiple rows in the event list will be selected: one for each combination of thread and core.
The counters shown in the Butterfly View are the Inclusive and Exclusive Duration percentages and the call counts for each function. The data is aggregated across cores and across the entire duration of the callgraph capture. Values greater than 100 percent are common and indicate that a function is in use by more than one core. Inclusive duration can theoretically be as high as 100% multiplied by the number of cores on your PC. However, a more realistic example would be a function that has an inclusive percentage of 20 for one core, and 90 for another core, so the butterfly view would show 110%.
Calling functions and called functions are also aggregated across the capture. So if a function calls both GetInt() and GetFloat() at some point during the capture, but not in the same call tree, both GetInt() and GetFloat() will appear as called functions.