Callgraph Captures (Deprecated)
PIX Callgraph Captures are deprecated starting with the 2101.27 release of PIX on Windows. The ability to take Callgraph Captures will be removed in an upcoming release of PIX.
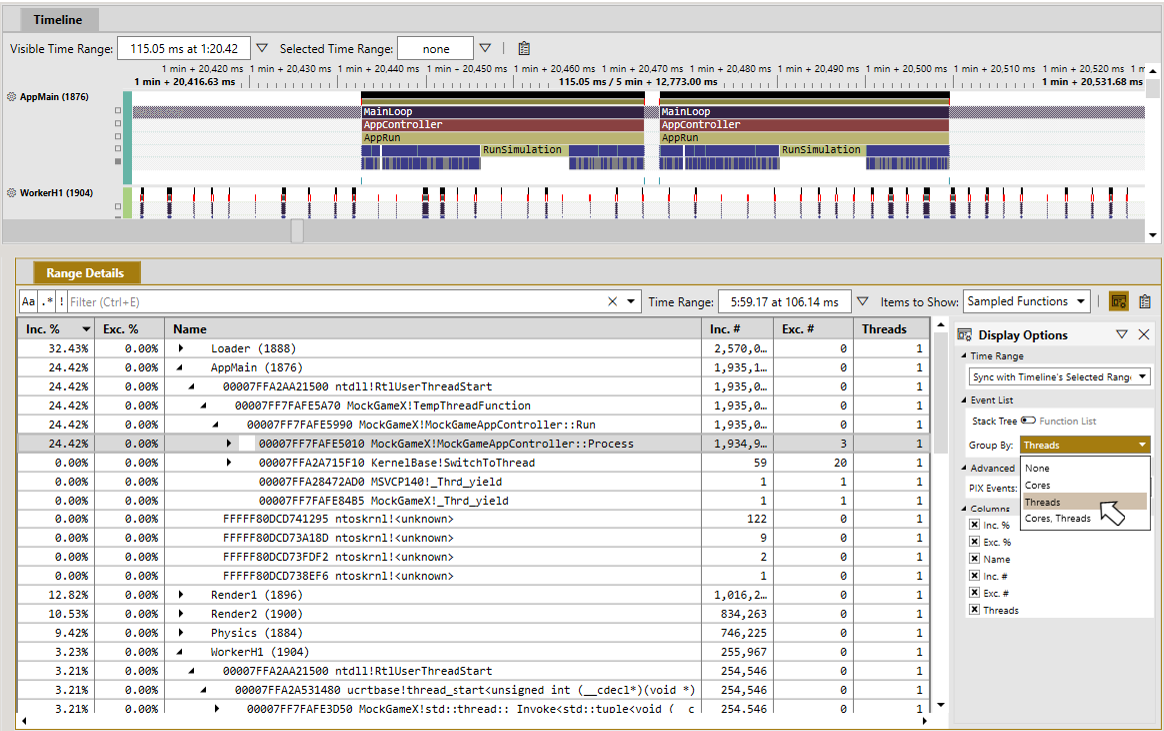
The primary profiling workflow previously provided by Callgraph Captures is now provided by the Sampling Profiler that is part of Timing Captures. Callgraph Captures were commonly used to analyze the full callgraph of a specified function to find the call path called most frequently, the path that took the longest to execute and so on. The Sampling Profiler now provides this capability via a callstack tree that is created by aggregating the CPU samples collected while a Timing Capture is running. The stack tree can be accessed by selecting the Sampled Functions value from the Items to Show dropdown in the Range Details view as shown in the following figure.

Callgraph Captures were primarily used to examine the calltree for a single function. This capability is provided in the Sampling Profiler by allowing you to view the calltree based on a focused function. Selecting a function as a focus function rebuilds the stack tree based on all calls to that function. The focused function becomes the top node in the tree with its entire calltree displayed as children. To select a function to focus on, right click on a function in the Range Details view and choose the Set Focus Function from the context menu.

If you should need to access the deprecated Callgraph Captures for any reason, you can do so by selecting the Enable legacy Callgraph and Function Summary capture types checkbox on PIX’s Settings page.

Overview
Callgraph Captures provide the full callgraph for a specified function along with the callgraphs for everything that was running in parallel at the time the function was captured. A primary use of a Callgraph Capture is to find the most expensive path through the graph for your specified function. This path is known as the hotpath.
Initiating a Callgraph Capture
Callgraph Captures are taken using one of the following two workflows:
- From Function Summary Captures.
- From the Callgraph button on the device connection tab.
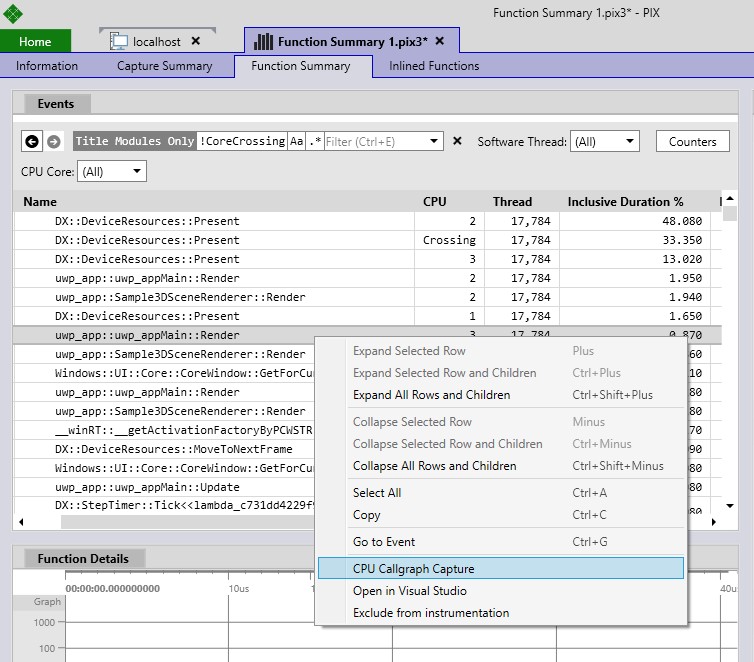
To start a Callgraph Capture from a Function Summary Capture, select the function you’d like to drill into from the event list, right click, and select “CPU Callgraph Capture”.
In some cases, you know ahead of time which function you’d like to capture. In this case, you can specify the function directly rather than having to take a Function Summary Capture first. To directly specify the function you’d like to capture, click on the Callgraph Capture button on your device connection tab. A dialog will be displayed that lists all of the functions in your title.
The Function Selector dialog includes a few options you can use to filter the set of functions shown in the dialog. The options at the bottom of the dialog let you hide templates and lambas and allow you to specify a regular expression to be used when searching the contents of the dialog.
To take a Callgraph capture, find the function you’re interested in, select it, and choose Done.
After the capture starts PIX will monitor your title watching for the first time the function you specified is called. If the function is called within a default amount of time, PIX will capture it’s callgraph and open the capture. If the function is not called, you’ll see a timeout error.
Callgraph captures open to a tab called a landing page. This initial page provides a textual description of the rest of the tabs in the capture.
The first tab you’ll likely want to look at after the landing page is the Capture Summary tab.
Capture Summary Tab
The Summary Tab is intended to help you quickly identify the most expensive functions in your capture as well as the hot path through the callgraph.
This information is provided for each thread that executed title code as the capture was running.
As with the Summary Tab shown for
Function Summary captures, the Summary Tab for Callgraph captures includes hyperlinks for source locations as well as information about thread affinities and inline functions.
Callgraph Tab
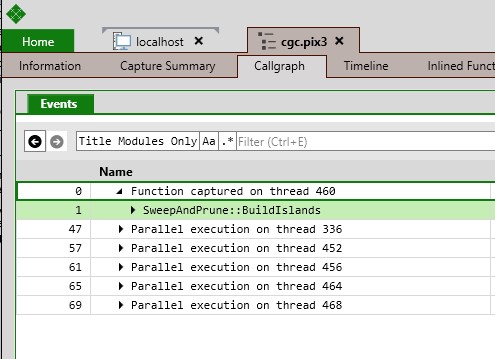
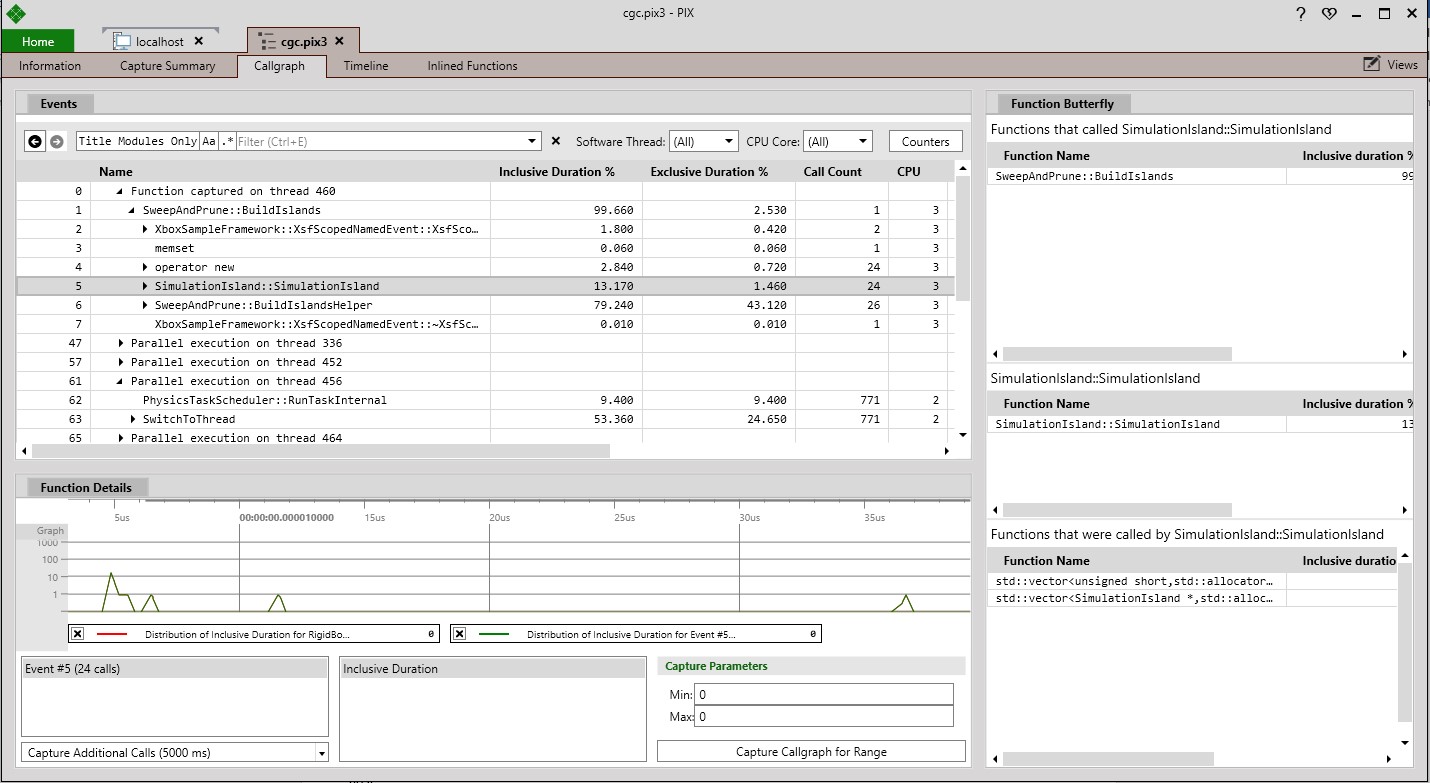
The events list on the Callgraph tab contains one top level row for the function you captured and one top level row for any other functions that were executing in parallel with the function you captured. In this example, PIX captured the callstacks for 5 functions that were running at the same time as the captured function (SweepAndPrune::BuildIslands in this case).
Each row in the event list (other than leaf nodes) can be expanded and collapsed to drill into the call tree. As with the event lists for other CPU capture types, you can customize which columns are displayed by choosing a set of Counters, sort by any column, and filter the contents of the event list using the filter bar.
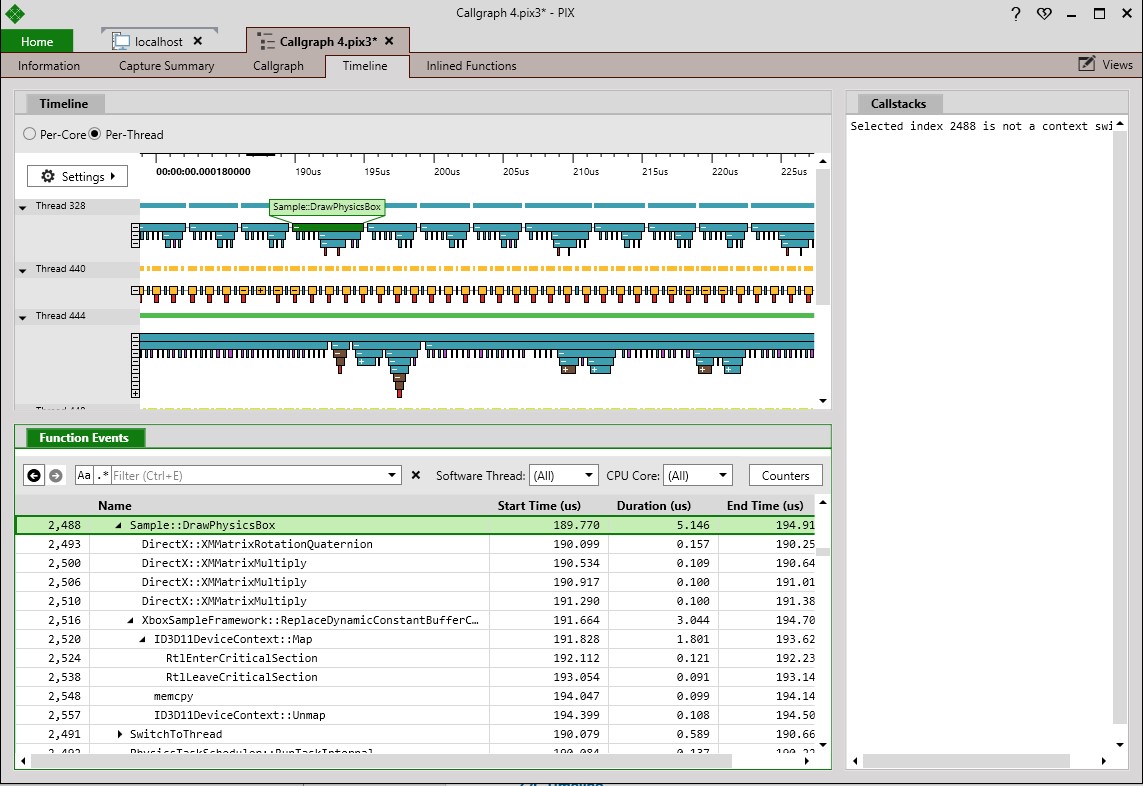
Timeline Tab
The Timeline tab contains the same callgraph information as the event list on Callgraph tab but lays it out visually on a timeline. The timeline contains one lane for each thread (or core) that ran code during the capture. The timeline control in the Timeline tab is the same control used in
Timing Captures. Features from the Timing Capture timeline such as the ability to pivot the data per-thread or per-core, selection synchronization between the timeline and an event list, and the display of callstacks on context switches are all provided in the Callgraph timeline as well.
Displaying the callgraph data on a timeline makes it easy to see how long each function in the callgraph takes to execute relative to others. It’s also easy to see which functions are running in parallel with which other functions, when and why threads are scheduled in and out, and so on. When a context switch is selected in the timeline, PIX will show you the callstack for the threads that are switching in and out, along with any readying thread information.