
PIX Timing Captures include options to record information on the memory allocations and frees made while the capture is running. This memory data is used to compute a set of memory-related counters that can be graphed in the Metrics View and to build an allocation stack tree and virtual memory allocations list in the Range Details view.
The combination of the memory counters and the allocation tree can help you analyze your title’s memory usage and to find memory leaks. A typical usage pattern is to use the counters in the Metrics View to find periods of time where something unexpected is occurring, then use the Metrics View’s context menu to navigate to that period in the Timeline to view the allocation stack tree.
Collecting memory allocation data
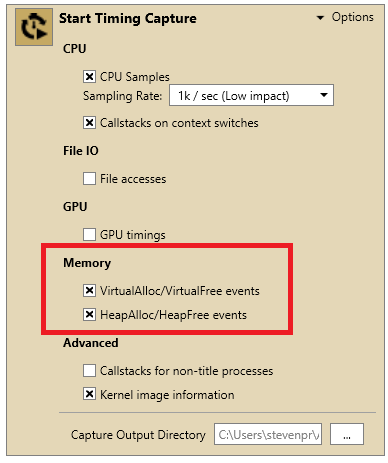
The Timing Capture options pane contains checkboxes you can use to select whether to collect memory data for calls to VirtualAlloc and HeapAlloc.
To collect memory allocation data, select the allocators you’d like to track and start the capture.
Memory counters in the Metrics view
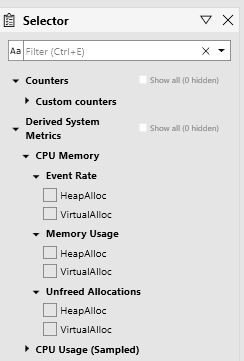
When one or more of the memory collection options are enabled, PIX gathers and computes several memory-related counters and adds them to the Metrics View. Three sets of counters are computed:
- Event Rate
- Memory Usage
- Unfreed allocations
All of these counters are separated by allocator and can be found in the CPU Memory section of the Metrics View Selector panel as shown in the following figure.
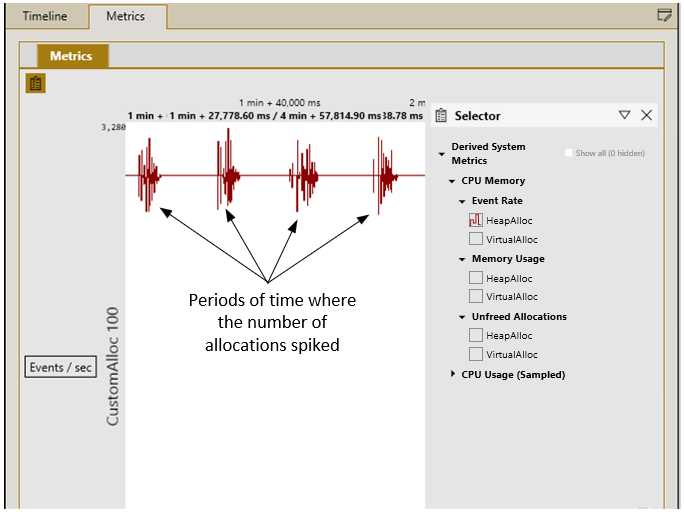
The Event Rate counters show the rate of memory allocations over the duration of the capture for each allocator. For example, the following figure shows there are numerous points in the time where the HeapAlloc allocator makes bursts of memory allocations.
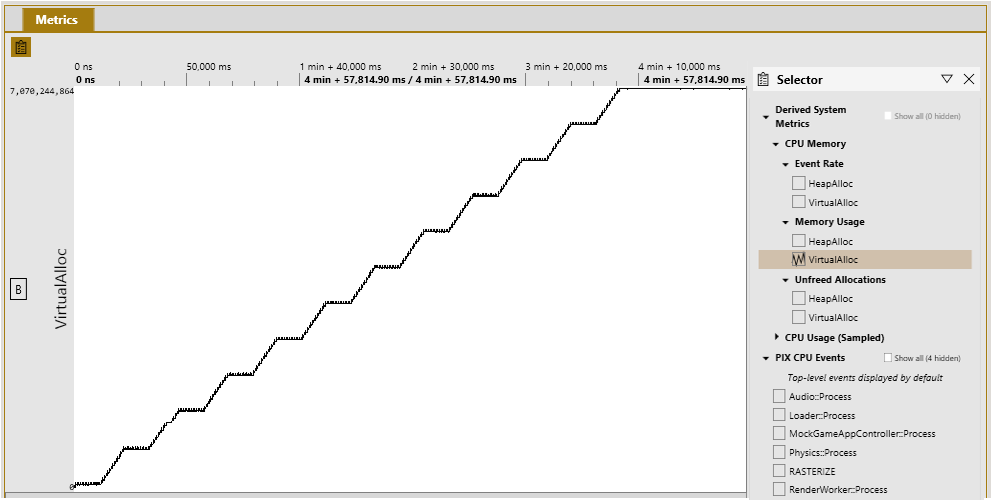
The Memory Usage counters shows the amount of memory used over the duration of the capture for each allocator. For example, the following figure shows a steady stair step pattern of growth for allocations made using VirtualAlloc.
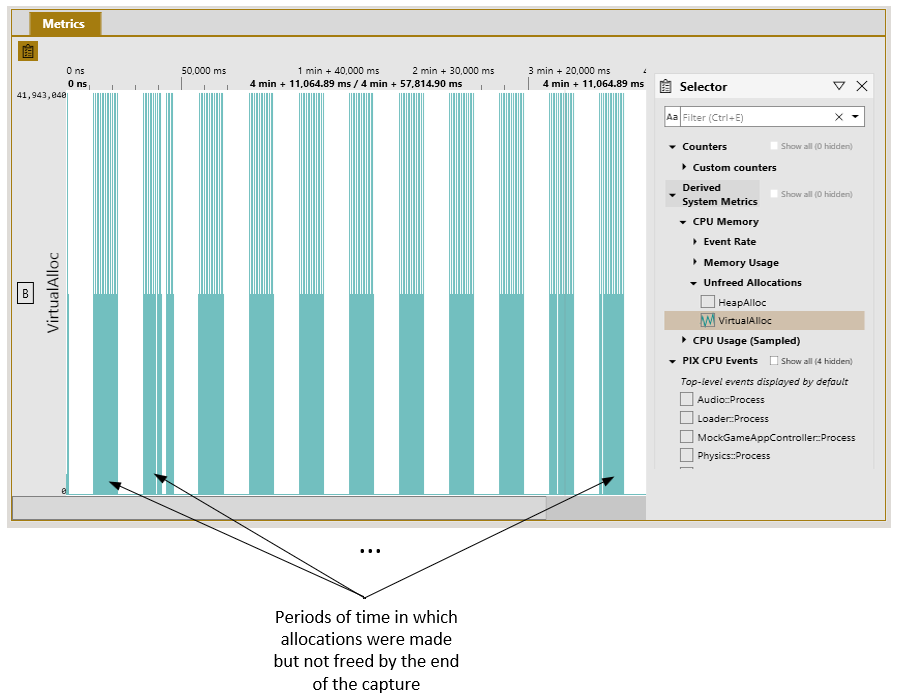
The Unfreed allocations counter displays the number of unfreed allocations in the capture, shown by the time at which the allocation was made. For example, the following figure shows several points in time where allocations were made but were not freed before the end of the capture.
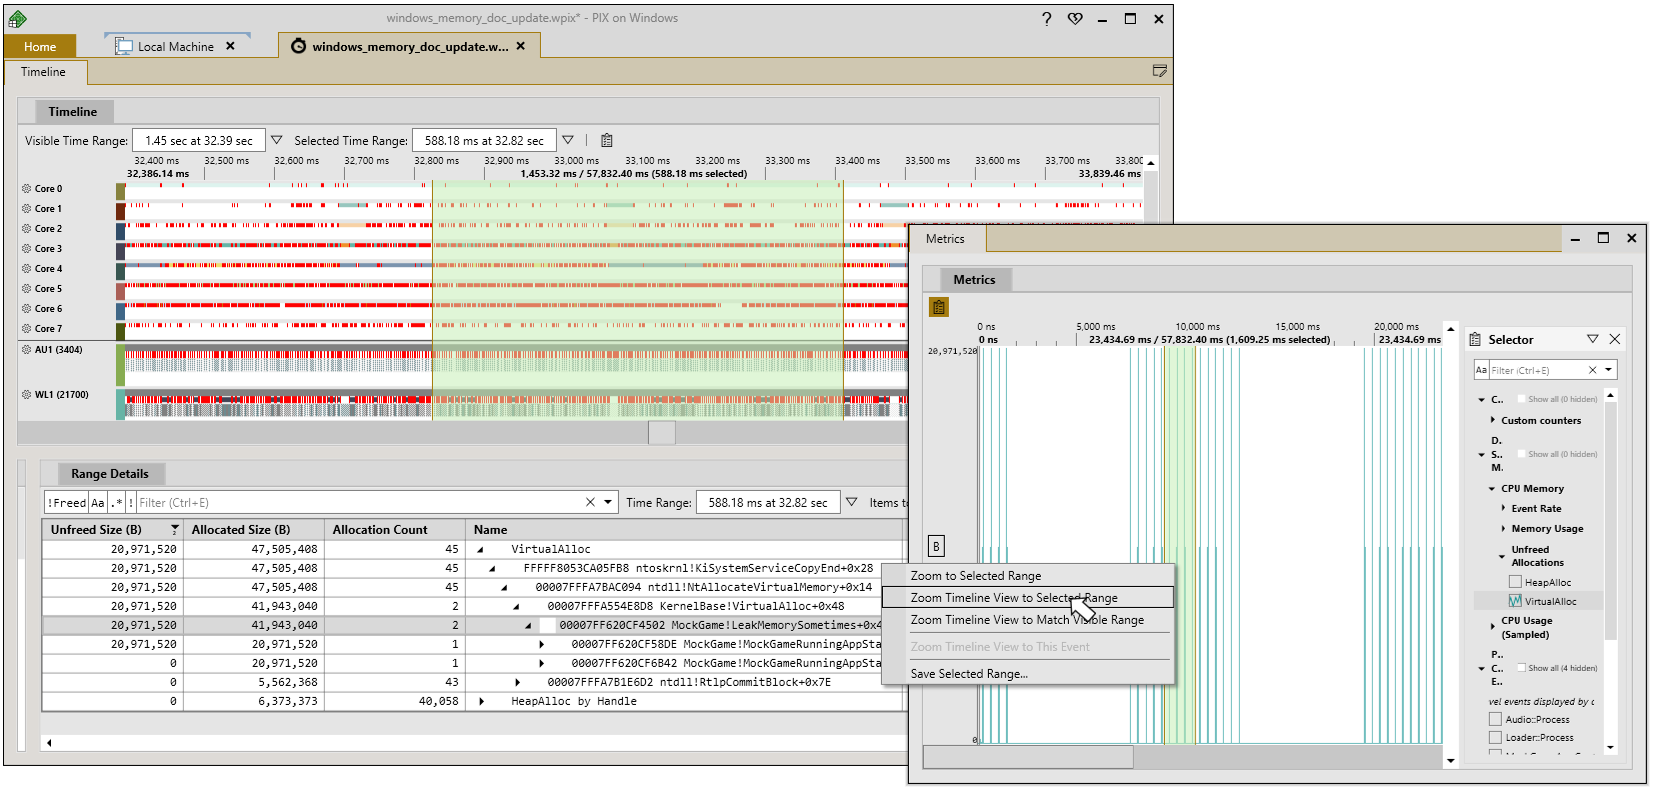
After using the Metrics View to identify periods of time that may be interesting from a memory perspective, the context menu can be used to navigate to that period of time in the Timeline. In the following figure, a period of time in which unfreed allocations occurred is selected in the Metrics View and then synchronized with the Timeline. When in the Timeline, the Range Details view can be used to view the Allocation Stack Tree. In this example, Range Details shows a non-zero Unfree Size for VirtualAlloc as expected. Expand the Allocation Stack Tree to find the callstacks responsible for the unfreed memory.
Analyzing memory allocations in the Range Details view
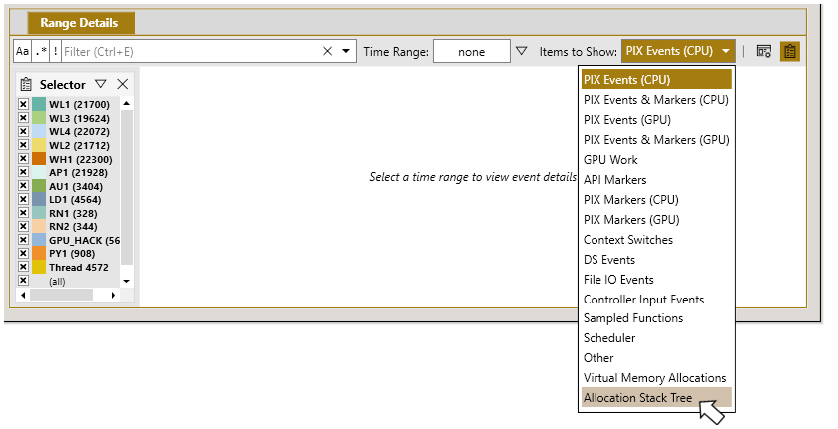
When collecting memory data, PIX records the callstack for each memory allocation and free. The callstacks are then aggregated into an overall allocation tree. The allocation tree can be viewed in Range Details view in Timing Captures. To view the tree, select a range of time in the Timeline, then select Allocation Stack Tree from the Items to show dropdown. The allocation tree displayed in Range Details will include all allocations that occurred within the selected time range.
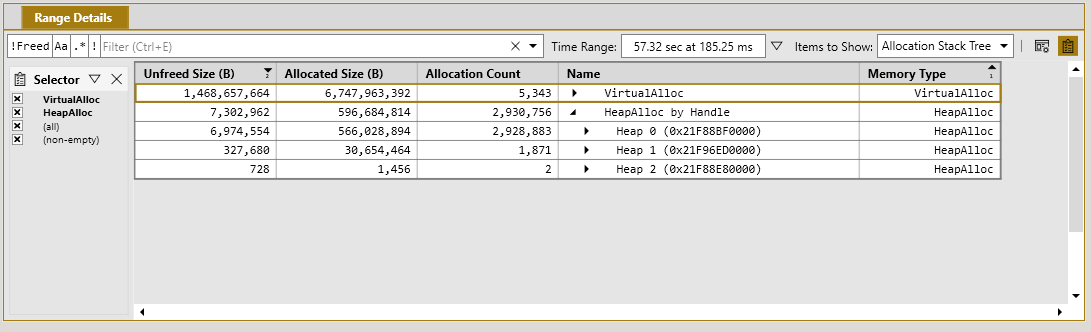
The stacks displayed in Range Details are grouped first by allocator. This grouping keeps allocations and frees made with HeapAlloc separate from those made using VirtualAlloc. Each allocator is a top level node in the allocation stack tree. Use the Selector panel on the left hand side of the view to specify which allocators should be displayed in the tree.
The HeapAlloc node is further grouped by heap handle, making it easy to analyze memory usage on a per-heap basis.
The following figure shows the organization of the Allocation Stack Tree.
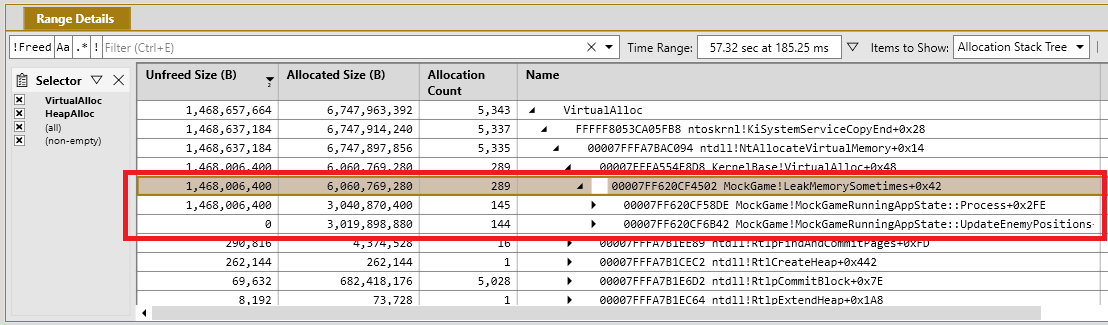
Expanding the tree displays the aggregated stacks for all allocations attributed to that allocator for the selected time range. The values for the Unfreed Size, Allocated Size, and Allocation Count columns are always relative to the node in the tree that is currently selected. The following picture shows that the function LeakMemorySometimes made 289memory allocations, and that 1,468,006,400 bytes from those allocations were not freed by the end of the capture. Furthermore, the stack tree indicates that LeakMemorySomtimes was called as part of two distinct callstacks. The first callstack goes through the Process function, while the second callstack goes through UpdateEnemyPositions. Looking at the Unfreed Size column for those two functions indicates that all of the unfreed memory came from the first callstack, the one that includes Process.
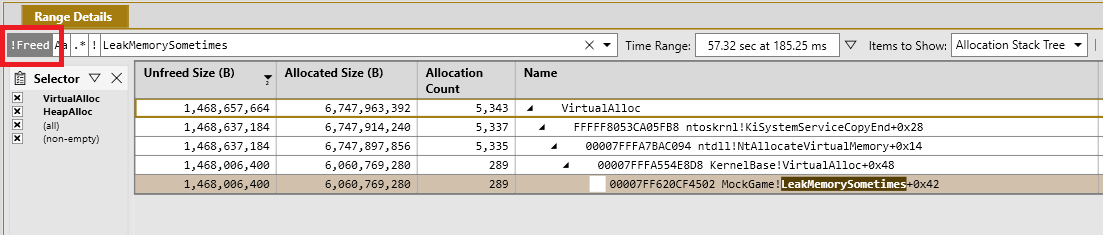
The Range Details view includes a filter bar that can be used to filter the contents of the view to only stacks that contain a specific string. In addition to string searching, the filter bar also includes a !Freed button that will filter the view to only those callstacks that have a non-zero value for Unfreed Size.
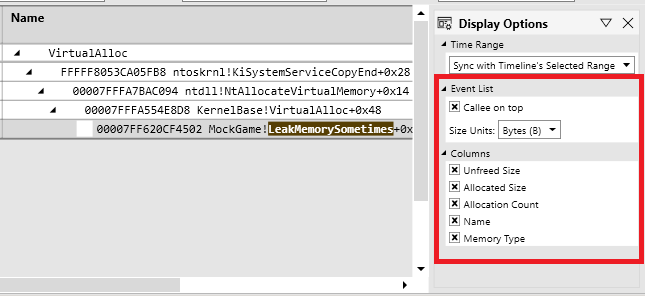
The Display Options pane on the right hand side of the view enables you to customize some aspects of how the Range Details view displays the allocation tree. The set of columns to display can be changed, and the tree can be inverted such that the callee is shown at the top of the stack instead of at the bottom.
In addition to the Allocation Stack Tree, the Range Details view can also be used to look at a flat list of all allocations made using VirtualAlloc. Select the Virtual Memory Allocations entry in Items to Show dropdown to view the flat list of all allocations. The list is organized by time by default and includes columns such as the allocation Size, the Unfreed Size, the Flags and so on as shown in the following figure. Selecting an allocation in the Range Details view populates the Element Details view with the callstack of the allocation. A link to the corresponding calls to VirtualFree are also provided, if applicable.

0 comments