
Today we released PIX 2010.26 which can be downloaded here. This release contains better visualizations of Command List executions in timing captures, a brand new Descriptor Heap viewer, and fixes for several user-reported issues. As always, we are listening to your feedback and making adjustments to our plans accordingly. If you ever have a question for the product team, use the feedback button in the top right corner of PIX.
Timing Captures Command List Execution Views
In this release, timing captures have been updated with better visualizations of Command List executions. An execution contains one or more Command Lists sent to the GPU via a call to ExecuteCommandLists. The GPU work performed by each Command List is rendered directly below each green Command List bar drawn on the timeline.
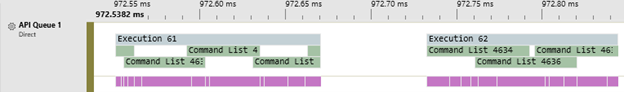
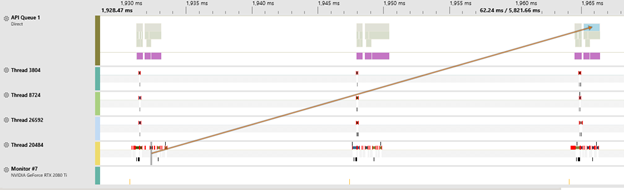
Selecting an Execution block on the timeline draws an arrow indicating where the corresponding ExecuteCommandLists() call was made on the CPU timeline.
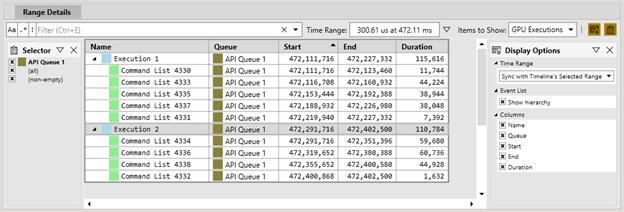
Selecting a range of executions will show you the start/end/durations in the Range Details view.
Future releases will contain more updates to this view, including showing GPU operations in each Command List in the Event Details view, and better indications of when work was issued on the CPU timeline. As with any new feature, we welcome your feedback and suggestions for future development!
Descriptor Heap Viewer
We’ve added a new view to GPU captures, which shows the contents of descriptor heaps, and links them to the resources they represent:

You can access the Descriptor Heap viewer through the Views button in the top right of your PIX window. Once done, simply select a descriptor heap from the combo-box (all heaps accessed through the capture will be shown), and the viewer will display the heap’s contents as of the current event. The contents will also update as you navigate through the different events in your capture.
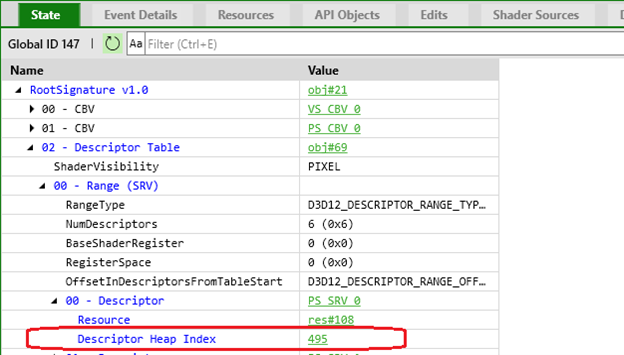
Additionally, the Root Signature in the State view now link Descriptor Heap Table members to their corresponding descriptor.
We’d like to give a big shout-out to Amogh Subhedar, as this was his intern project while working (remotely) on the PIX on Windows team this summer 😊
Extended Buffer Formatter Syntax
The buffer viewer format syntax has been extended slightly to cover some cases that the existing “pad (n)” syntax can’t express. By default, constant buffer packing rules allow subsequent items to pack into leftover storage at the end of an array. “Pad” allows the user to express unused memory in between array elements, but not the fact that the last element’s trailing unused space might actually contain the next variable. Most of the time, this syntax is pre-populated for you based on shader reflection information, but if you wish to modify the format yourself, see the buffer viewer’s “Syntax Help” page for details.
Increased GPU Compatibility
This release includes new plugins from both AMD and NVIDIA. NVIDIA’s plugin adds support for Ampere GPUs, including the RTX 3080. AMD’s plugin includes a backwards compatible change to accommodate future driver changes. Many thanks to our IHV partners for their continued updates.
Other Improvements
- You can now view structures that have nested structures within them in table mode in the buffer viewer.
- Added an option to display memory size values in the Allocation Stack Tree Timing Captures in either in KiB or MiB.
- Removed the event count limit for Allocation Stack Tree in Timing Captures. The Allocation Stack Tree for large captures can now be displayed.
- Pixel history is now available for all bindings except depth bindings.
- Add confirmation dialog when you select Pixel Cost in Visualization mode. Pixel Cost requires counter data collection which can take some time, the added popup should prevent accidental selection.
- Add support for mesh shader visualizers.
- Support SetPrivateData(WKPDID_D3DDebugObjectName) with a nullptr name.
- Sampler Feedback resources now show up properly in the API Object table.
- Sampler Feedback resources are now determined by DXGI Format instead of a non-zero MIP Region.
- ResourceMinLODClamp is now displayed inside Texture Properties of the Pipeline View.
- You can now copy/paste shader debugging call stack text.
Bugfixes
- Fixed an issue in which callstacks in Timing captures were showing incorrect frames, especially when processing the PDBs for Windows system binaries.
- The label for the Readied Time value in the Element Details view of PIX Timing Captures included both “ns” and “ms” when a context switch was selected. The duplicate unit has now been removed. The label is now “ms”.
- Pixel history view no longer scrolls to the bottom when first created.
- Fixed an issue where after running 3 consecutive samples that include mesh shaders the debugger would forget to update stale shaders.
- Improved remote deploy scenarios for ARM64.
- Gracefully handle zero-sized vertex buffer in the IA output viewer
- Fix heap corruption when using D3D12_SHADER_VISIBILITY_MESH/_AMPLIFICATION
- Remove erroneous warning message declaring the app will terminate when a capture is opened. This behavior changed in the 2008.26 PIX on Windows release, but the error message was not updated at the time.
- Fix misc issues capturing/replaying acceleration structures in placed resources
- Fix issue capturing descriptor heaps that contain stale acceleration structure descriptors
0 comments