
Visual Studio Blog
The official source of product insight from the Visual Studio Engineering Team
Latest posts
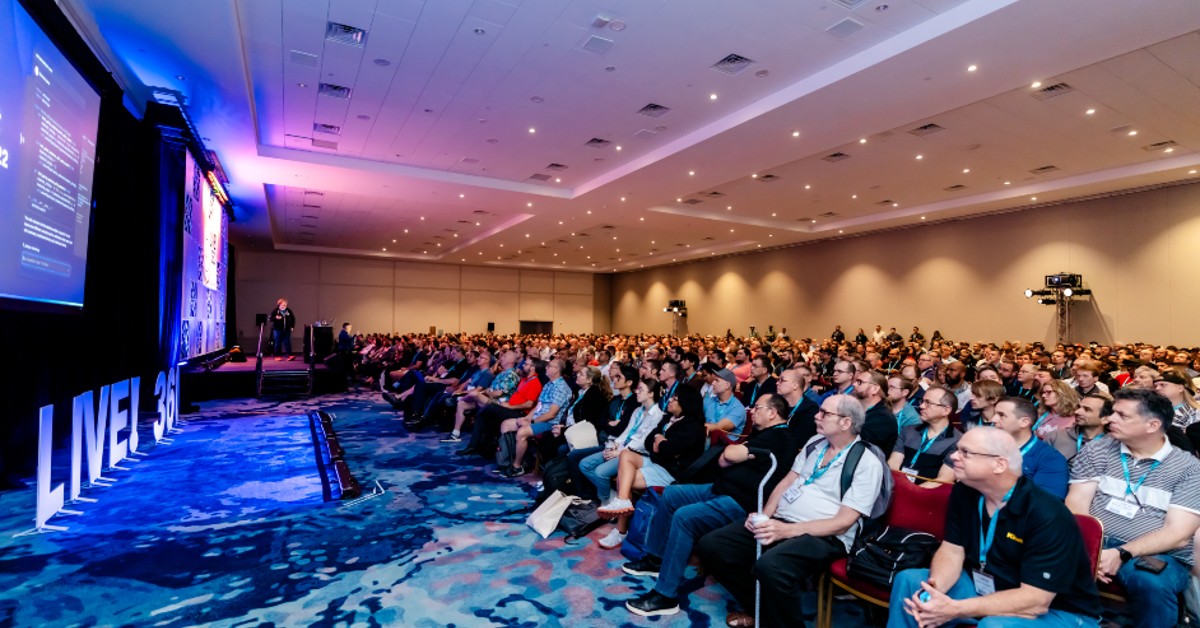
Get Hands-On with Visual Studio, .NET, AI, and More at Live! 360 next month.

Visual Studio LIVE! Orlando 2024 November 17-22 | Loews Royal Pacific Resort, Orlando, FL We’re only four weeks away from the final Visual Studio Live! event of the year, and we’re close to capacity! Live! 360 Orlando offers something for everyone—whether you’re a developer, IT professional, data specialist, or cybersecurity expert. You’ll have the opportunity to learn from industry leaders while networking with peers who share similar roles. Packed Hands-On Labs and Workshops The week kicks off and wraps up with two full days of hands-on labs and workshops, featuring top experts like GitHub's Brian Randell a...
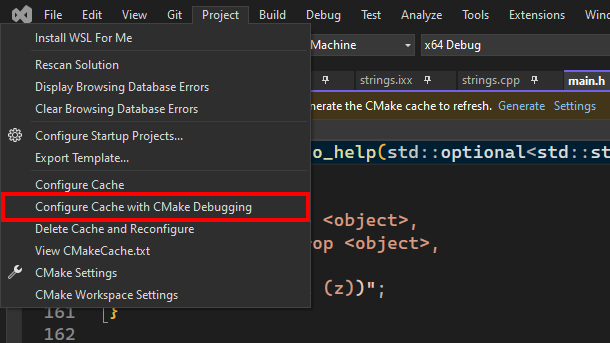
Debug CMake Scripts on Linux with Visual Studio

If you are working on a CMake project that targets Linux, you may have encountered some challenges when trying to debug your CMake scripts and CMakeLists.txt files. You may have wondered why your variables are not set correctly, or why your custom commands are not executed as expected. Or you may have simply wanted to step through your CMake scripts and see what is happening behind the scenes of the configure step. We are excited to announce that the CMake debugger in Visual Studio now has support for CMake projects targeting Linux via WSL or SSH. The CMake debugger allows you to debug your CMake scripts and C...

Improve your debugger game with editable expressions

Do you ever wish you could quickly test different queries on your collections or datasets while debugging? Do you want to save time and avoid writing code just to inspect your data? If you answered yes, then you will love the new editable expression feature in the Visual Studio debugger. This feature allows you to modify the expressions textbox on the top of the IEnumerable visualizer dialog with your desired LINQ expressions. The visualizer updates in real-time, reflecting the data change resulting from your query. You can easily apply different filters or sort orders to your collections based on your needs. ...

Easier localization with the new resource (.resx) manager

If you're developing applications that target multiple languages and cultures, you probably know how challenging it can be to manage the resources for each localization. You need to keep track of all the strings, images, icons, and other assets that are specific to each culture, and make sure they are consistent and up to date across your project. Fortunately, Visual Studio has a solution for you: the revamped Resource Explorer. This new feature lets you view, edit, and manage all your resources in one place, with a sleek and intuitive interface that is designed for the modern .NET developer. In this bl...

Accelerate C++ Debugging with Enhanced Conditional Breakpoints

Are you tired of waiting for your conditional breakpoints to hit in C++? Do you wish there was a way to speed up the debugging process and get to the root of the problem faster? If so, you're in luck! We have some exciting news for you: Visual Studio 2022 has significantly improved the performance of conditional breakpoints in C++ through a reworked implementation. This means you can now debug your C++ code faster and more efficiently than ever before. What are conditional breakpoints? Conditional breakpoints are a powerful debugging tool that only triggers when a specified condition is met. For instance...

Discover Hidden Insights with Profiler’s External Code Decompilation
Have you ever wondered what's happening under the hood of your .NET application? Do you want to quickly and easily identify and fix performance bottlenecks? If so, Visual Studio has the perfect tool for you: the profiler. The profiler allows you to analyze your code's performance, pinpoint hot paths, detect memory leaks, address thread contention, and more. It helps you measure CPU usage, memory consumption, and file activity, and lets you drill down into specific methods and lines of code. But what if the code you need to profile isn't yours? What if it's a third-party library, a NuGet package, or a framew...

Visual Studio 2022 – Recent performance enhancements

Visual Studio 2022 continues to be faster with each version. In this blog post we will highlight a couple of the more significant enhancements you’ll experience in 17.11, such as a more efficient C# language service, faster conditional breakpoints and symbol searches in C++. Reduced CPU usage by C# language service Code Indexing In 17.10 we revamped the code indexing system in the C# language service (Roslyn). It used to be both aggressive and highly intermittent. This would lead to high spikes of CPU usage, taking resources away from the operations users were performing, especially during times like solution...

Effortless Instrumentation profiling with Persistent Target Selection
Ever wished to assess your code's performance without repeatedly choosing the target process or executable for each instrumentation profiling session? If so, you're among many developers who find this task cumbersome and prone to errors, especially when profiling the same target repeatedly. We understand your frustration and have a solution: Visual Studio 2022 introduces a new feature that addresses this issue. The instrumentation tool now remembers your target selection across runs, providing a seamless experience and enhancing the continuity of your profiling sessions. With this improvement, you can m...
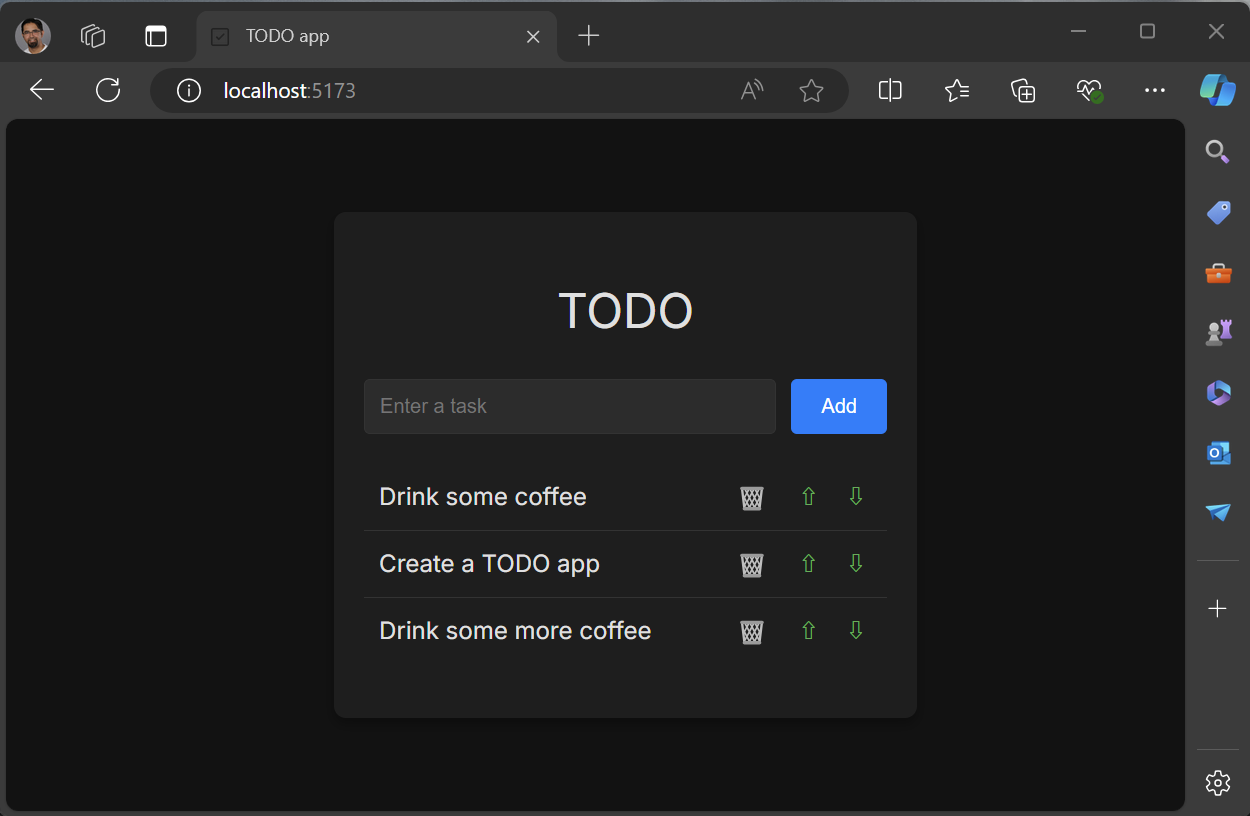
Creating a React TODO app in Visual Studio 2022

In this tutorial we will create a React front-end, with JavaScript, of a TODO web app using a Visual Studio 2022. To get started install Visual Studio with the Node.js development workload. This will include the JavaScript/TypeScript (JSTS) projects and the associated support. The code for this app can be found at sayedihashimi/todojswebapp (github.com). Create a new React project using the New Project Dialog in Visual Studio 2022. Use File > New > Project … to open that dialog. For this tutorial select the React App JavaScript template which is shown below. After clicking Next, give the project the ...