
Memory Allocation Captures
Please see this page for information about Timing Captures in the most recent versions of PIX, which contains features similar to the ones described below. The page below describes features in an old type of capture that is not available in the latest versions of PIX.
Memory captures help you find leaks and unexpected allocation patterns in your title. PIX uses a combination of standard and custom ETW providers to track allocations made by VirtualAlloc/VirtualFree and HeapAlloc/HeapFree.
Initiating a Memory Capture
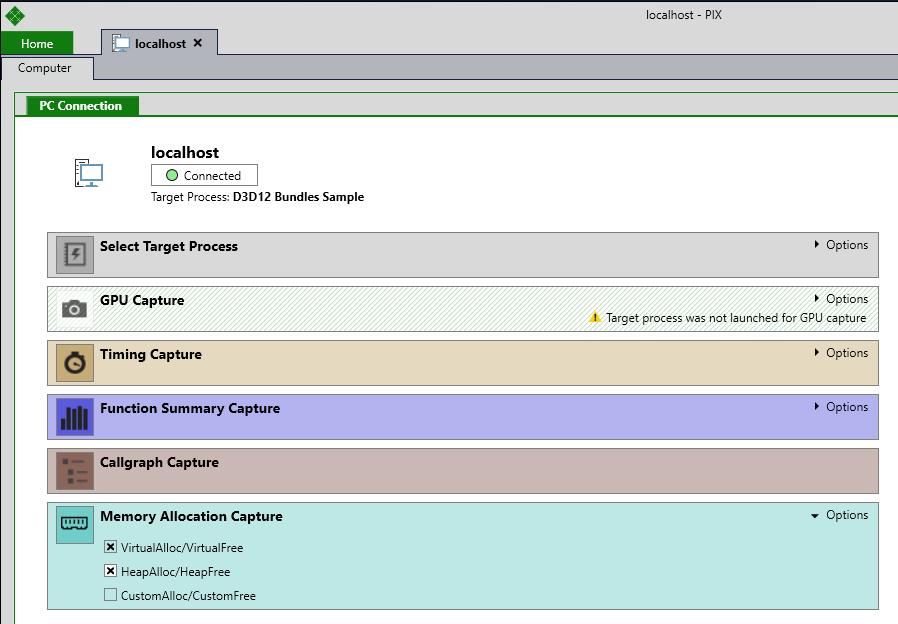
To start a memory capture, choose the allocation types you’d like to track using the options checkboxes, then click the Memory Allocation Capture button on the device connection tab.
When the capture starts running, you’ll see a dialog that lets you either stop or cancel the capture. Memory captures can run for relatively long periods of time. It’s common to use memory captures to profile a level load, or a play through of a significant part of your game, for example.
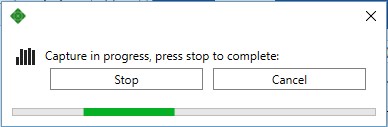
When the press the Stop button, the collection of ETW data will stop and PIX will open the capture.
Memory captures open to a tab called a landing page. This initial page provides a textual description of the rest of the tabs in the capture.
The first tab you’ll likely want to look at after the landing page is the Capture Summary tab.
Capture Summary Tab
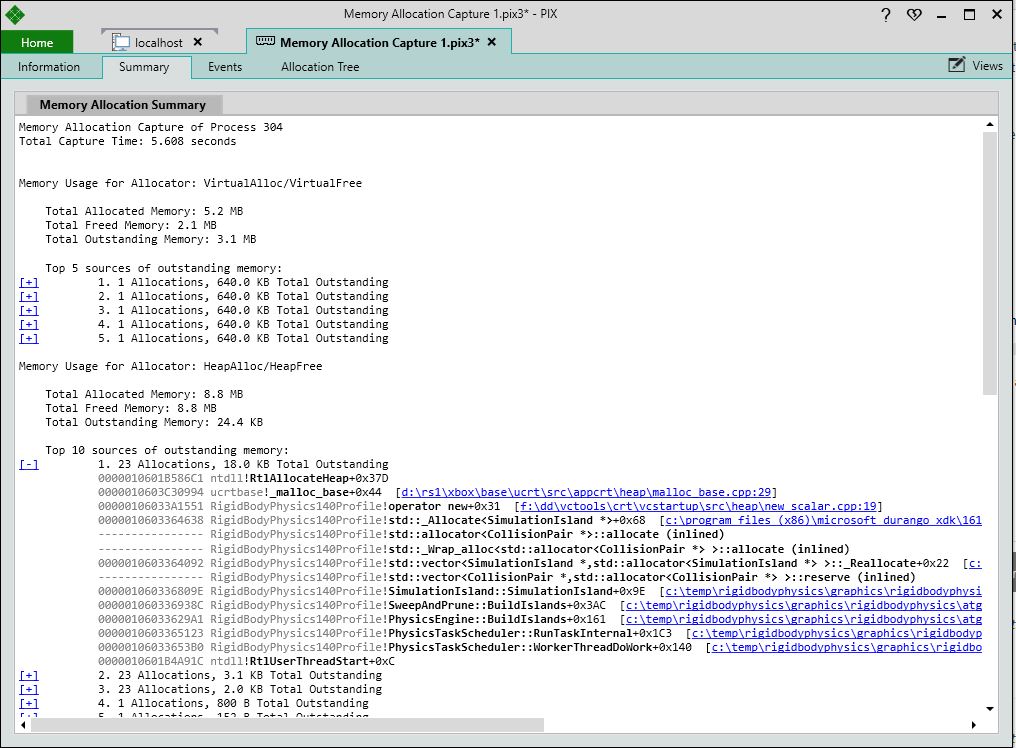
The Capture Summary tab provides basic statistics about the memory allocated during the capture, along with the top sources of memory that was allocated and not freed. The statistics include the total amount of memory that was allocated, the amount that was freed and the amount outstanding.
All statistics and sources of outstanding memory are broken out by allocation type (VirtualAlloc, HeapAlloc, or custom) and the module in the title from which the allocations came.
Full callstacks are provided for the top sources of outstanding memory.
The Memory Events Tab
The Events tab includes an event list, a graph of allocated and outstanding memory and a callstack view. The events list contains one row for every memory allocation made while the capture was running. If that allocation was also freed, the row representing the allocation can be expanded to see the corresponding free.
The callstack view contains the full callstack for the allocation (and it’s corresponding free if it exists) for the row currently selected in the events list.
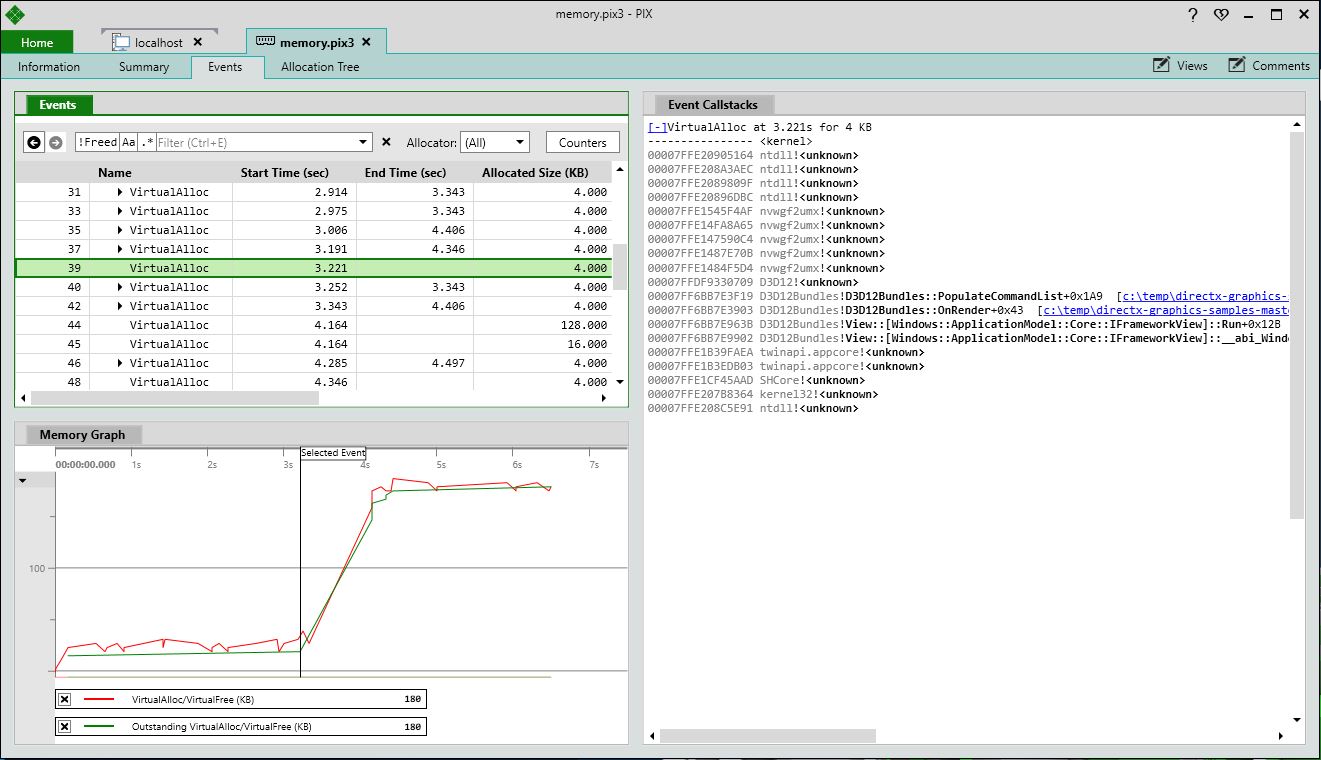
In addition to helping you spot memory leaks, the graph of allocated and outstanding memory can also help you see unintended memory allocations. For example, it’s common to allocate all the memory needed for a particular level of your game when the level is loaded. In this scenario, you’d expect no additional allocations to occur once the level is loaded.
If you run the memory profiler over a period of time in which you expect memory to be at a steady state, yet the contents of the graph show the amount of allocated memory increasing, then your title isn’t holding to the steady state you expect. Selections made in the graph are synchronized with the event list, and vice versa. So if the graph shows you an unexpected increase in allocated memory, selecting that portion of the graph will select the allocations responsible for the increase in the event list. The callstack view will also be updated to show you the specific location in your title that performed the allocation.
The Allocation Tree Tab
The Allocation Tree tab shows the full callgraphs for all allocations made during the capture. This tab is particularly useful for drilling down to discover which functions allocated memory that was not freed. The event list contains columns describing the amount of memory that was not freed for each level of the callgraph (Inclusive Outstanding Size) as well as the amount of memory that was allocated and the number of allocations and frees.
Clicking the “!Freed” button on the filter bar will filter the event list to those functions in the callgraph that allocated memory that was not freed.
The Function Butterfly view helps you drill down by providing the callers and callees for each function, along with the amount of outstanding memory for each function.

Data Type Tracking
If you’re using version 1702.23.002 of PIX (or newer), memory captures also included data type information for heap allocations. See Data Type Tracking in Memory Allocation Captures for more information.