
PIX Timing Captures include several analysis features aimed at making it easy to find memory leaks in your title. These features, coupled with the ability to take captures for extended periods of time, are a compelling combination for finding leaks, even those that can take a considerable amount of time to manifest themselves.
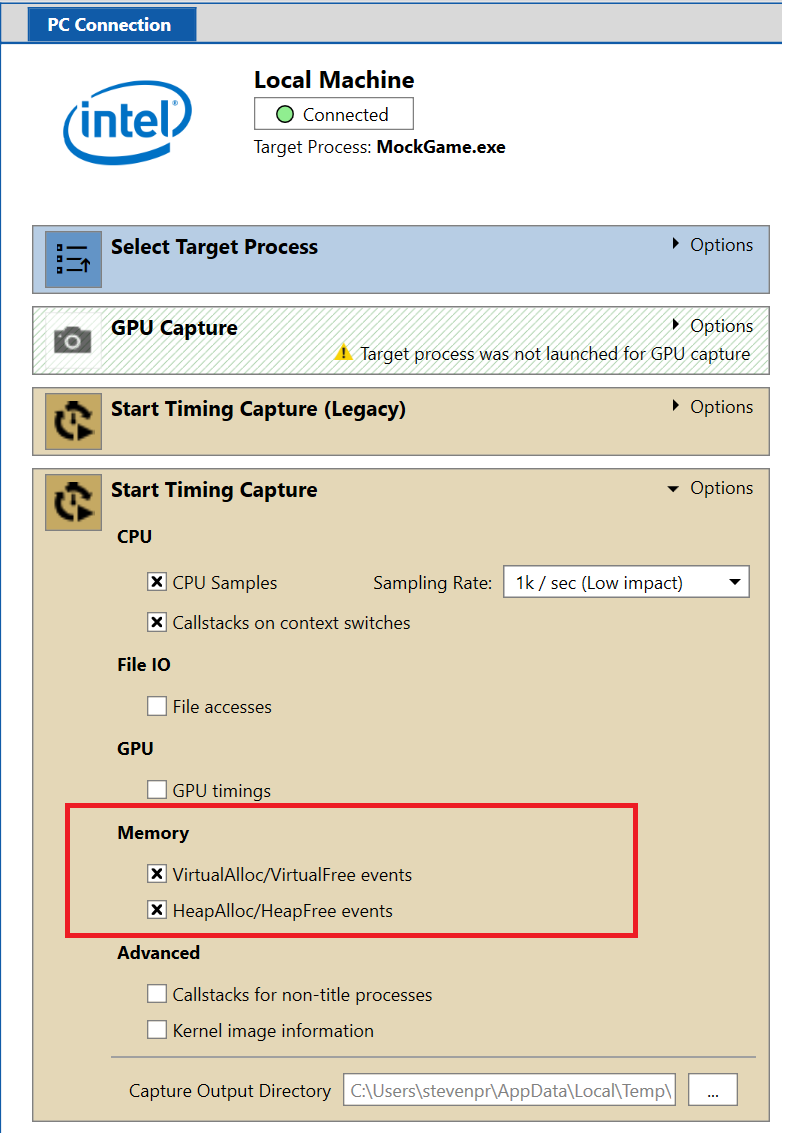
To enable the leak tracking features, select one or both of the memory tracking options when starting a Timing Capture.
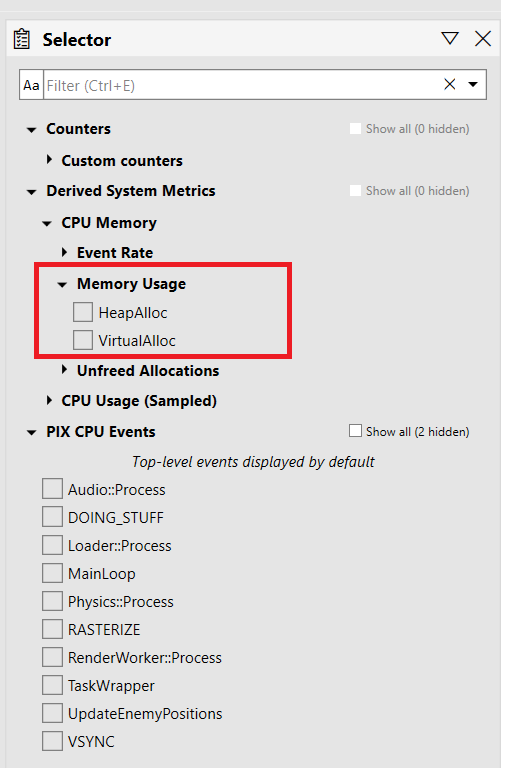
The easiest way to visualize the amount of memory in use over the duration of the capture is to use the Metrics View. The Memory Usage counters under the Derived System Metrics/CPU Memory node in the Selector panel can be used to view the amount of memory in use due to calls to HeapAlloc and VirtualAlloc.
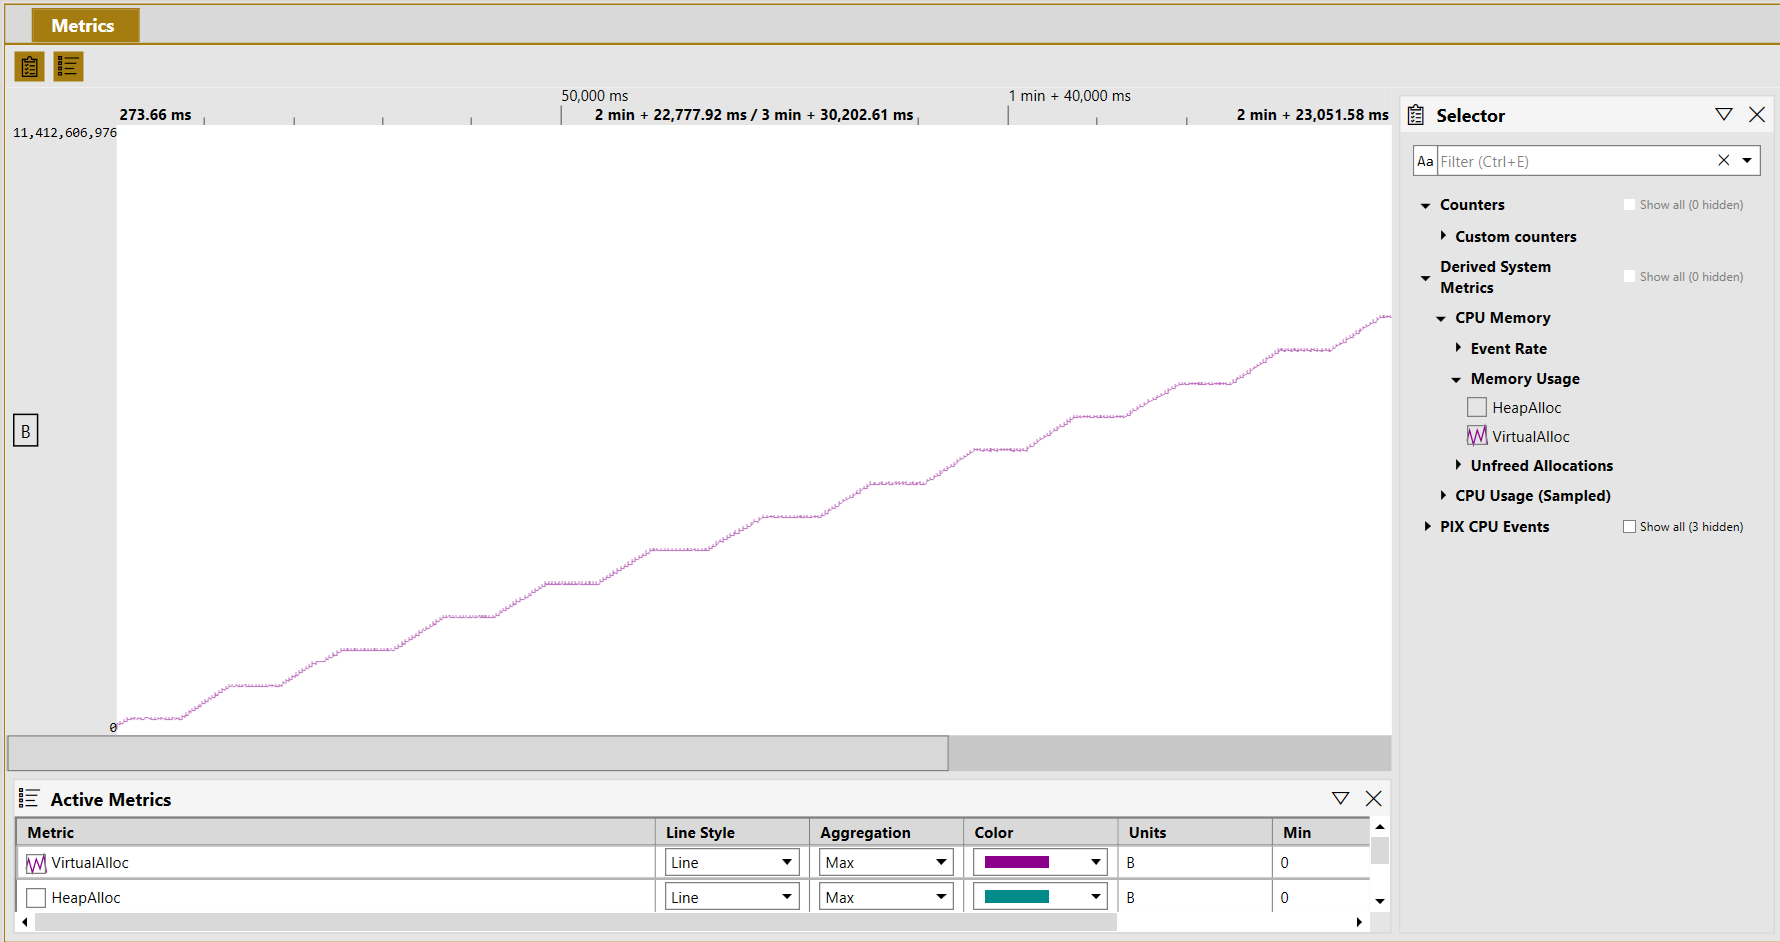
The following picture shows a graph of the amount of memory allocated by VirtualAlloc. The amount of memory allocated is clearly growing over time. There are periods of time in which usage is flat, following by periods of time where memory usage grows and doesn’t appear to be freed by the end of the capture. The periods of memory growth may indicate a leak.
To determine if that’s the case, select a range of time in the Metrics view that corresponds to one or more periods of memory growth. We’ll then use the Range Details view to analyze an Allocation Stack Tree for the selected period of time.
To make the analysis easier, I’ve created a custom layout that adds a Range Details view to the predefined Metrics View layout. I’ve also used the Display Options panel in Range Details to set the Time Range dropdown to Sync with Metric View’s Selected Range. Note that creating this custom layout isn’t required for analyzing memory leaks, I’ve just set it up this was as a convenience. The Range Details view in the standard Timeline layout can be used as well.
Here’s my custom layout, with an area of growth selected in the graph and the Range Details viewing showing the Allocation Stack Tree.

The allocations in the stack tree are grouped by allocator. The tree has two root nodes: one for those allocations that came from calls to VirtualAlloc and one for those that came from calls to HeapAlloc. Given that we know our leak is coming from virtual memory allocations, we’ll start expanding the tree and monitoring the values in the Unfreed Size column to find allocations that weren’t freed.
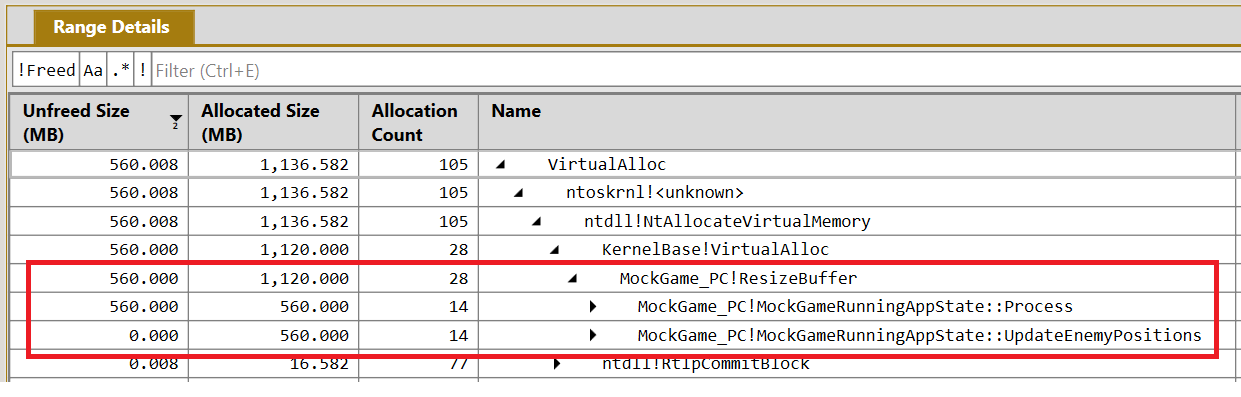
The following Range Details view shows a function in my title, named ResizeBuffer, that is leaking 560MB of VirtualAlloc’d memory. Furthermore, I can see there are two call paths into ResizeBuffer, one callpath comes from a function named Process and another callpath comes from a function named UpdateEnemyPositions. The Unfreed Size column shows that all of the leaked memory is coming from the call to ResizeBuffer that comes from Process.
Drilling into the stack and using the Unfreed Size column is one way to find leaks, but given that the memory leak scenario is such a common workflow, PIX includes a shortcut to make this even easier. To find the call tree(s) in your title that are causing leaks, simply use the !Freed button at the top of the Range Details view.

Easy!
Steven Pratschner
PIX Program Manager
0 comments