
Recently, we worked with multiple startups that use Application Insights, an Azure service that enables the collection of large amounts of information about an application’s business analytics and health, plus quick and efficient access to that data by using Kusto Query Language. During these engagements, we identified the need for an easy-to-use tool for visualizing the service’s data. While building a Microsoft Bot Framework application called Pegg with Sage, we learned the customer wanted to understand what was happening in their production environment after deploying their bots. We soon discovered that many partners, such as Swiss Railways (read about their bot application here), and other companies and start-ups had the same requirement, which is how this project began.
We set out to build a solution that supports various scenarios by implementing the following features on a dashboard framework:
- Filtering
- Drill-down and expanding data
- Reusable Templates (to enable sharing of schema)
- Extendability (for visual components and data sources)
- Customization
Our solution for visualizing Azure Application Insights data can be applied to different bot scenarios, as well as various other scenarios involving the service.
The Challenge
Application Insights run on a large, powerful data engine called Kusto, which enables storage and retrieval of large quantities of analytics data in real-time. The customer required a dashboard solution with a unified approach for bot analytics and, potentially, other application types. The dashboard used today in Application Insights Analytics is the Azure Portal native dashboard, which doesn’t support all of the features we needed (such as customization, reusability, and extensibility to support additional data sources).
The Solution
We collected requirements from several companies and startups we were working with that had developed a bot application and wanted a Bot Analytics Dashboard to understand their applications’ usage statistics and health in production.
Functional Features
The following is a list of the prioritized requirements.
- Reusable templates: Enable customers to share templates between environments, similar applications, and on a larger scale. Define templates that are reusable between different parties on similar application types.
- Filtering: Simple drop-down lists to select how to filter the data according to time or any other field specific to the application.
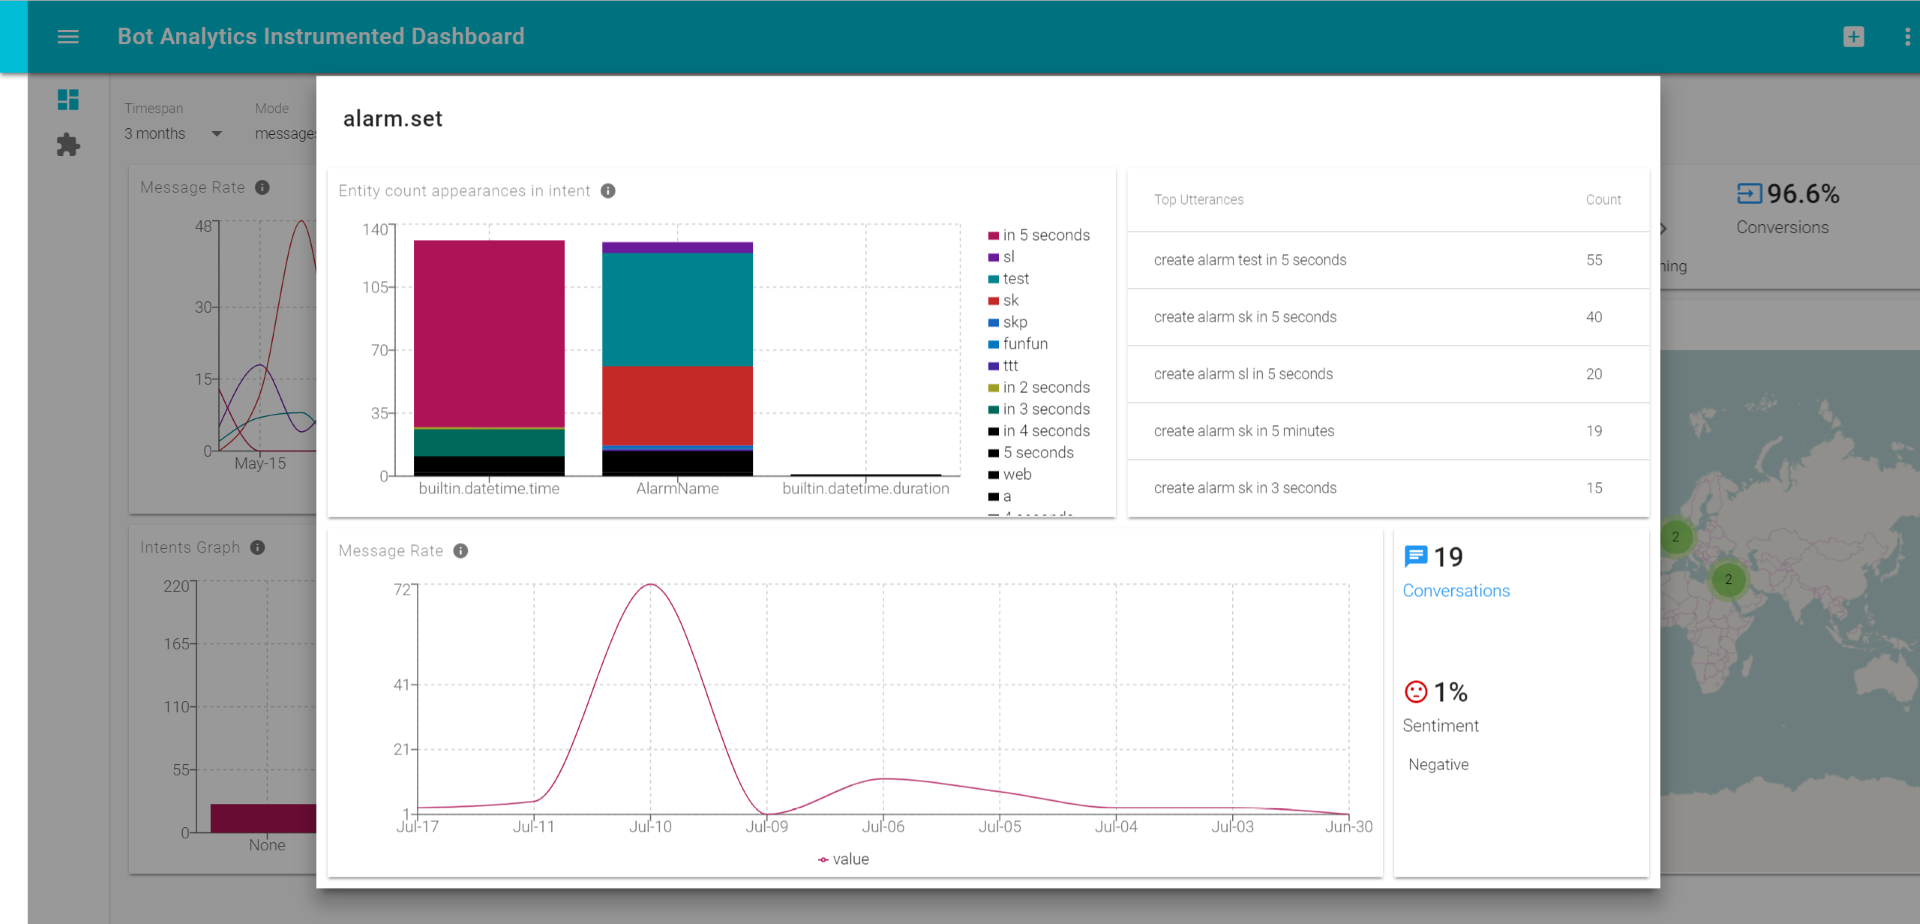
- Drill-down: Ability to click on a data point (like bar, pie slice, scorecard, etc.) and get an extended dashboard focused on that entity. For example, clicking on an Intent in an Intents Usage chart would open up a dashboard with a list of top entities in that intent.
- Customizability: Enable customers to continue and customize a dashboard after creating it from a template as each customer/application requires additional specifications.
Experience
The following is a list of requirements from a user experience perspective:
- Simplicity: Offer a simple and intuitive experience for ramping-up, using and manipulating the dashboards/templates and a continuous deployment experience.
- Holistic experience: Have one configuration to define data source queries, the dependencies between those queries, and the way to visualize them.
- Data source connectability: Enable users to withdraw and join data from multiple data sources (i.e., join LOB data from CosmosDB with analytics data from Application Insights).
- Chart and data source extendability: Customers can add their own data source and chart types.
We looked into several popular and active dashboard frameworks which didn’t fit our requirements. The options we found were lacking in user and developer experience requirements, such as reusable templates, editing, drill-down, filtering and customization. These gaps would have required substantial development resources and compromise on important features. In order to focus on our primary requirements, we dismissed some our less critical ones and were able to put a relatively small effort into developing a new platform.
Ibex, which is the name we chose for our project, is open sourced and available on GitHub. Its namesake is an animal native to Israel, plus its horns reminded us of line charts.
Solution Architecture
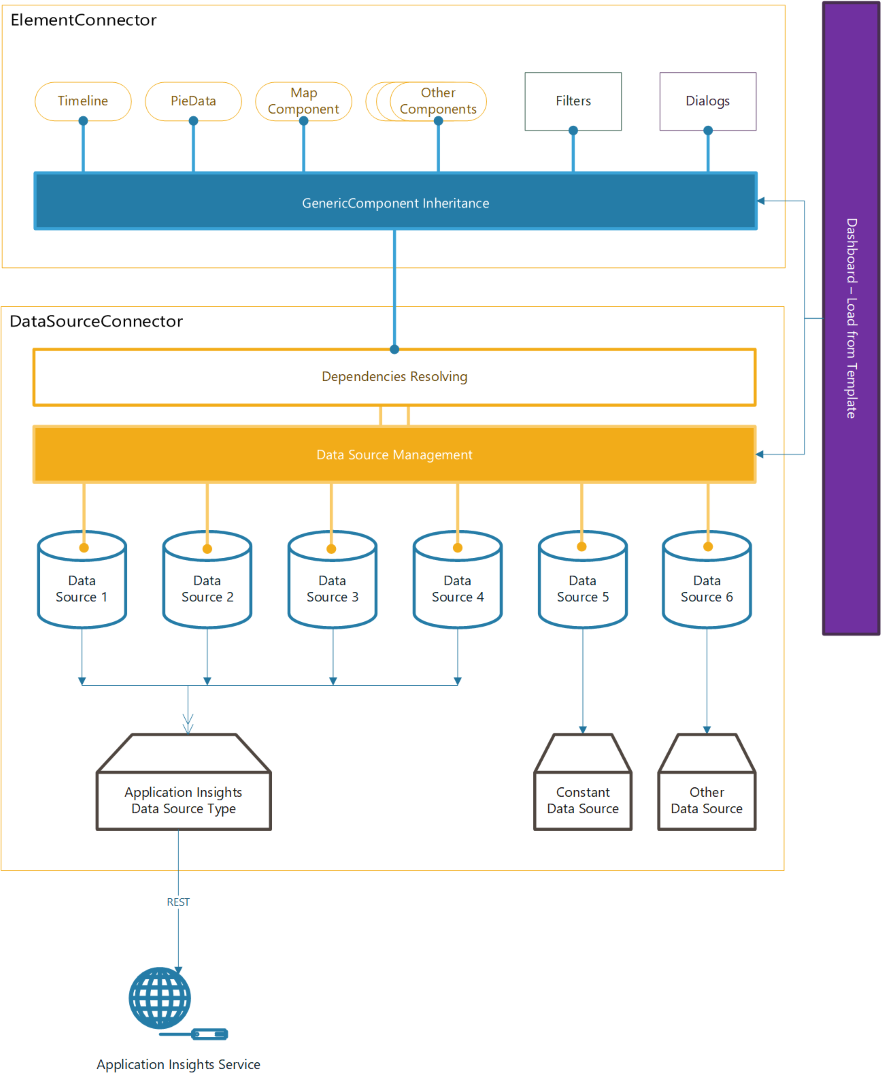
Data Source Management
First, we load the dashboard configuration from the server API. Since the dashboard contains JavaScript functions for calculations and transformations on data, it is a JavaScript file. That file is loaded into a tag on the client side, executed, and stored as a global ‘dashboard’ variable.
ConfigurationActions.ts
  loadDashboard(id: string) {

    return (dispatcher) => {
      getScript('/api/dashboards/' + id, () => {

        return dispatcher({ dashboard: (window as any)['dashboard'] as IDashboardConfig });

      });
    };
  }

   getScript(source: string, callback) {
    let script: any = document.createElement('script');
    script.async = 1;
    document.getElementsByTagName('body')[0].appendChild(script);

    script.onload = script.onreadystatechange = (_, isAbort) => callback;

    script.src = source;
  }
After loading the dashboard, the data sources are initialized via the configuration store.
ConfigurationStore.ts
  loadDashboard(result: { dashboard: IDashboardConfig }) {
    let { dashboard } = result;
    DataSourceConnector.createDataSources();
  }
Then we dynamically load the right data source plugin to handle the configuration for each data source in the dashboard.
DataSourceConnector.ts
  createDataSources(dashboard: IDataSourceContainer) {
    dashboard.dataSources.forEach(source => {
      let dataSource = DataSourceConnector.createDataSource(source);
      DataSourceConnector.connectDataSource(dataSource);
    });
  }

  createDataSource(config: any) {

    var PluginClass = require('./plugins/' + config.type);
    var plugin: any = new PluginClass.default(config);

    var ActionClass = DataSourceConnector.createActionClass(plugin);

    var StoreClass = DataSourceConnector.createStoreClass(config, plugin, ActionClass);

    DataSourceConnector.dataSources[config.id] = {
      id: config.id,
      config,
      plugin,
      action: ActionClass,
      store: StoreClass,
      initialized: false
    };

    return DataSourceConnector.dataSources[config.id];
  }
When we create the data source plugin, we also dynamically create an Alt.js store and action that handle the state management for each data source, as well as actions and events triggered on each data source (like refresh, updateDependencies, etc.).
  createActionClass(plugin: IDataSourcePlugin): any {
    class NewActionClass {
      constructor() { }
    }

    plugin.getActions().forEach(action => alt.addActions(action,  NewActionClass));

    return alt.createActions(NewActionClass as any);
  }

  createStoreClass(config: any, plugin: any, ActionClass: any): any {

    class NewStoreClass {
      constructor() {
        this.bindListeners({ updateState: plugin.getActions().map(action => ActionClass[action]) });
      }

      updateState(newData: any) {
        this.setState(newData);
      }
    }
    return alt.createStore(NewStoreClass as any, config.id + '-Store');
  }
Finally, whenever a data source is updated, we look for any data sources that have a dependency on it and trigger an updateDependencies action.
  connectDataSource(sourceDS: IDataSource) {
    sourceDS.store.listen((state) => {
      this.dataSources.forEach(checkDS => {

        let dependencies = checkDS.plugin.getDependencies();
        if (areDependenciesConnected(sourceDS, dependencies)) {

          checkDS.action.updateDependencies.defer(getDependencyValues(sourceDS, dependencies));
        }
      });
    })
Visual Components Management
Visual components (a.k.a. Elements) are first requested and loaded via the Dashboard component.
Dashboard/index.tsx
class Dashboard extends React.Component {
  render() {
    const { dashboard } = this.props;

    let elements = ElementConnector.loadElementsFromDashboard(dashboard);
    let filters = ElementConnector.loadFiltersFromDashboard(dashboard);
    let dialogs = ElementConnector.loadDialogsFromDashboard(dashboard);

    return (
{elements} {dialogs}
); } }
We then use ElementConnector to dynamically create elements.
ElementConnector.ts
  loadElementsFromDashboard(dashboard: IElementsContainer): React.Component[] {
    return dashboard.elements.map((element, idx) => {
      var ReactElement = plugins[element.type];
      var { id, dependencies, source, actions, props, title, subtitle, size, theme, location } = element;
      var layoutProps = _.find(layout, { 'i': id });

      return (

      );
    });
  }
The class ReactElement is always a class that inherits from GenericComponent. This structure has the following implementation for componentDidMount, which makes sure each change in the state of a store that is defined as a dependency will trigger a correlating state change in the Element itself.
GenericComponent.tsx
abstract class GenericComponent extends React.Component {
  constructor(props: T1) {
    var initialState: IGenericState = {};
    var result = DataSourceConnector.extrapolateDependencies(this.props.dependencies);
    Object.keys(result.dependencies).forEach(key => {
      initialState[key] = result.dependencies[key];
    });

    this.state = initialState as any;
  }

  componentDidMount() {
    var result = DataSourceConnector.extrapolateDependencies(this.props.dependencies);
    Object.keys(result.dataSources).forEach(key => {

      this.onStateChange(result.dataSources[key].store.state);
      result.dataSources[key].store.listen(this.onStateChange);
    });
  }

  onStateChange(state: any) {
    var result = DataSourceConnector.extrapolateDependencies(this.props.dependencies);
    var updatedState: IGenericState = {};
    Object.keys(result.dependencies).forEach(key => { updatedState[key] = result.dependencies[key]; });

    this.setState(updatedState);
  }
}
For more information on plugins for data sources and elements, follow these links:
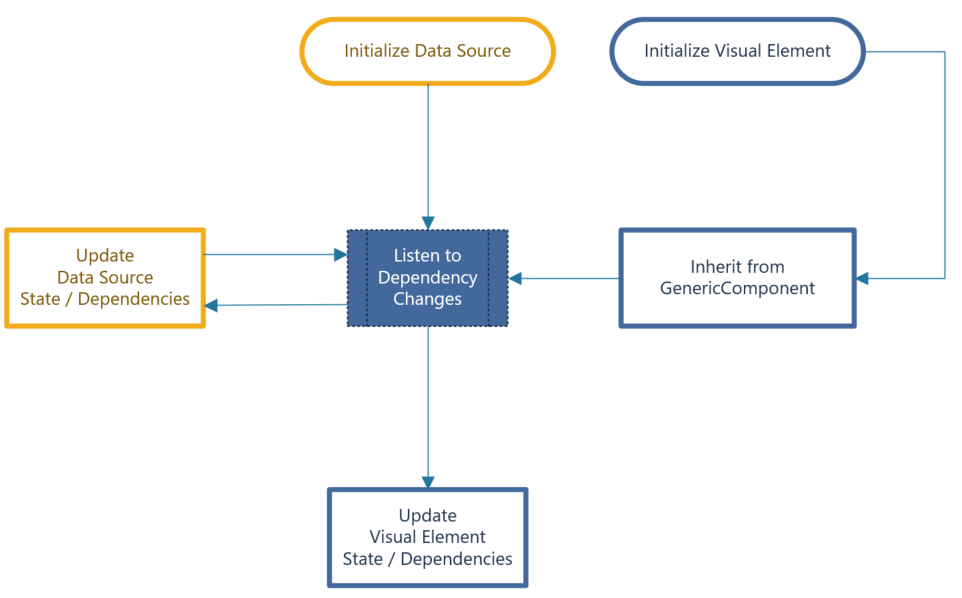
Process Flow
The diagram below is a representation of how data flows between the different components on the client side:
Reuse Opportunities
The first dashboard templates developed with Ibex involved bot scenarios and Microsoft Bot Framework, but we quickly understood the need for similar analytics solutions in various other scenarios like Web Applications, Gaming Analytics, Blockchain Analytics, etc.
Due to similar requirements in these other use cases, we developed a framework that can be used for any scenario that:
- Uses Application Insights (and/or other data sources that are queryable in real-time)
- Needs to visualize data by querying a data source in real-time
- Doesn’t require caching
- Needs to visualize drill-down into data
- Requires the use/creation of a dashboard template to support a common scenario
Below are some example screenshots of Bot Analytics solutions.
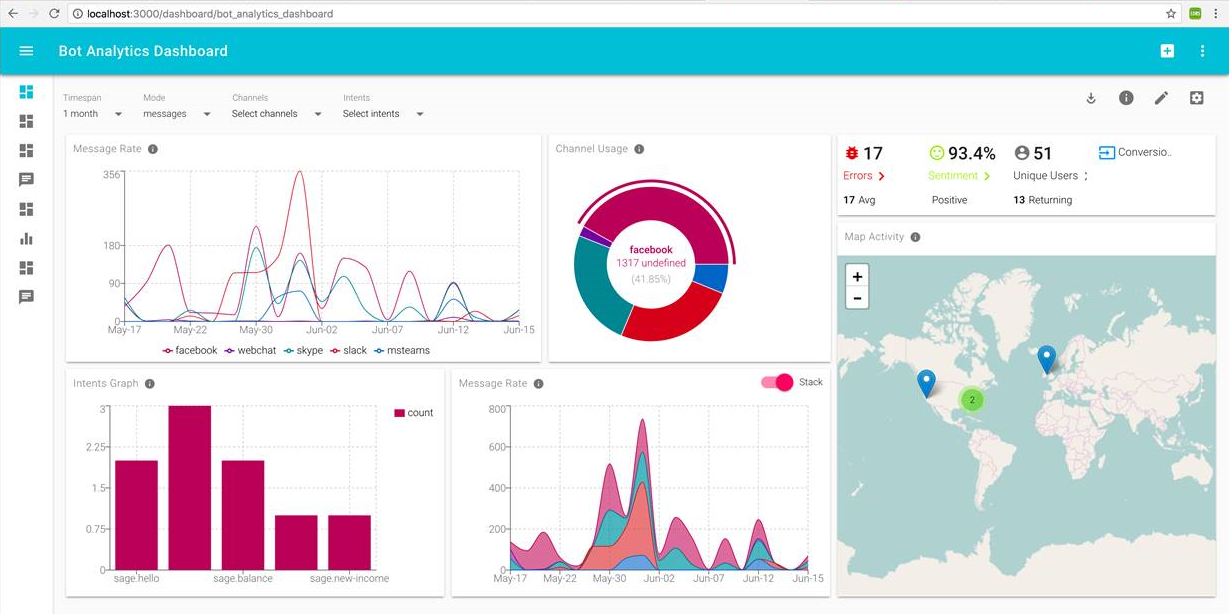
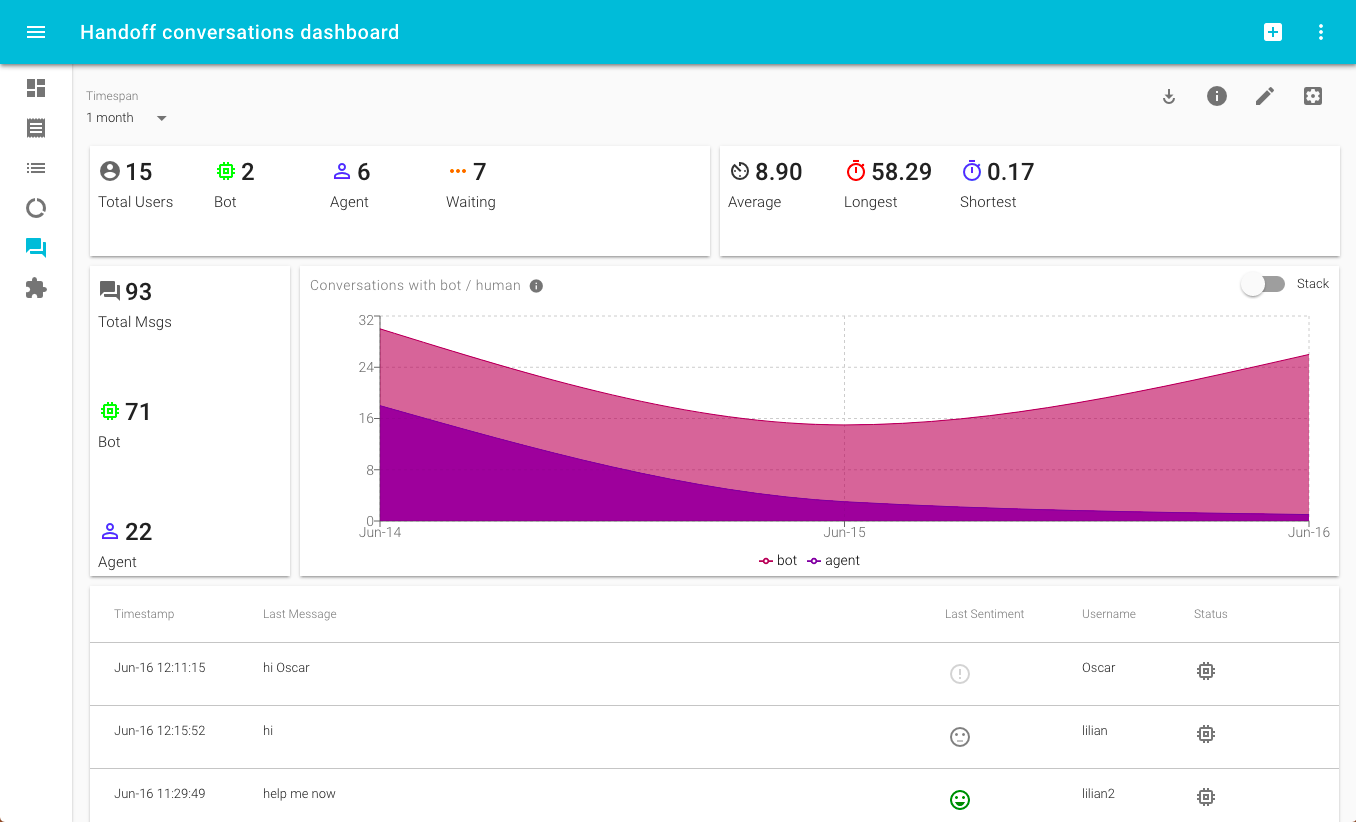
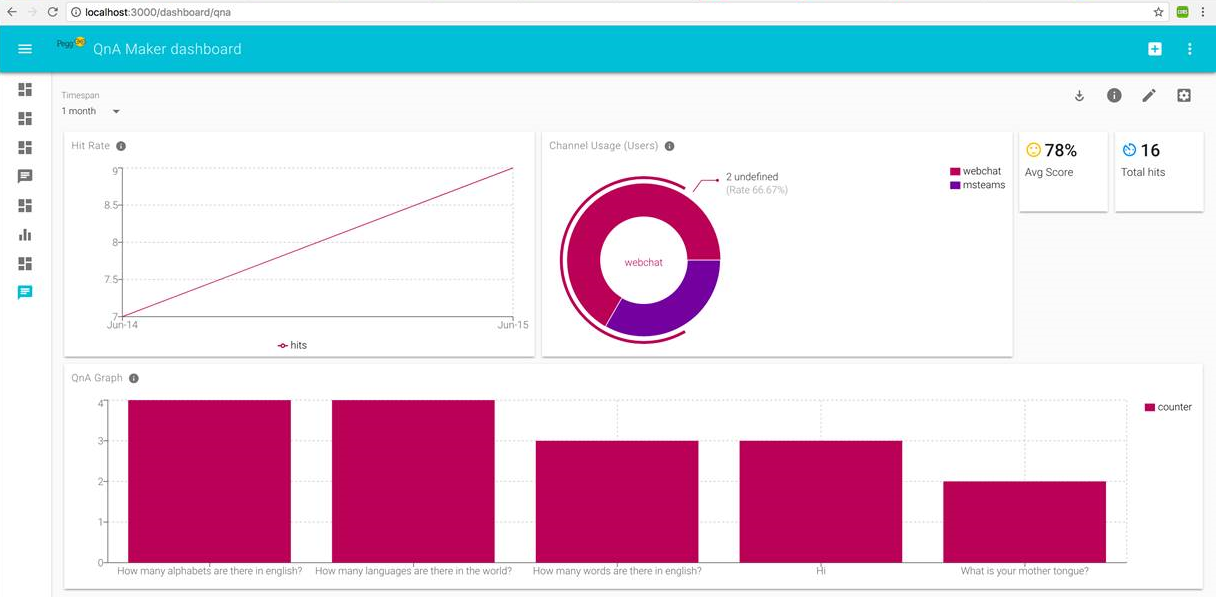
Bot Analytics Explained
In a future post, we will demonstrate how the Ibex dashboard can be extended to provide an end-to-end Bot Analytics Dashboard.
Application Insights Web Application Dashboard
Another scenario where we implemented a dashboard was for App Service (Web App) on Azure.
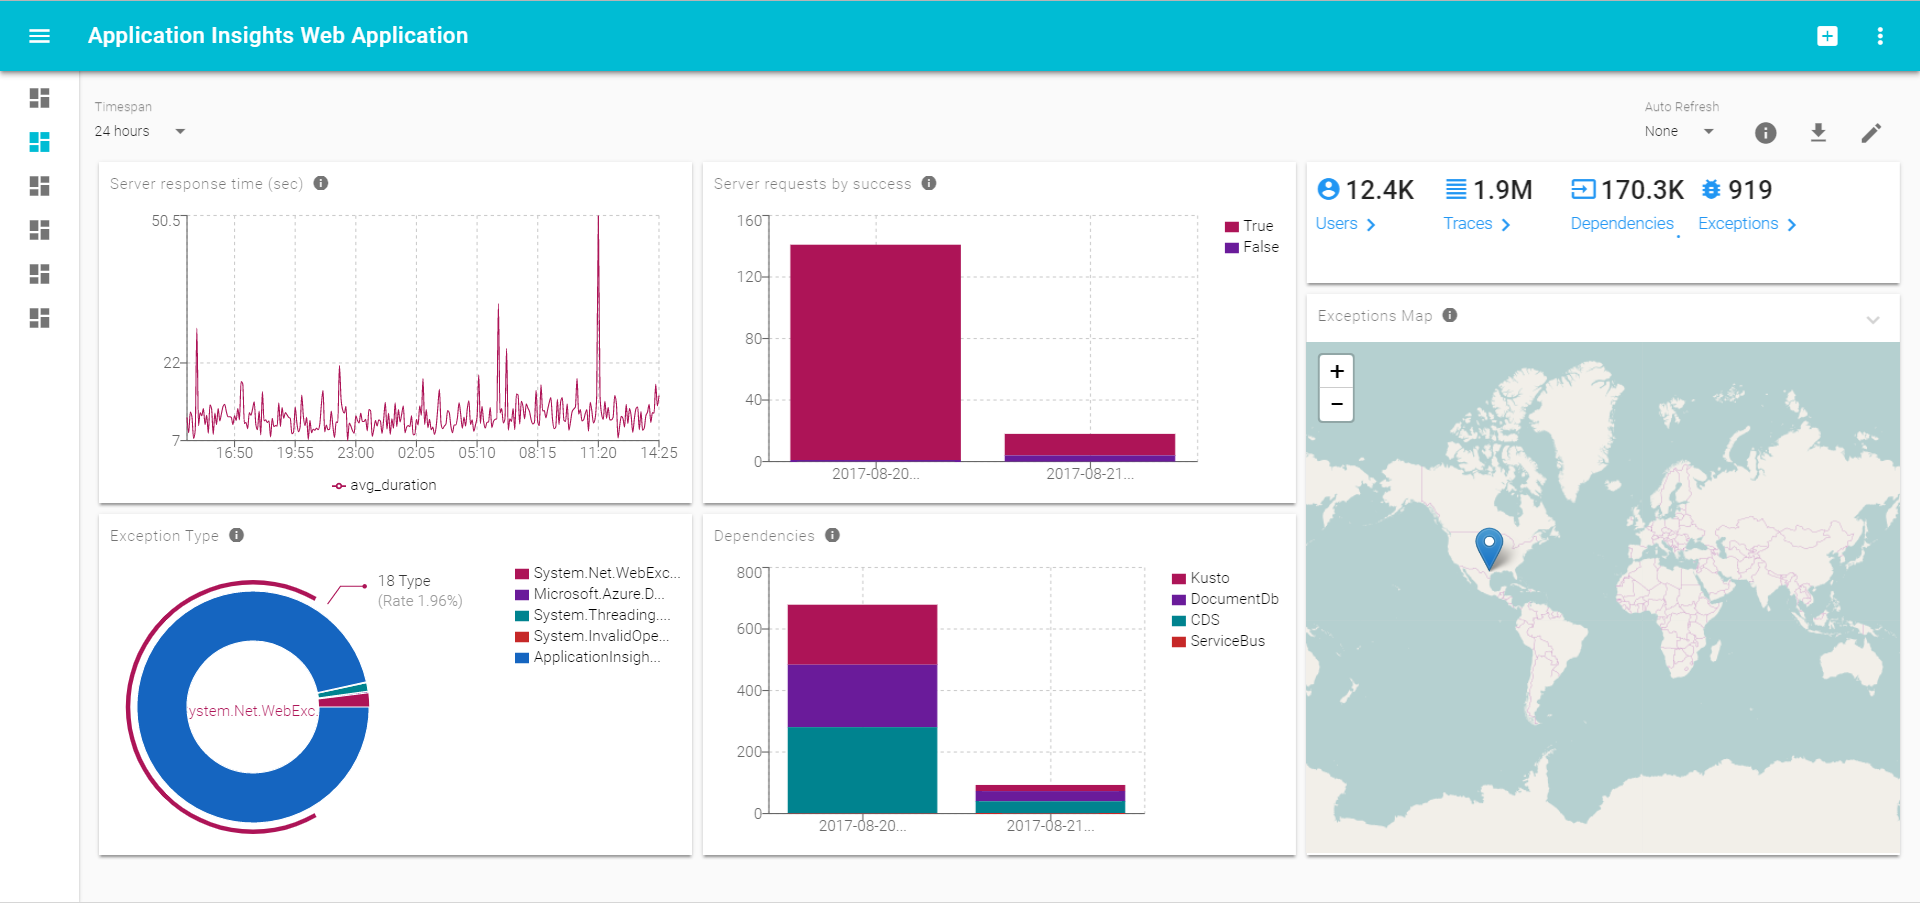
This dashboard connects to the native Web App schema which is logged into Application Insights.
Conclusion
Ibex is one of the alternatives offered today for a dashboard framework, and its key differentiation is a focus on drill-down, reusable templates, and holistic configuration. While it might take a little more effort to build an Ibex dashboard, the flexibility for drill-downs makes it easy to manipulate, and once you create a template sharing it is also simple.
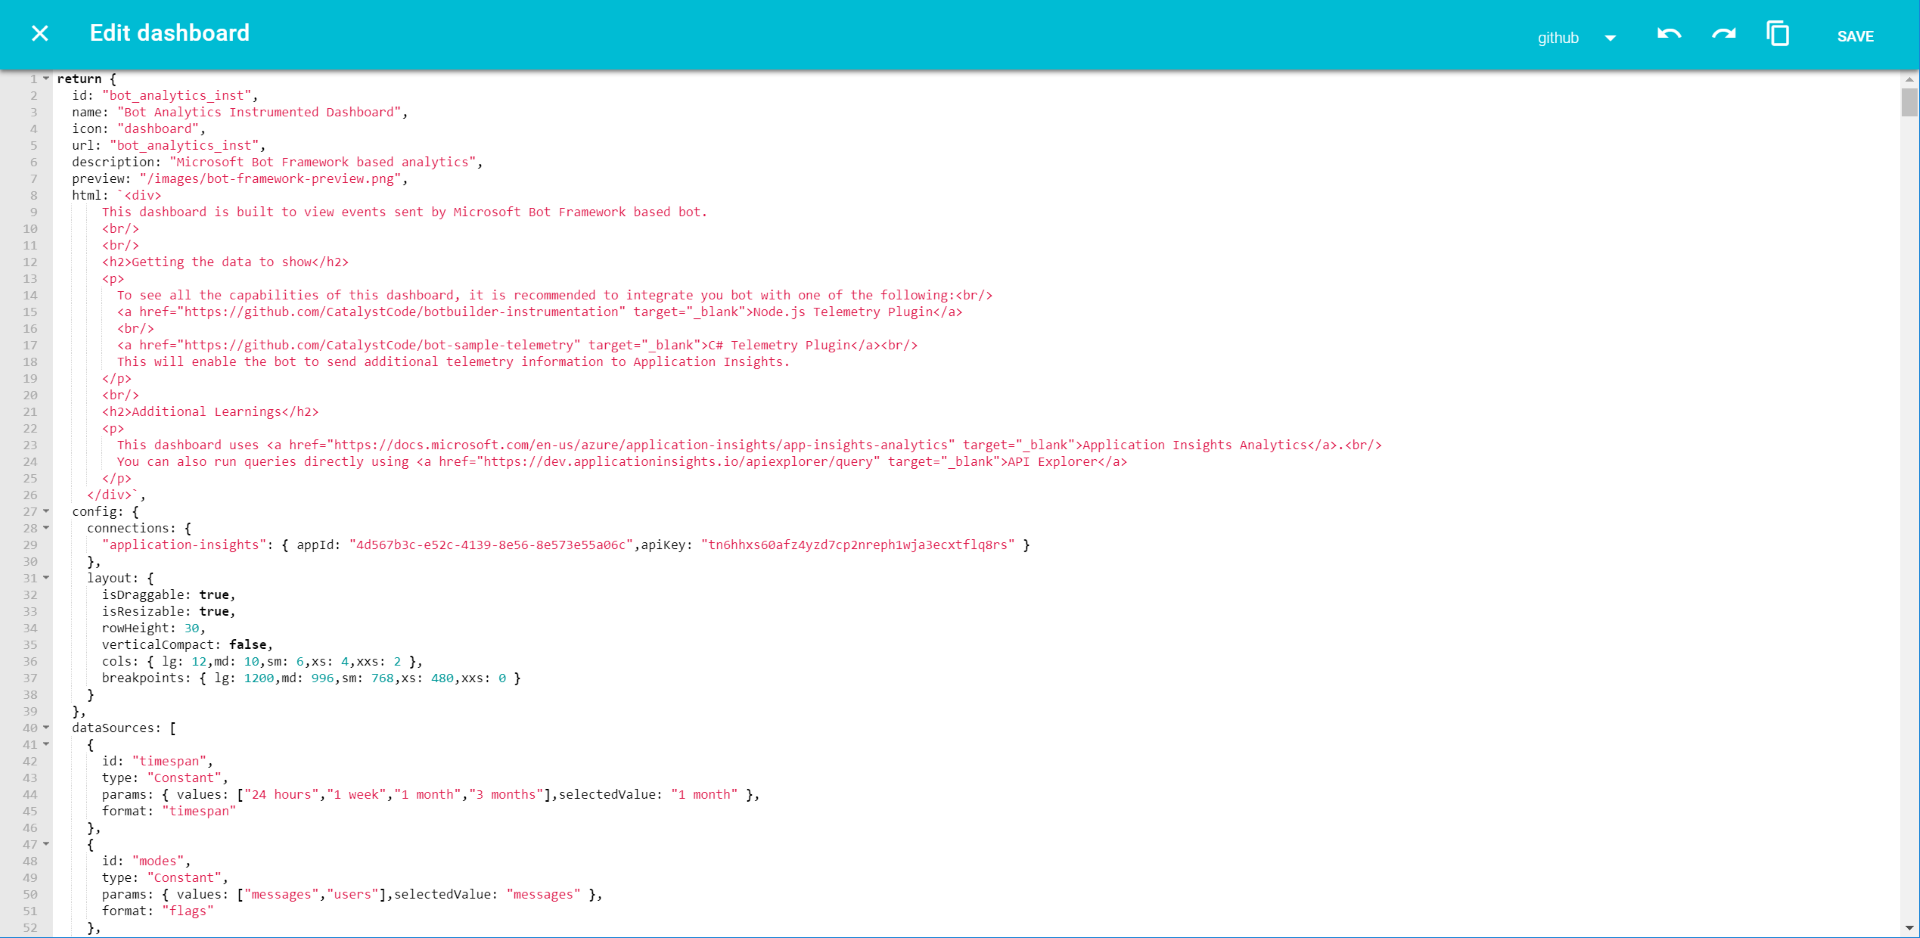
One of the main development efforts remaining for this project is user customization. Currently, you can customize dashboards online by editing their structure (see image below). While this approach is of great value for developers, it is not suitable for a general user, for whom a more intuitive approach is required (a drag-and-drop system, and a collection of input fields that control the various parameters).
Contribution and Development
Please refer to the contribution and development guide for this project, which includes a detailed list of features and documentation of all development aspects.
Sample Templates
To better understand the templates we built the following sample templates:
- Basic Sample, a very simple dashboard with a sample data source connected to visual elements
-
Basic Sample with Filters, the same as Basic Sample, but with a filter applied to the data source
-
Basic Sample with Dialog, the same as Basic Sample, but with a dialog displayed on entity clicking
- Application Insights Sample, a dashboard with a simple connection to Application Insights