

Introduction / Context
In 2022, Microsoft CSE was involved in the 2nd phase of a Smart Factory Transformation leveraging Microsoft technology to build an Industrial Internet of Things solution for factory automation. The first engagement is greatly described in the following CSE dev blog.
Azure IoT Edge was leveraged in this engagement. The Linux Edge VMs running inside the factories were strictly operated by the Customer’s Production IT engineers only. Given that the development team could not access the Edge VMs in production, it was important to find a way to observe the VMs at the Edge. Additionally, we needed to have a way to upload the Edge devices’ logs and metrics to the cloud. This allows for L1 and L2 IT support monitoring and issue troubleshooting from the Azure portal.
Ideally, both logs and metrics should be available in real-time so that we have the most up-to-date information when it comes to troubleshooting an issue.
And finally, in terms of impact, such a solution would allow the customer to reduce downtime and signal loss, which is a very important Key Performance Indicator at the business level.
Out-of-the-box solutions leveraging Azure IoT resources
Let’s first quickly describe what we can do out-of-the-box with IoT Hub and IoT Edge from the Azure portal, then understand the associated limitations and why an additional solution that continuously pushes the logs to a Log Analytics Workspace would be more interesting.
1. Troubleshooting from the Azure Portal
You can access the logs generated by your IoT Edge module from the Azure portal. For that, go to your IoT Hub, select your IoT device, then go to the Troubleshoot tab:

You will then be able to view the logs for each of your IoT Edge module.
The pros of this solution are:
- That it is available out-of-the box.
- And can be adapted and sufficient to troubleshoot simple issues.
But it is very limited, the main cons being:
- You are limited to 1,500 lines of logs.
- The module needs to be reachable from your IoT Hub.
- It is an approach where you pull the logs on demand. It is not real-time, you only have the logs at the time the method was invoked, not the latest ones.
2. EdgeAgent Direct Methods
Another option you have is to leverage the following IoT EdgeAgent module’s direct methods:
- GetModuleLogs
- UploadModuleLogs
- UploadSupportBundle (since version 1.0.10 — oct 2020)
- GetTaskStatus
These methods can be invoked from the Azure portal: see Retrieve IoT Edge logs – Azure IoT Edge for more information.
GetModuleLogsandUploadModuleLogsare synchronous. AlsoGetModuleLogsis limited to a maximum payload of 128 KB which is the upper limit for direct method as the logs are returned in the HTTP response.UploadSupportBundleis asynchronous: you pass the SAS URL of a Blob Container, and once invoked the IoT Edge Agent returns a correlationId you can use withGetTaskStatusto monitor the state of the operation. Asynchronously, the Edge Agent runs the iotedge support-bundle command on the IoT Edge device, generates a zip file of the logs, then uploads it to the SAS URL you provided.
See Troubleshoot – Azure IoT Edge
The pros of this solution are:
- Leverages existing Azure IoT Edge direct methods.
- Leverages the support-bundle which proved to be a good solution to debug issues on IoT Edge in the context of this engagement.
- Overcomes the limitations in numbers of lines that you have when getting the logs from the IoT Hub on the Azure portal.
And the cons:
- Potential connectivity issues when the Edge host or Edge runtime are not reachable.
- Each direct method invocation will produce a new bundle. This means we don’t have a consolidated view of all the logs spanning different bundles and we aren’t able to run sophisticated analytics queries without additional processing.
- Not real-time: we only have the logs at the time the support bundle was produced, not the latest ones.
- On demand: it is a pull model approach.
3. The Metrics Collector Module
A complementary solution is to leverage the Metrics Collector Module that belongs to the Industrial Internet of Things Platform (see Collect and transport metrics – Azure IoT Edge and Tutorial – Azure Monitor workbooks for IoT Edge).
This solution assumes modules emit metrics using the Prometheus data model (see Data model / Prometheus) endpoint. That is the case for the runtime modules EdgeAgent and EdgeHub, but is to be implemented for custom modules which may be an issue if you don’t have access to the source code.
The Metrics Collector Module collects metrics from Edge modules, using a pull model approach. Then, it pushes them to a Log Analytics Workspace or to the Edge Hub, leveraging a push model approach.
From there they are displayed in Azure Workbooks in IoT Hub, which are provided by Microsoft, in a custom dashboard that monitors the entire solution. Custom alerts are then triggered if the Edge devices are deemed unhealthy based on available disk space or system memory, device-to-cloud message queue length, and the last time the Metrics Collector module has successfully transmitted metrics data.
The pros of this solution is that:
- It is available out-of-the-box for the metrics produced by the EdgeAgent and the EdgeHub modules and also with some specific modules related to the Industrial Internet of Things Platform.
The cons are that:
- You need to expose and implement Prometheus endpoint for your custom module.
- It is oriented on metrics, not on logs or traces.
Going forward with a push model approach
It would be great to:
- Redirect in real-time the logs produced by IoT Edge modules to a dedicated process running on the Edge.
- From this process, forward the logs to an Azure Log Analytics Workspace or any other configured sink.
Indeed, the two preceding requirements can be implemented leveraging the following technical features:
- IoT Edge modules run as Docker containers.
- Docker uses logging driver to manage the logs produced by the containers.
- The Fluentd log driver can redirect the logs to a Fluentd server running at the Edge.
- This Fluentd server can be configured to push the logs to a sink such as Log Analytics Workspace.
Finally, an interesting Fluentd server worth consideration is Fluent-Bit, an open-source log processor and forwarder, which allows you to collect logs from different sources, enrich them with filters and send them to multiple destinations. Fluent Bit is also a CNCF (Cloud Native Computing Foundation) subproject under the umbrella of Fluentd (see Fluent Bit surpasses three billion downloads).
The following diagram illustrates the overall architecture of the solution:
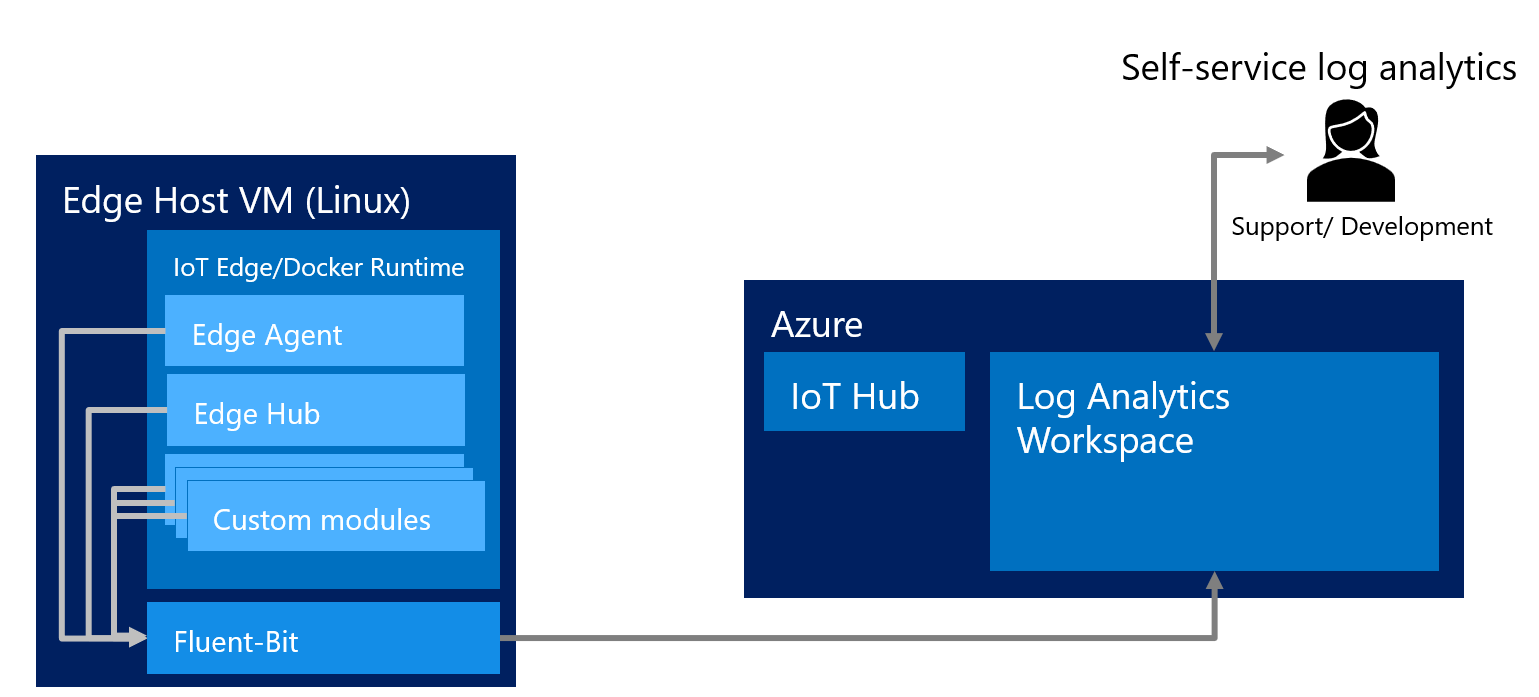
The pros of this solution are:
- Real-time solution: it is a push model approach where logs are pushed continuously.
- It is non-intrusive, as the code of the existing IoT Edge modules does not need to be adapted.
- The cost to industrialize such a solution is very low.
- Allows to leverage the power of Azure Monitor and Log Analytics Workspace:
- Create Alerts (see Azure Monitor / Create Alerts, the service to monitor being Log Analytics).
- Create Workbook (see Azure Monitor / Azure Workbook).
- Run sophisticated queries (see Logs Analytics Queries).
And the cons:
- We can only capture and forward the Docker logs and not, for example, the result of the
docker inspectcommand nor the result of theiotedge checkcommand. Consequently, the support-bundle remains a complementary solution. - Log Analytics Workspace is an ‘expensive’ resource (1 GB ingested daily costs around 90 €/month). Meanwhile, it is possible to significantly reduce this cost by considering Basic Logs instead of Analytics Logs (see Log Data Plan). Moreover, this disadvantage must be put into perspective when considering that this solution can significantly reduce the downtime and signal loss because the team can more quickly find and fix the root cause. As such, this cost might be very well invested money.
Setup / Configuration
Setting up such a solution is a two-step process:
Step1: you first need to install Fluent-Bit on the Edge Device
- Fluent Bit must be first installed on the targeted Linux Edge device:
1.1 See Fluent Bit installation on Ubuntu.
1.2 If your edge device needs to communicate through an http proxy, which is typically the case for the VMs deployed on factories, you will need to run
sudo systemctl edit fluent-bit, then add the following statements:[Service] Environment=HTTP_PROXY={your_http_proxy_url} - Fluent-Bit configuration file located at /etc/fluentd/fluentbit.conf must be set to redirect the logs to a Log Analytics Workspace. Also, to enrich the log with your Edge deviceId, you need to explicitly define it in the FILTER section.
[INPUT] Name forward [FILTER] Name modify Match * Add edgeId {your_edge_id} [OUTPUT] name azure match * Customer_ID {your_log_analytics_workspace_id} shared_key {your_log_analytics_workspace_access_key} - Start Fluent Bit on the Edge device:
run
sudo systemctl start fluent-bit - Configure Fluent Bit to autostart at host start-up
- cp /lib/systemd/system/fluent-bit.service /etc/systemd/system/fluent-bit.service
- systemctl daemon-reload
- systemctl enable fluent-bit
Step2: Configure each IoT Edge module to use the fluentd log driver:
For this, in your Edge solution deployment manifest, for each module, set the createOptions.HostConfig.LogConfig.Type property to “fluentd” as illustrated hereafter for the edgeAgent module:
"edgeAgent": {
"settings": {
"image": "__ACR_NAME__.azurecr.io/azureiotedge-agent:___AZUREIOTEDGE_AGENT_VERSION__",
"createOptions": "{"HostConfig": {"LogConfig": {"Type": "fluentd"}}}"
}
...
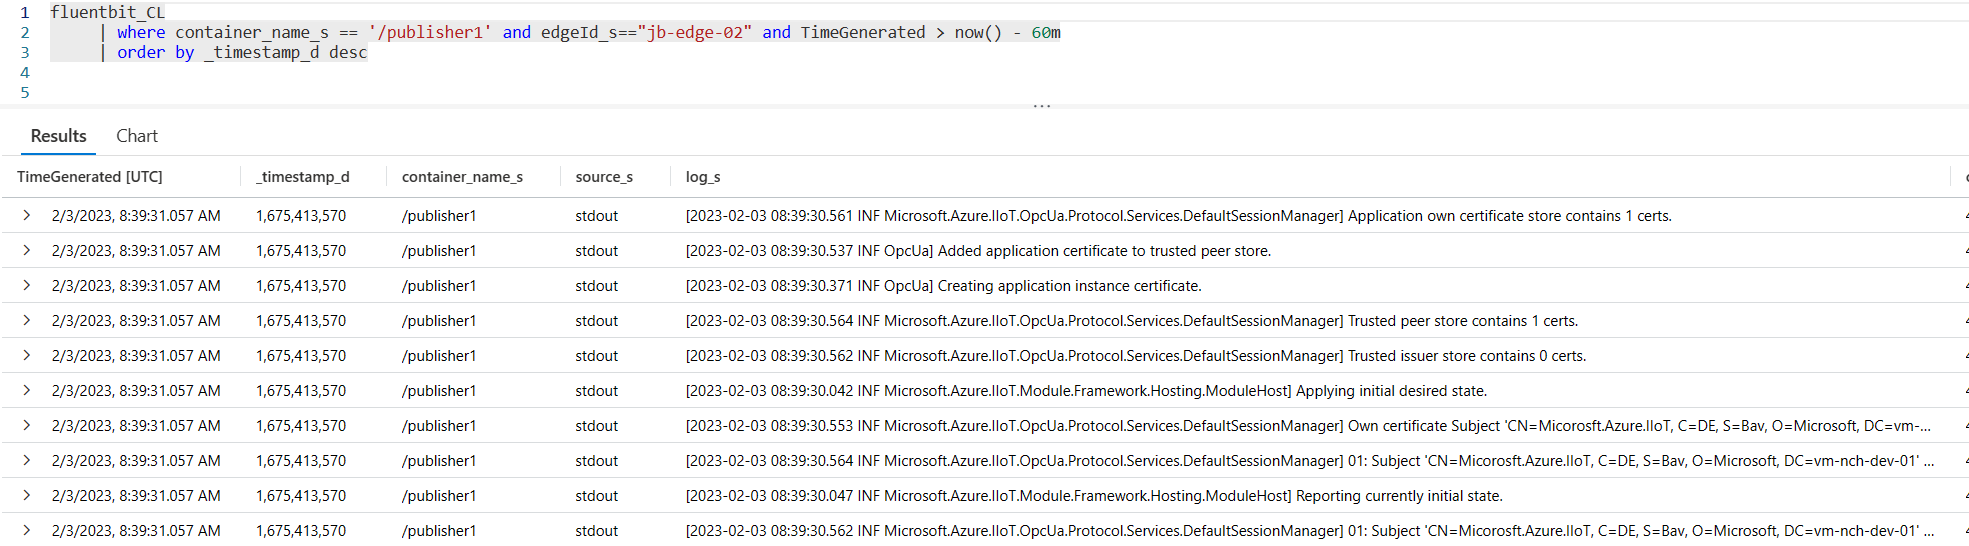
}Once the adapted deployment manifest has been deployed, you should start to see some logs in your Log Analytics Workspace in the fluentbit_CL table.
Conclusion
Leveraging a push model approach, where logs are continuously sent to the cloud, as a complementary solution to the Metrics Collector module and to the on-demand generation of a support bundle, reveals to be very interesting for the customer, both for initial roll-out, then for the operations. It helps to more quickly find and fix the root cause of an issue when it occurs, and consequently to significantly reduce downtime and signal loss, which has great impact at the business level.
Also, following an initial training and the handover of this solution to the Prod IT team, and by leveraging an installation script we delivered, this solution can be deployed in less than 15 minutes on a given factory.
This solution also enables customer production support teams by empowering them to solve issues without depending on developer intervention.
Finally, I strongly encourage you to experiment with this push model approach, following the 2 steps defined in the preceding Setup / Configuration section. You will be surprised how easy it is to be deployed and how powerful it is compared to the existing out-of-the box solutions.
Acknowledgements
Great thanks to Vitaly Slepakov, Cloud Solution Architect from the Microsoft IoT Team in Germany, and to Suneet Nangia, Principal Software Engineer at Microsoft Commercial Software Engineering, for their support and to have significantly influenced the preceding solution.