

Purpose
As an Engineering team on Microsoft’s Commercial Software Engineering (CSE), we strive to empower customers to build and maintain their software-based solutions. A key factor in being successful in our goal is to educate, upskill and develop the solution by applying certain Engineering Fundamentals.
Engineering Fundamentals are essential principles and characteristics that contribute to high quality enterprise solutions. These include:
- An organized and well-defined backlog that captures the features the team will build
- Tooling for the team to manage the code base, and introduce mechanisms for code reviews
- Designing the solution and the engineering processes with Security from the beginning
- Quality rigor through the form of testability and code coverage
- Observability mechanisms that allow the team to analyze usage trends, troubleshoot issues, and identify opportunities for improvement
- A seamless developer experience that maximizes the productivity of the engineering team
- CICD (Continuous Integration and Continuous Delivery) to have a consistent process to take code contributions and seamlessly deploy the updated solution to an environment
This article is a part of a series of articles where we dive deep into one of these Engineering Fundamentals.
Each article will share the team’s journey, challenges, and learnings to apply each principle alongside the customer’s team.
Other articles in this series are:
In this article, we will cover Observability.
Introduction
Building a software solution using microservices offers many potential benefits:
- Modular architecture design
- Easy integration and updates
- The ability to swap out failing services instead of an entire system
- Resilience in the event of load-heavy scenarios.
With all this, however, there are unquestionable drawbacks to building in this manner, especially in the case of observability and monitoring. Many small services can mean many areas that need monitoring which, as with any complex system, will eventually cause something to break.
To understand what went wrong and why, we need to ensure that we have comprehensive telemetry and logging enabled across the entire system. This post seeks to provide some insights learned, from the trenches, in implementing an observability suite across a microservice-based architecture. To ensure the reader has shared context with the author, a section titled “Common Terminology” has been included below.
Common Terminology
- Logs: text-based records of events occurring while an application is running. Logs can be emitted from the application level (traces) or from a server itself.
- Metrics: represent numerical values that can be used to measure overall system performance. Examples include CPU (Central Processing Units) usage, disk usage, and network activity.
- Correlation ID: a globally unique identifier (GUID) generated when a request is made or received to track the request over its lifetime.
- Logging Sink: the resting point for all logs generated throughout the system. When the system creates a log, it is emitted to its sink, which can be either the console, a file, or a remote storage location like Application Insights.
Solution Profile
The system is an entity responsible for managing and orchestrating document workflows. For instance, the system can allow a user to define a Packet filled with files that need to be signed, agreed on, concurred with, as well as several other interactions. The previous system in place was an older monolithic SharePoint-based web app that did not do well when over 100K requests are made to create packets every hour. In our effort to revitalize the system, the team decided to scaffold a net-new implementation based on a more modern architectural style. A detailed component diagram that illustrates the individual parts can be found below.
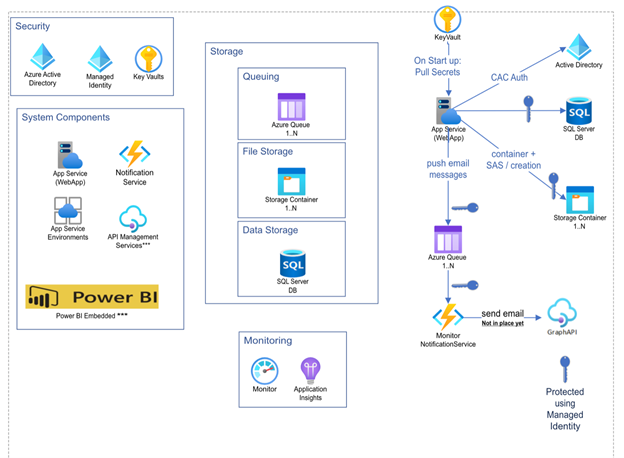
The overall architecture for the system is beyond the scope of this article, however it is helpful to mention the necessary components that make up the system. One can see that with so many moving parts, like the .NET web app and Azure Functions, it is important to be able to capture logs in a manner that makes sense to the end user.
Ideally, we would be able to track the entire series of events that are all related to one request. The diagram below depicts the behavioral flow for creating a Packet, which is one of the many flows that need to be captured in the system.
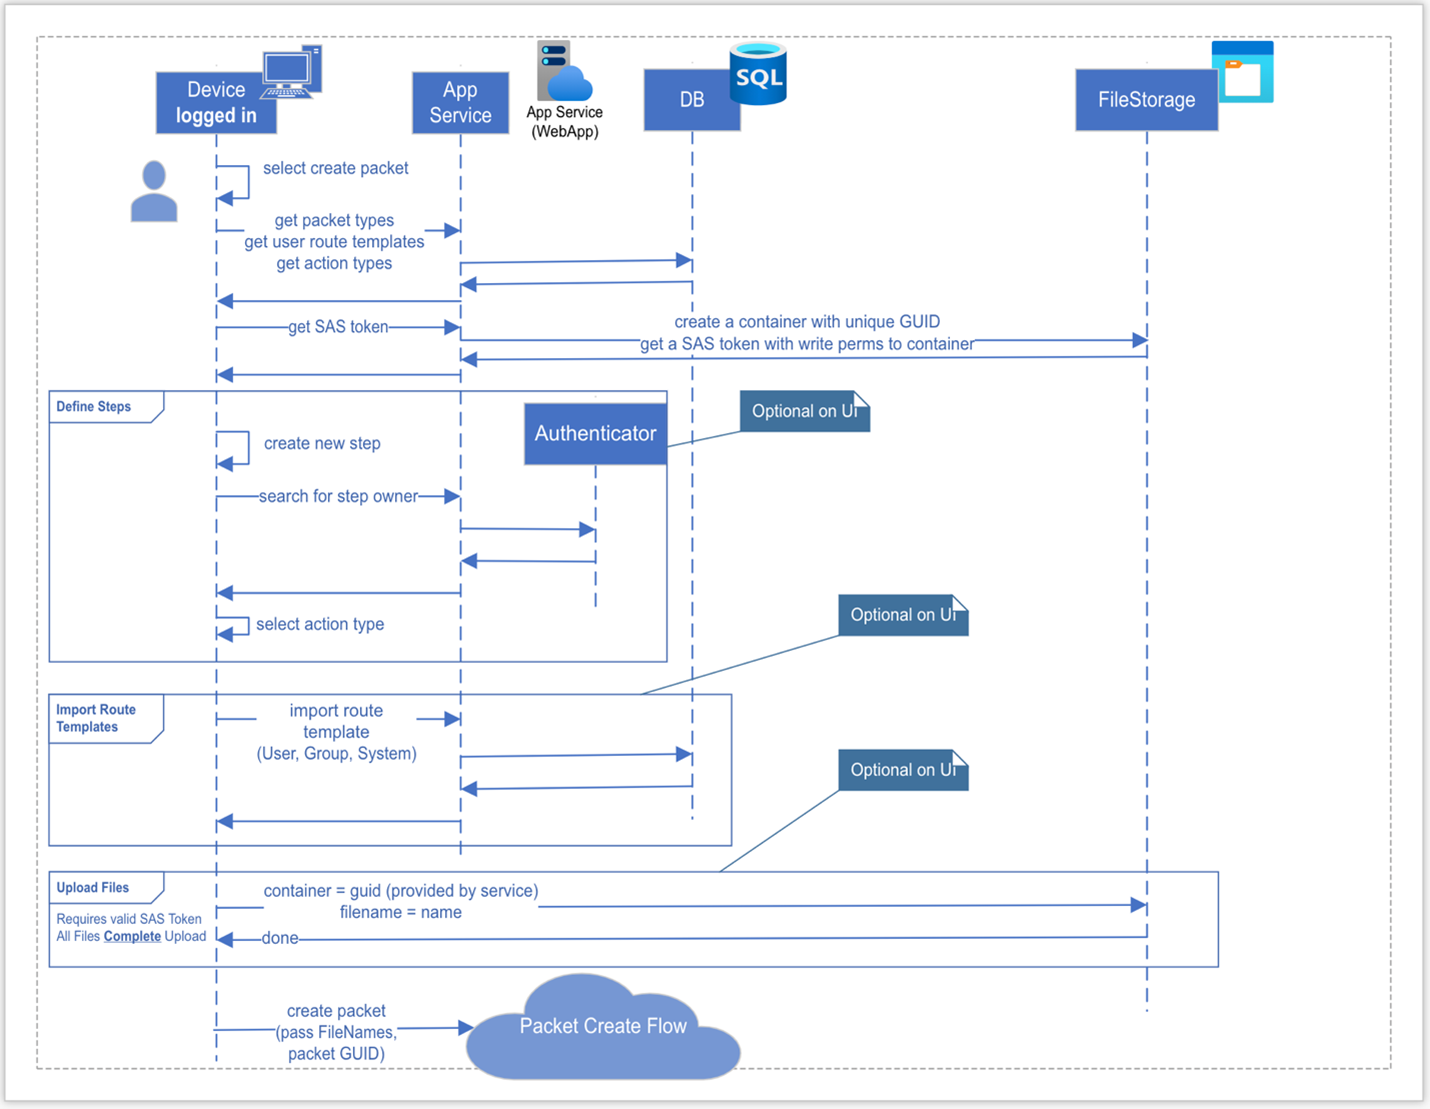
After viewing the flow, one can see that there are a lot of individual processes that make up the greater system. Where there is complexity, there is always the risk of something going wrong, hence the need for proper telemetry logging and collection.
Measuring the Functionality of the System
Monitoring the system is just as critical as building it, so when scaffolding these processes and flows, we made it a point to make observability a first-class citizen in the project.
The Web API is ASP.Net Core based, so making use of ILogger for emitting logs was straightforward and well documented. That said, we were faced with some key questions when trying to make use of our logs:
- Where would we emit the logs to be viewed in aggregate?
- How would we be able to track the lifetime of a specific request across the system?
- When filtering logs, how would we be able to make sense of all the logs?
Viewing Logs in Aggregate
To answer the first question, we turned to investigating commonly used paradigms and patterns. Ultimately, we decided on making use of the LoggerMessage Pattern. The linked article focuses primarily on the performance benefits associated with logging in a statically typed manner, which is a distinct benefit for any application.
However, one of the key features this pattern offered us is not mentioned in the article: consistency. By building statically typed logging “templates”, we’re able to ensure consistent logging across the entire system. Consistent logging grants us analytical superpowers to query the logs for request progression, failure points, specific error or informational messages, and even manipulate and project our data into easy-to-digest tables and graphs. A logger message is made up of two primary components: an Action field and an extension method. The Action defines the log level, an event ID, and the log message template as seen below:
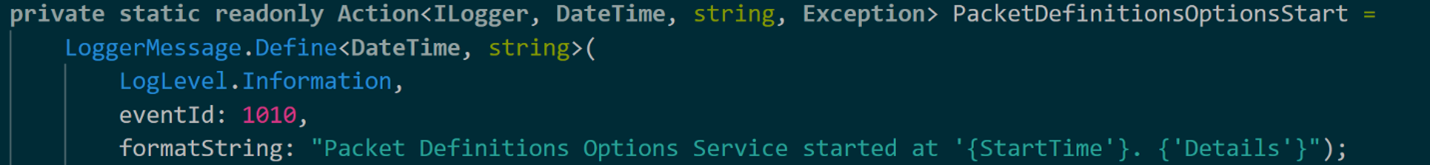
Notice how the Action defines log level, the event ID, and the formatted log message. This allows the developer responsible for aggregating logs the ability to query for a specific string or for a specific event ID. The Action uses the LoggerMessage.Define method to specify the types needed in the log message. If there’s an Exception, the stack trace is also included in the log. The above example accepts a DateTime that gets inserted into the format string. Depending on the specific type of log, the developer may also have the option to add additional contextual information with a string parameter for details. The extension method that references the Action can be found below.

This method is the component called when attempting to log the message defined in the Action. Note that since this is an information level log, there is no need to capture Exception details, so a null is passed here instead. Since they are static extension methods for any ILogger, all one must do to call this is the following:
logger.PacketDefinitionOptionsExecuting(DateTime.Now, "example process name")
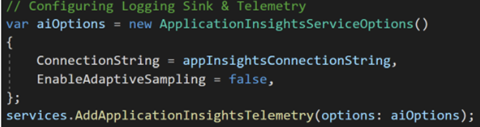
Initializing the logger sink is relatively straightforward as well. In our case, we used Application Insights, and initializing the sink occurs in the Startup.cs file:
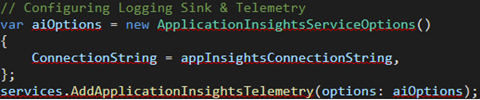
All that is needed is to set up the service by adding a connection string in the ApplicationInsightsTelemetryOptions object and explicitly adding the ApplicationInsightsTelemetry service.
Tracking Requests Throughout the System
To answer the second question: In considering the best way to go about tracking events across the system for a provided request, the team decided that adding the generation of correlation IDs was the best possible way to handle it. Specifically, this meant that a unique ID would have to be generated at the time the request was made and propagated throughout the system as a field in every logging event. This was achieved by building a middleware layer into our ASP.Net Core web app. Below is an example of the LogHeaderMiddleware class.
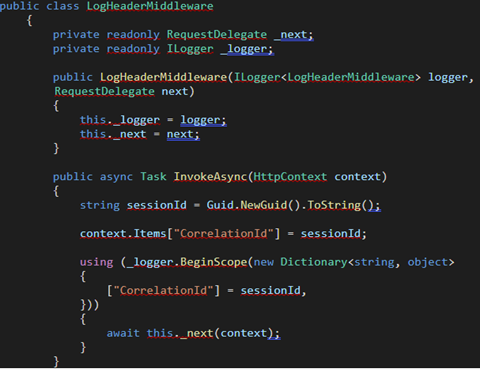
The middleware is responsible for generating the correlation ID upon a new request being made to the system and creates a scope for the logger to attach the id to every event that happens in the system. The above class, LogHeaderMiddleware, is instantiated and registered in the Configure method of the Startup.cs file:
app.UseMiddleware<LogHeaderMiddleware>();
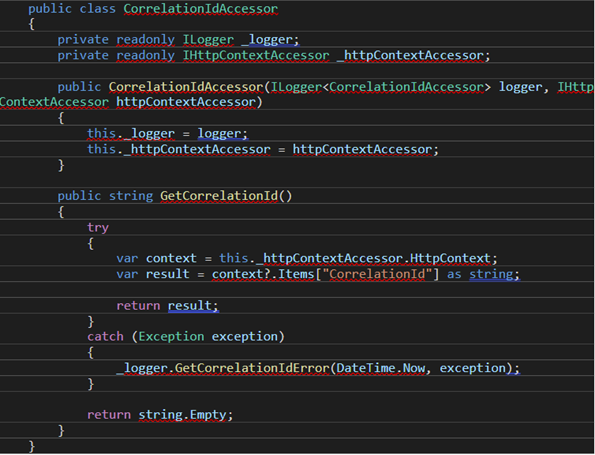
This works for attaching the correlation ID to every log in the web application, but there comes a time when the system sends a message to an external component. In our case, we drop messages into an Azure Storage Queue. When that happens, we need to extract the correlation ID from the web app’s HttpContext and send it along with our payload when emitting the message. We achieved this by writing a class responsible for fetching the correlation ID:
Querying Logs in Application Insights
To answer the last question, once we have emitted the logs to a proper sink, the next concern is querying them in a way that tells a story of what’s happening in the system. Thanks to the structured logs we created using the LoggerMessage pattern, we have a lot to help us in this regard.
Azure Application Insights provides the developer a web-based editor to query logs using the Kusto Query Language (KQL). The “formatString” and “eventId” fields are extremely useful for querying logs in Application Insights. For example, to determine all the failed login scenarios across the system, the developer can query using the template string “Failed to log the user in at ‘{FailureTime}’. ‘{Details}’” or they may use the event id “3002”, a direct reference to the logger message we created.
Querying Logs by Event ID
To query by the “eventId” field, we should expand that field to its column. To do that, we may use the `extend` function in Kusto:
traces
| extend eventid = tostring(customDimensions["EventId"])
| where eventid startswith "3"
This short query allows us to fetch all logs with an eventId starting with 3. In our logger messages, all our “Information” level logs count upwards from 3000, so this query will return all info messages in the system. This works well for isolating errors in the system, but there are some caveats that must be built in to return a more readable table. For example, our system included a Timer-based Azure Function that would log every time it fetches messages from a queue. This causes a lot of noise in the logs that we didn’t care to see, so we filtered them out with this command:
traces
| where operation_Name !has "NotificationMonitor"
Application Insights provides custom Operation Telemetry that tracks requests and calls to individual services. Those services are exposed via a field in the logs called the “operation_name”. The above snippet allows us to get just the logs from the component we want by filtering out the irrelevant ones
Challenges Collecting Telemetry in the System
We encountered an interesting challenge when attempting to query logs for every event a request underwent:
When querying for correlation id specifically, we would see instances where there were gaps in the request lifecycle.
For example, if events 001, 002, 006, and 007 were logged, we observed that events 003 – 005 were missing. After hunting deeper into the problem, we found that Application Insights enables a feature called Adaptive Sampling by default. Instead of emitting every log to the service, in order to save on storage costs and compute overhead, only a sample of logs for the overall system is sent to Application Insights.
While this is a welcome feature, it did confuse us quite a bit, especially given our status in the project. Adaptive Sampling makes perfect sense for a production workload, but in a dev/test environment more telemetry is always welcome. We learned that, while testing, we could disable the sampling feature in the same place we registered the logger with a simple command:
After doing more research, we also instructed the customer to consider a custom sampling strategy that best meets their needs. More information regarding custom sampling mechanisms can be found in the Application Insights documentation
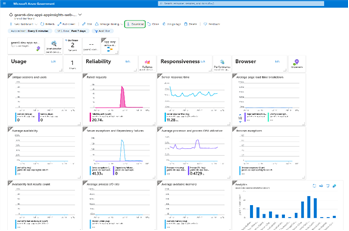
Displaying Telemetry Data with Dashboards
A useful feature for an observability platform like Application Insights is its ability to use Kusto to render charts and graphs. This is helpful for conveying information about the health of the system to members of the team that may or may not have technical experience. There is also a way to package a template of the dashboard so that the team can reuse them across multiple environments.
Creating graphs and charts is as simple as drafting a query and using the render keyword to display a graphic that’s available to Application Insights. An example query that creates a pie chart detailing failures in the system can be found below:
traces
| where success !has "True"
| summarize FailedCount = count() by name
| render pichart
This flexibility allows us to draft queries and view their output rather quickly. Furthermore, if we intend to keep the visualization, adding it to the dashboard is done with a button click. Versioning and sharing the dashboards across different environments is also possible with Application Insights as well, though we did encounter some challenges.
Challenges Sharing Dashboards Across Environments
When verifying functionality for a system with graduated environments (ex: dev, test, and prod environments), it’s ideal to be able to use the same methods of verification. Since we already drafted a set of queries and created a dashboard in our shared environment, it would be preferable to clone that dashboard and use the same queries in our dev environment. Application Insights does allow for this functionality simply by clicking the Download Button.
This saves a JSON (JavaScript Object Notation) representation of the dashboard, complete with all our custom-drafted queries built-in! Initially, we assumed we could then move on to adding this JSON file to our codebase and using it alongside the rest of the application deployment stage in our CI (Continuous Integration) pipeline, but sadly it was not that straightforward.
While we had a JSON representation of the dashboard, all the resource identifiers were hardcoded into the file. This would require a manual step where the developer would have to remove the identifiers and replace them with template variables to be populated at the CI stage. Additionally, we were using the Cloud Adoption Framework(CAF) to create and provision all the infrastructure as targets for our deployments. Unfortunately, at the time of writing, there was no built-in functionality for provisioning the dashboards from CAF.
Finally, the only documentation we could find to deploy the JSON template of the dashboard was by using an ARM (Azure Resource Manager) template to do so. We consciously chose to lean away from ARM templates whenever possible, leaning on CAF and Azure Pipelines to do our deployment work. With that, we would have had to build this functionality into the CI pipelines, but sadly it was out of scope for the time we had left with the project. As a stopgap to achieve some portability of our queries, we simply made sure to save the queries off as .kusto files in a directory in our repo. At the very least, the queries can be reimported, and the dashboard rebuilt for subsequent environments.
Summary
By making Observation a first-class citizen from the beginning, the customer will be able to extend the logs produced by the system and create dashboards with the metrics and insights that they define over time. This adds business value by enabling the team to proactively detect abnormal system behavior, improve the troubleshooting of errors by searching the logs, and produce metrics of the system usage.
If you want to find out more about Application Insights, please refer to the Microsoft documentation.
Team Members
The CSE US Government team below was instrumental in delivering the impact throughout the engagement, and in sharing our journey through the form of this article.
- Gavin Bauman *Primary author of this article
- Adrian Gonzalez
- David Lambright
- James Truitt
- Jordon Malcolm
- Kristin Ottofy