
Analysing Bot to Human Hand-off Interactions
Analytics is an important aspect of any application, whether it be a mobile app, a website, or even a bot. With the recent rise of bots, more and more engineers are interested in analyzing the interactions customers have with their bot. To address this growing demand our team built the Ibex Dashboard, an Application Insights-based project that displays a bots analytics dashboard. We are currently expanding it to include other dashboard types, such as Health and Gaming.
A common use case in the bot-verse is the ability to hand over a customer conversation from a bot to a human, and the critical need for a feedback loop in this kind of scenario. During a recent engagement with Sage, we developed a Hand-off Dashboard Template that can be used with the Ibex dashboard to provide details and insight about how a solution’s bot and agents are working with customers.
Business Case
Recently we worked with Sage, a software company that builds accounting products, to help them implement the Ibex dashboard for their Pegg bot, which had already been developed with the Microsoft Bot Framework.
The Sage engineers also wanted to implement the bot to human hand-off feature with analytics about the hand-off interactions. They wanted to be able to answer important questions, such as:
- How many times has a customer been handed over to a human?
- What are the average, longest and shortest waiting times for a customer who has been handed over to a human?
- How many people are currently waiting to speak to a human?
- How many people are currently talking to a human? How many to the bot?
- How many users does the bot currently have?
- How is the bot doing over time?
- Has there been an increase of people asking to speak to a human over time?
- What do the conversations between a customer and a bot and a customer and an agent look like?
By analyzing conversation data, we are able to answer all of these questions. A dashboard that shows how your bot is performing and how customers are interacting with it provides great feedback that can help you improve the bot. The expectation is that over time, the bot will handle more user needs, resulting in fewer switches to a human to continue the conversation.
Bot to Human Hand-off Node.js Module
To get the hand-off dashboard working, we first had to implement the feature in the bot. A bot to human hand-off framework for the Microsoft Bot Framework Node.js SDK had already been developed. The framework, botbuilder-handoff, has been published to npm and requires very little setup.
const handoff = require('botbuilder-handoff');

...

handoff.setup(bot, app, isAgent, {
    mongodbProvider: config.MONGODB_PROVIDER,
    directlineSecret: config.MICROSOFT_DIRECTLINE_SECRET,
    textAnalyticsKey: config.CG_SENTIMENT_KEY,
    appInsightsInstrumentationKey: config.APPINSIGHTS_INSTRUMENTATIONKEY,
    retainData: config.RETAIN_DATA,
    customerStartHandoffCommand: config.CUSTOMER_START_HANDOFF_COMMAND
});
The Hand-off framework provided a great starting point, but there were a few additional features that the Sage team needed, detailed below.
Azure Application Insights Logging
This feature enables engineers to have all logging data in one place, rather than having to pull data from several locations. The Hand-off framework originally only stored conversation data to MongoDB; we extended this capability by also logging the same data in Application Insights. We went with Application Insights because the Ibex dashboard currently uses it to display the general bot analytics.
Customer Message Sentiment Score
To improve the feedback loop about how the bot is doing with customers, we added a sentiment score for every message the user sends to the bot and to the human agent. This score can be used to analyze individual customer conversations and gauge customer satisfaction when interacting with the bot or an agent. It can also be used to automatically trigger a bot to human hand-off when the score goes below a certain threshold. We used the Microsoft Cognitive Services Text Analytics API for this feature.
You can read about how the latest version of the Hand-off framework was developed in our earlier code story.
Message Notifications
When offering a bot service, it’s important to have the ability to notify the users about certain events, such as important messages or new bot features.
Using the same structure as the Hand-off npm module, we developed a new npm package (botbuilder-notifications) that gives bot developers the ability to add an “admin to clients” notifications channel. With it, the admin user can schedule messages for its users and define the message content; when a user starts a new chat, the waiting messages will be displayed.
The feature is consumed as a Node.js module, and the integration process is straightforward:
const builder = require('botbuilder');
const notifications = require('botbuilder-notifications');

...

notifications.setup(bot, app, isAgent, {
    mongodbProvider: process.env.MONGODB_PROVIDER,
    directlineSecret: process.env.MICROSOFT_DIRECTLINE_SECRET
});
To use the feature, you must provide some sort of data store to save the messages. The current code base provides a default implementation that uses MongoDB, but could easily be modified to use other storage providers.
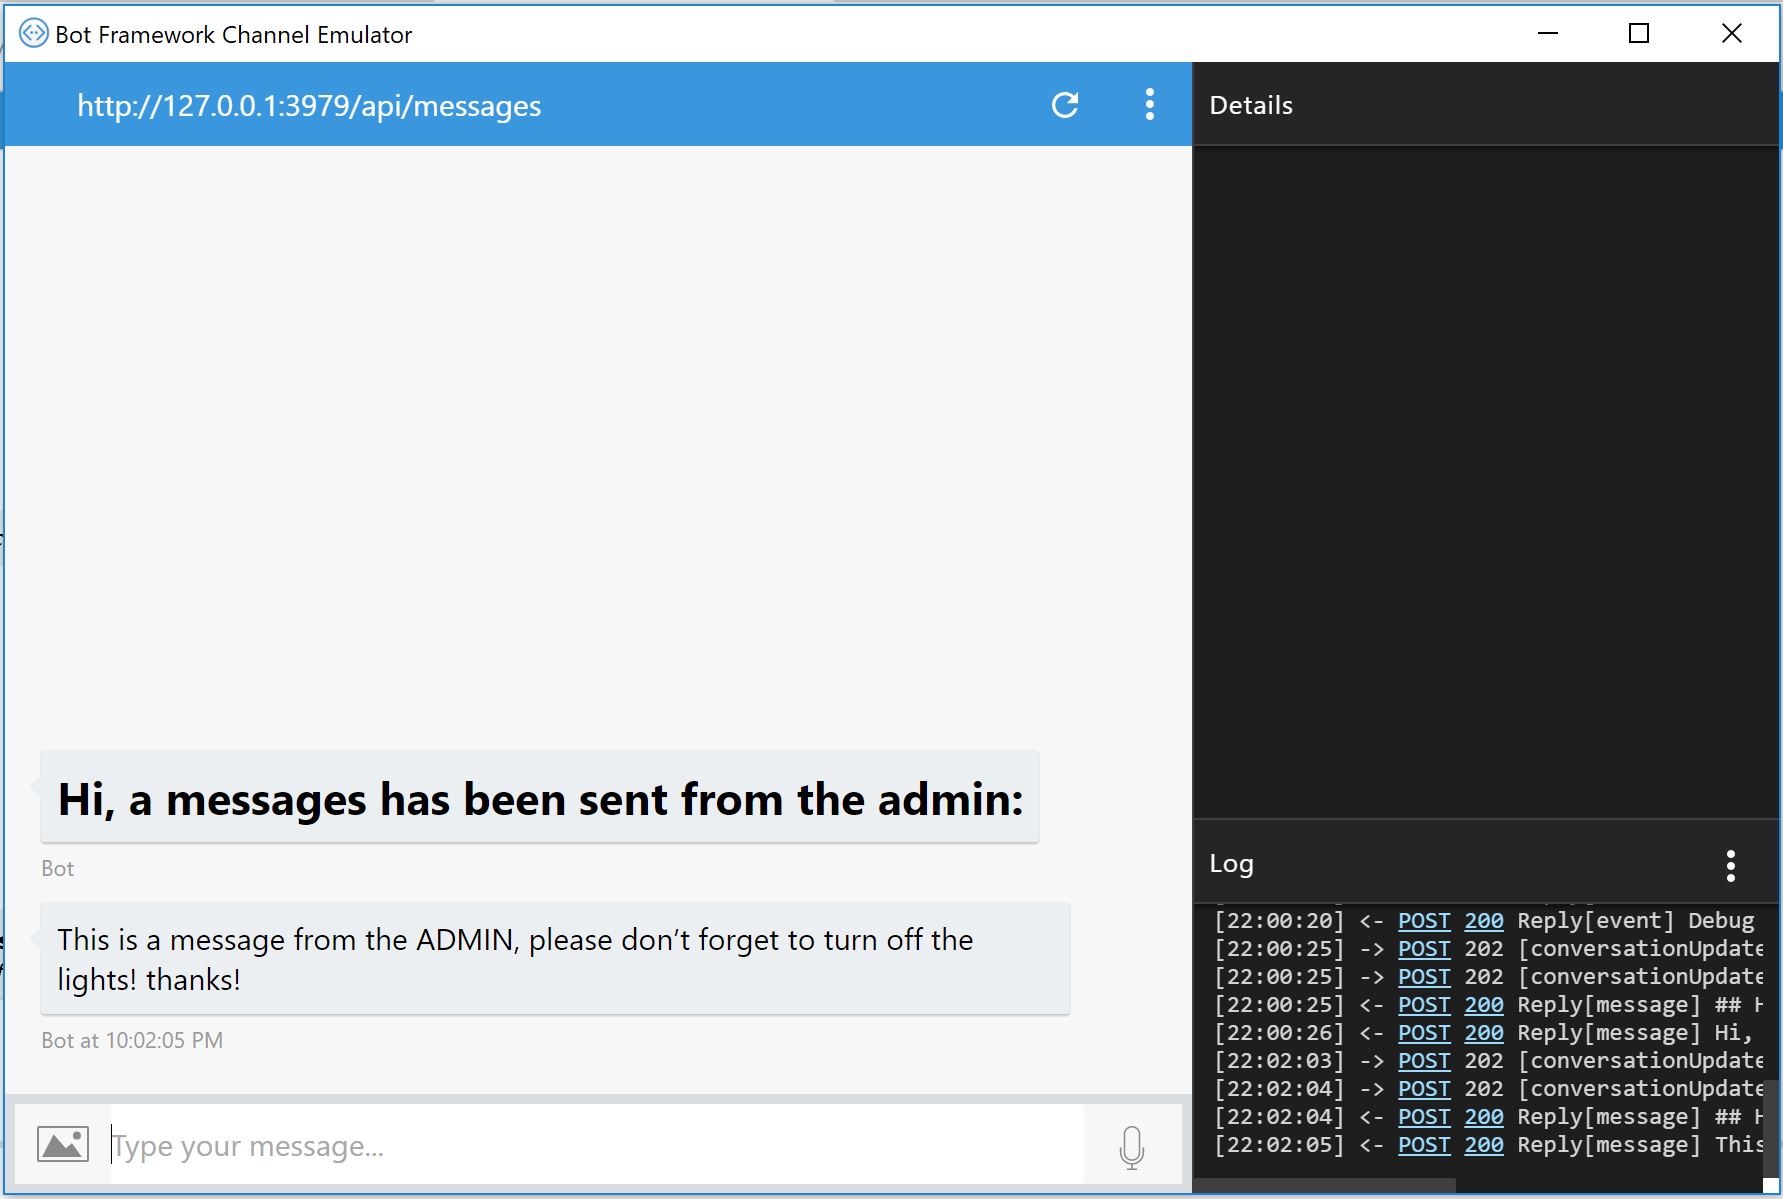
Scenario Example
To add a message to the notifications channel, the admin simply types “queue” followed by the message.
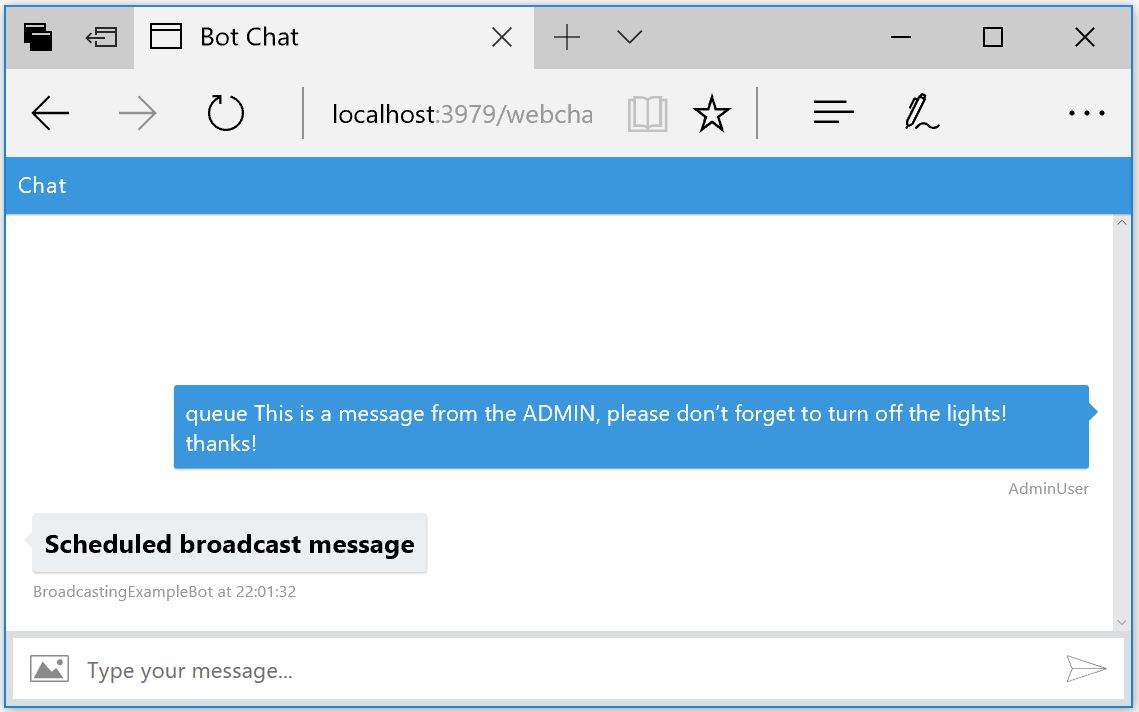
Another user, who just started a new chat, will automatically get the notification:
The notifications source code can be found on GitHub.
Capturing Bot Interactions Using Application Insights
To capture analytics for your bot when using Node.js, you can use the botbuilder-instrumentation package. There is also a simple instrumentation package available for C# bot projects.
npm install botbuilder-instrumentation –-save
The basic logging setup is as follows:
const instrumentation = require('botbuilder-instrumentation');

// Setting up advanced instrumentation
var logging = new instrumentation.BotFrameworkInstrumentation({
  instrumentationKey: process.env.APPINSIGHTS_INSTRUMENTATIONKEY,
  sentiments: {
    key: process.env.CG_SENTIMENT_KEY,
  }
});

logging.monitor(bot);
APPINSIGHTS_INSTRUMENTATIONKEY is your Application Insights Instrumentation key and CG_SENTIMENT_KEY is your Microsoft Cognitive Services Sentiment Analytics key.
Tip: for running on localhost, you can use the dotenv npm package to manage all the various environment variables.
"env": {
  "APPINSIGHTS_INSTRUMENTATIONKEY": "YOUR_APP_INSIGHTS_INSTRUMENTATION_KEY",
  "CG_SENTIMENT_KEY": "YOUR_LUIS_TEXT_ANALYTICS_KEY"
}
For more information, refer to the instrumentation readme section about capturing custom fields and events.
Once your bot instrumentation is set up, the bot data will start logging into Application Insights. You can try writing some queries in the Application Insights online query editor (using autocomplete). Please note it may take 5 minutes or so before your data is ready to query.
customEvents
| where timestamp > ago(1d)
In this instance, customEvents is the table name and > ago(1d) fetches records that are no more than a day old.
The Application Insights query language is well suited for visual illustration purposes. Application Insights allows users to query using multiple where clauses and summarize statements to aggregate the data as required. The bin() function is very useful for grouping sets of data sharing the same date or time interval. For more information, please refer to the online documentation.
Creating a ‘hand-off’ dashboard for the bot
Once you have captured bot data in Application Insights using instrumentation, you can create your own visualizations using the Ibex dashboard open source project. You can either choose one of the built-in templates and paste in your keys or add your own queries. The bot ‘hand-off’ template was created using the following Application Insights queries (using test data as an illustration).
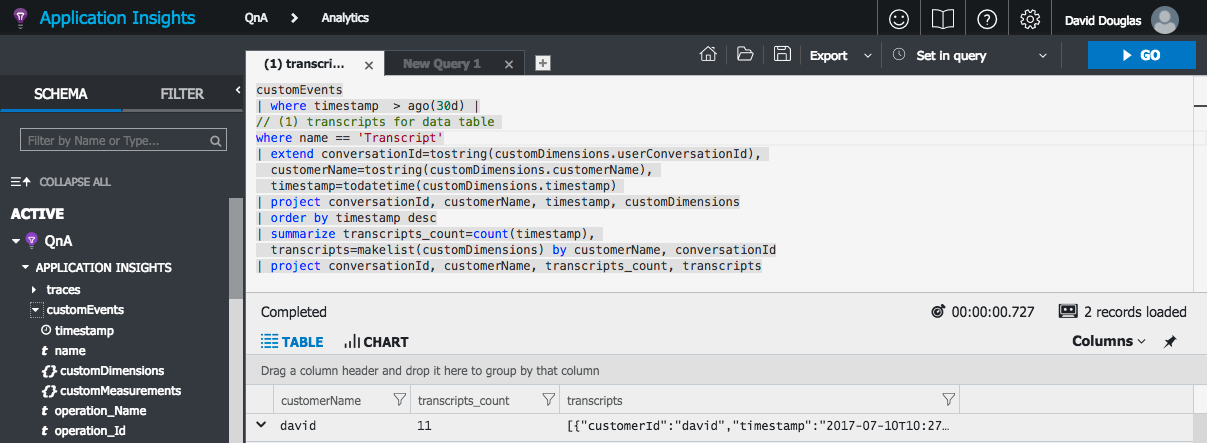
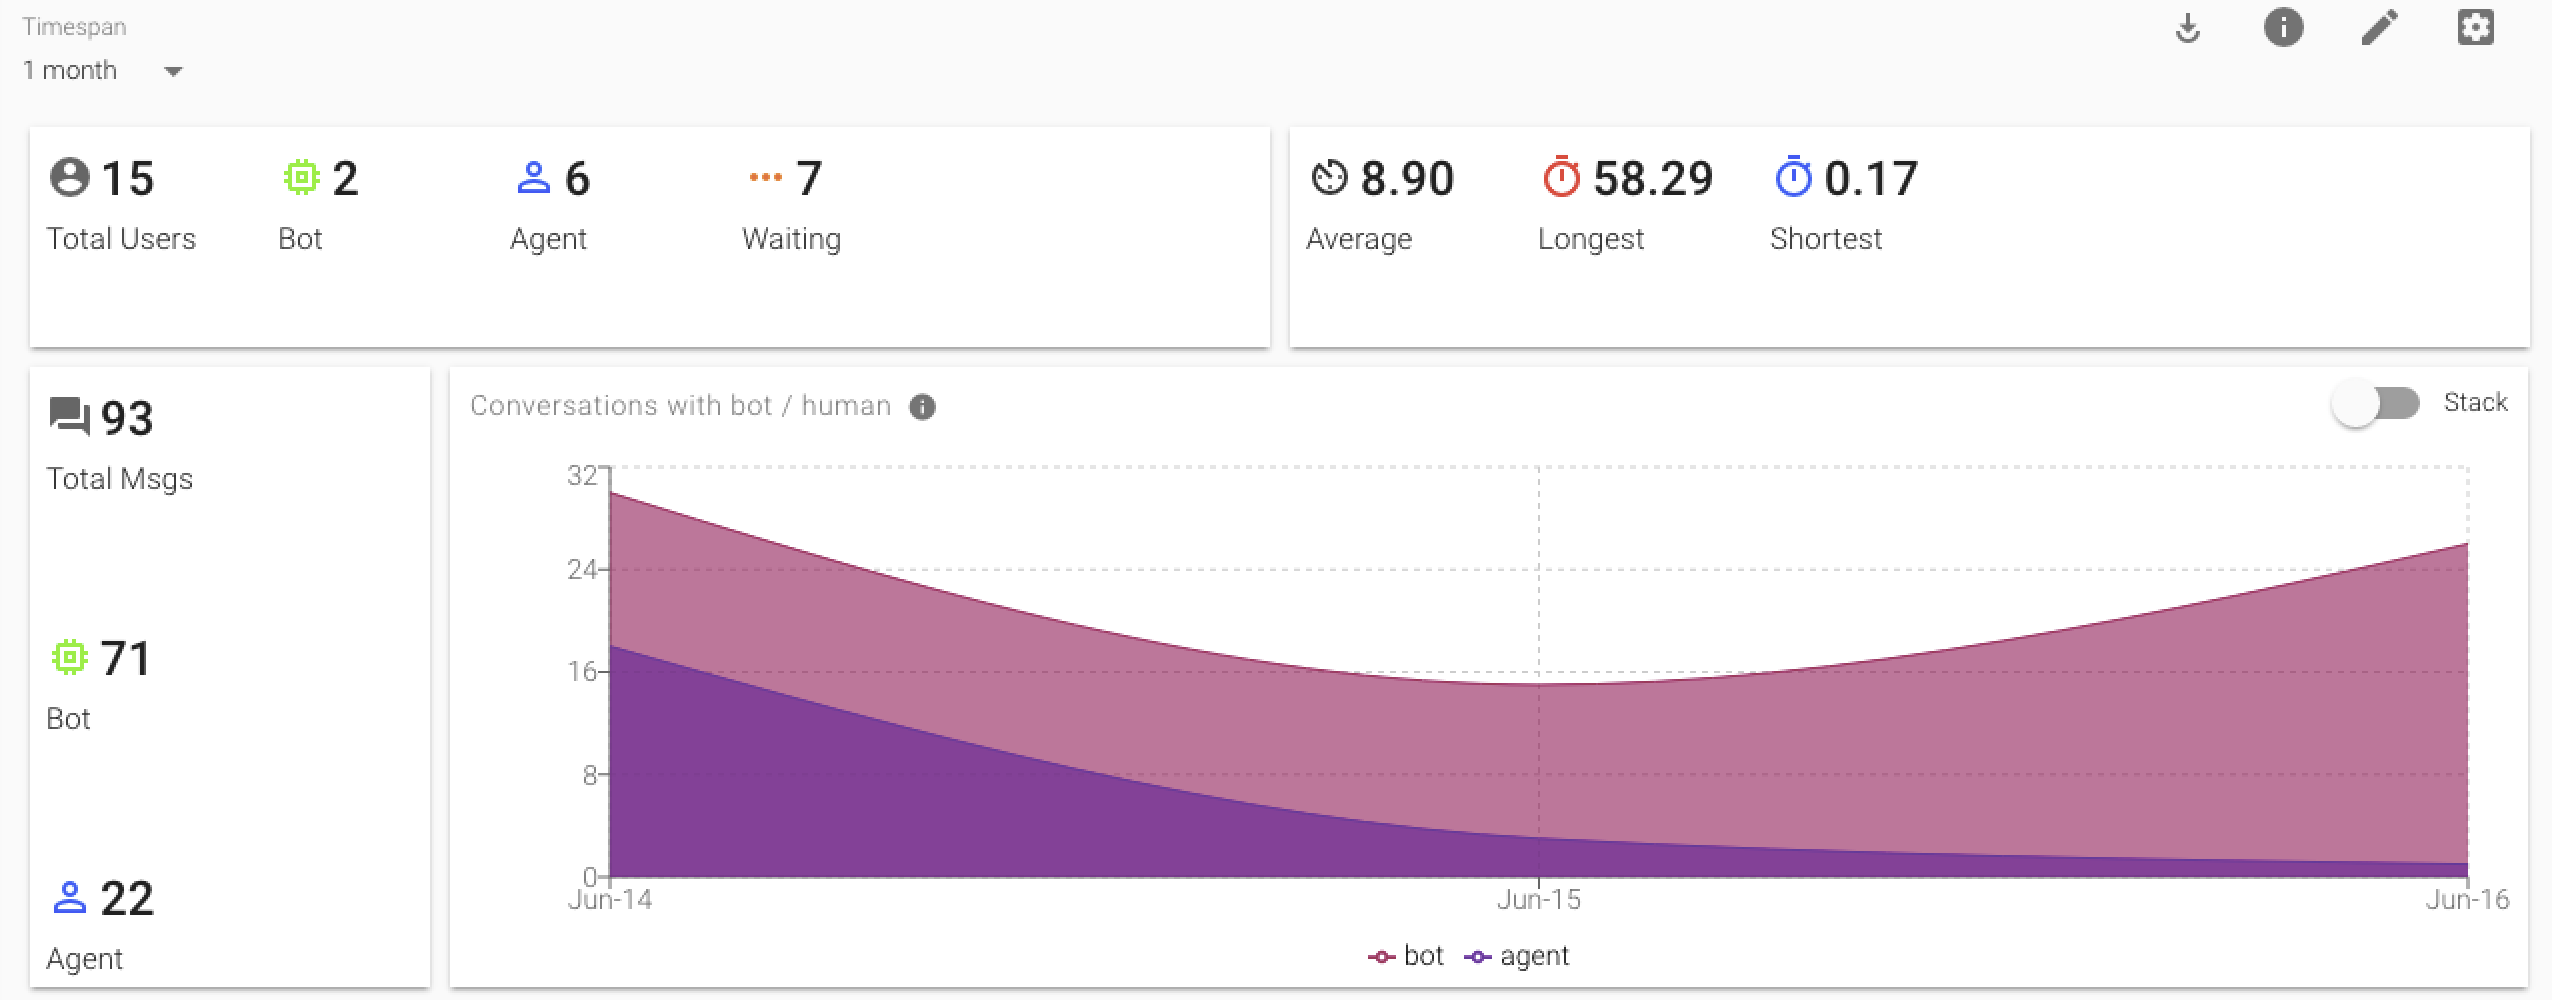
Total users currently speaking with bot or human or awaiting hand-off
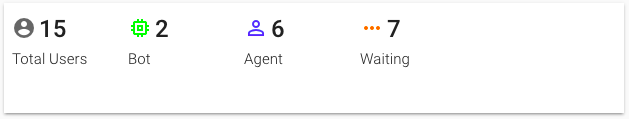
The following query displays a scorecard overview of total users and their hand-off state:
customEvents
| where timestamp > ago(90d)
| where name == 'Transcript'
| extend customerId=tostring(customDimensions.customerId)
| extend state=toint(customDimensions.state)
| extend timestamp=todatetime(customDimensions.timestamp)
| project customerId, timestamp, state
| order by timestamp desc
| summarize transcripts_count=count(customerId), timestamps=makelist(timestamp) by customerId, state
| project customerId, state, transcripts_count, timestamp=timestamps[0]
| summarize count(customerId), totals=makelist(transcripts_count), states=makelist(state), timestamps=makelist(timestamp) by customerId
| project customerId, state=toint(states[0]), transcripts_count=toint(totals[0]), timestamp=timestamps[0]Note that there multiple aggregations using the summarize statement.
The first summarize statement groups a user’s transcripts by state. The second summarize statement groups the results by user ID, so we can show how many users are talking to the bot, talking to a human agent, or waiting for a human agent to respond.
Time waiting for human hand-off
To find out the time waiting for human hand-off, we calculate the time difference between transcripts of a user when the state changes from waiting for a human agent to talking with a human agent. With botbuilder, the local timestamp fields are expressed as ISO string dates which can be parsed in Application Insights using the todatetime() function.
customEvents
| where timestamp > ago(90d)
| where name == 'Transcript'
| extend conversationId=tostring(customDimensions.userConversationId), customerId=tostring(customDimensions.customerId), state=toint(customDimensions.state)
| where state==1 or state==2
| order by timestamp asc
| summarize total=count(), times=makelist(timestamp) by conversationId, customerId, bin(state, 1)
| project conversationId, customerId, state, startTime=times[0]
| summarize result=count(state), startEndTimes=makelist(startTime) by conversationId, customerId
| where result == 2
| project conversationId, customerId, timeTaken=todatetime(startEndTimes[1])-todatetime(startEndTimes[0])The initial part of the query lists the customer id and state.
The first summarize statement reduces the list to show state change (of value of 1, where 0 is bot, 1 is waiting for an agent and 2 is agent) with total transcripts with the timestamp. The second summarize statement groups the state changes by user so that the difference in time can be calculated as time taken using the projection function.
There is an advantage of doing these aggregations using Log Analytics query language rather than coding this logic yourself in JavaScript. If you want to learn more, see the related developer blog post about the Ibex Dashboard.
From these results, we can work out the fastest, longest and average times waiting in the template calculated method.
calculated: (results) => {
  const times = results.reduce((acc, cur) => {
    // converts time hh:mm:ss format to value in seconds
    acc.push(cur.timeTaken.split(':').reverse().reduce((a, c, i) => a + c * Math.pow(60, i), 0));
    return acc;
  }, []);
  const avgTimeWaiting = times.reduce((a, c) => a + c, 0) / times.length;
  const maxTimeWaiting = Math.max(...times);
  const minTimeWaiting = Math.min(...times);
  return {
    'transcriptsTimeWaiting-avg': isFinite(avgTimeWaiting) ? avgTimeWaiting : '-',
    'transcriptsTimeWaiting-longest': isFinite(avgTimeWaiting) ? maxTimeWaiting : '-',
    'transcriptsTimeWaiting-shortest': isFinite(avgTimeWaiting) ? minTimeWaiting : '-',
  };
}
Scorecard and timeline of total conversations with bot/human
This query is used to display both a scorecard and timeline for total messages sent based on hand-off state. The timeline is one of the most telling visuals, as it shows how well the QnA knowledge performs over time. As the knowledge base improves, the requirement for human hand-off should diminish.
customEvents
| where timestamp > ago(90d)
| where name == 'Transcript'
| extend customerName=tostring(customDimensions.customerName), text=tostring(customDimensions.text), state=toint(customDimensions.state), agentName=tostring(customDimensions.agentName), from=tostring(customDimensions.from)
| extend timestamp=todatetime(customDimensions.timestamp)
| extend states=pack_array('bot','waiting','agent','watching')
| extend stateLabel=tostring(states[state])
| where state == 0 or state == 2
| project timestamp, from, text, customerName, agentName, state, stateLabel
| summarize transcripts_count=count() by bin(timestamp, 1d), state, stateLabel
| order by timestamp ascThis query returns list of users transcripts with state labels ordered by timestamp.
The summarize statement reduces the list to count the number of transcripts given a time interval. The time interval is used for charting the total transcripts with the bot vs. an agent on the timeline.
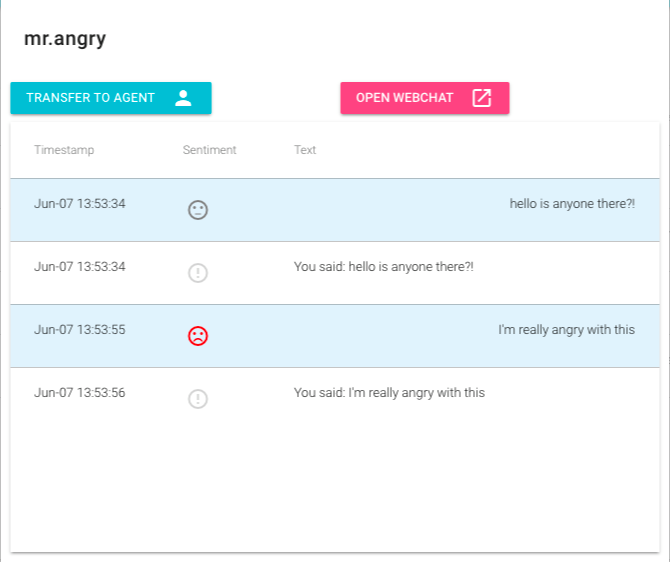
List recent conversations with sentiment
This query adds conversations and sentiment to the data table. Here the operator might wish to review recent conversations with negative sentiment and initiate a hand-off to human.
customEvents
| where timestamp > ago(90d)
| where name == 'Transcript'
| extend conversationId=tostring(customDimensions.userConversationId), customerName=tostring(customDimensions.customerName), timestamp=todatetime(customDimensions.timestamp)
| project conversationId, customerName, timestamp, customDimensions
| order by timestamp desc
| summarize transcripts_count=count(timestamp), transcripts=makelist(customDimensions) by customerName, conversationId
| project conversationId, customerName, transcripts_count, transcriptsThe initial part of the query lists the customer transcripts ordered by timestamp.
The summarize statement groups the transcripts by user so we can display the last message and sentiment as well as current status (such as whether they are currently talking to a bot or human agent).
Conclusion
The ability to analyze bot-to-human transitions and customer sentiment makes the Ibex Dashboard even more useful to engineers who want to continue to refine and improve their bots’ performance. The addition template we created for the Ibex Dashboard allows you to analyse the interactions your customers are having with your bot, as well as with agents. It can also help you to improve your bot by showing where your users are getting frustrated and where an agent has had to step in.
Through the reuse of the bot to human hand-off npm, we also developed a simple npm package to provide a notification feature for any bot developed with the Microsoft Bot Framework. This feature is useful when you want to be able to push new information to your customers.
Future Work and Reuse
The Ibex dashboard comes with a set of generic elements that can be adapted to many different scenarios. To take this project further, you could fork it and add your own generic elements and template queries to the Ibex dashboard. For more information on the dashboard and using generic components, please check the readme docs included in the repo.
You can find the project source code on GitHub; we welcome contributions!
 Light
Light Dark
Dark
0 comments