Visual Studio for Mac is retired
Visual Studio for Mac was retired on August 31, 2024 in accordance with Microsoft's Modern Lifecycle Policy. While you can continue to work with Visual Studio for Mac, there are several other options for developers on Mac such as the preview version of the new C# Dev Kit extension for VS Code.
We’re excited to start the new year off with great updates to the Visual Studio 2017 15.6 Preview for both Windows and Mac, and we hope that you will install and use it, and then tell us what you think. If you’re on a Windows machine, you can either install it from here or, if you already have it installed, click on the notification you’ll receive in the product informing you that the update is available. If you’re on a Mac, switch to the Visual Studio for Mac Beta updater channel to try out the new preview features.
This second preview builds upon the first preview of Visual Studio 2017 version 15.6 and contains new features, bug fixes, and other enhancements that address your feedback. We’re also releasing a new Visual Studio for Mac version 7.4 Preview, available in the Beta channel of the updater.
While this post shares the top highlights in this Preview, you can view the complete list of new features and details on how to enable them in the Visual Studio 2017 version 15.6 Preview release notes. For Mac users, the Visual Studio for Mac Preview release notes contain more details on what’s new for you. We appreciate your early adoption and feedback as it helps us ship the most high-quality tools to everyone in the Visual Studio community. Thank you for engaging in Visual Studio previews!
Performance
We continued our efforts to improve solution load performance, and in this Preview, we specifically focused on scenarios when the project has already been opened on the machine. We optimized our use of the design time build cache and parallelized the way project data is loaded, which enables Visual Studio to leverage disk and CPU more efficiently. Our lab measurements of this change show that large C# and Visual Basic solutions will “warm” load twice as fast as before. If you have a large solution project, we know you’ll appreciate this feature.
Productivity
When you’re in the flow of editing code, we know it’s the little details that often help make you more productive. One such detail: want to quickly duplicate a line of code without losing the contents of your paste buffer? Now you can, with duplicate line (Ctrl+E,V).
We’ve added the ability to navigate to decompiled sources. When enabled, invoking Go To Definition or Peek Definition on any referenced type or member will show its definition with reconstructed method bodies via ILSpy decompilation.
Diagnostics
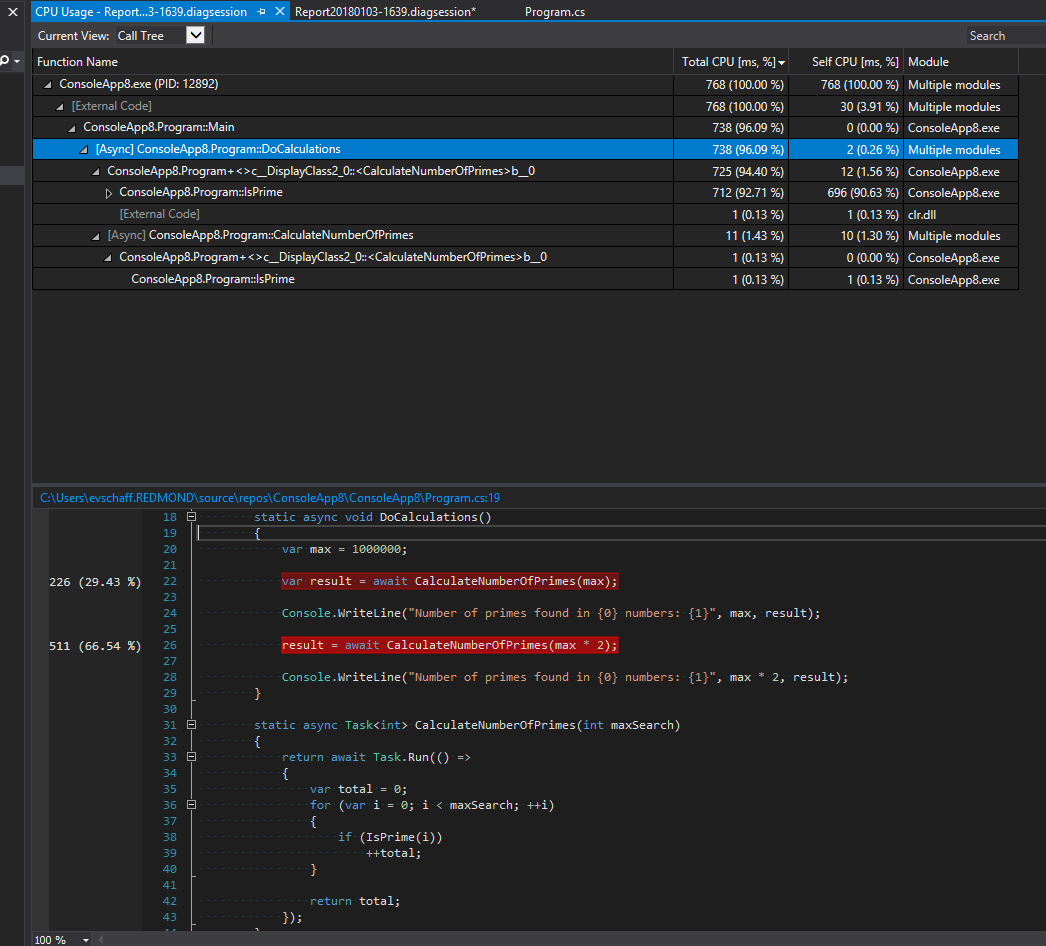
The CPU Usage Tool, when used during post-mortem profiling with the ALT-F2 Performance Profiler, now displays logical call stacks for asynchronous code (aka ‘Async Call Stack Stitching’). This means that asynchronous code running on behalf of a parent function or Task will appear as a child in the Call Tree and Caller/Callee views. This view makes it easier to navigate asynchronous code and understand its performance characteristics.
C++ Development
C++17 Standards Conformance: We’ve also made further progress toward implementing the C++17 Standard Library, including APIs such as stable_sort, partition, inline vector::emplace_back in parallel, and <memory_resource>.
Open Folder improvements: Missing include files are now automatically discovered for C++ Open Folder if they exist under the workspace root, even if they are not explicitly added to the include path. Debug options are now available for Embedded ARM GCC support – right click your binary, choose Debug and Launch Settings, and then select C/C++ Debug microcontroller.
C++ IntelliSense in Open Folder & CMake: IntelliSense errors for inactive configurations will now be shown as purple squiggles in the editor (the number of configurations to process is configurable in Tools > Options):
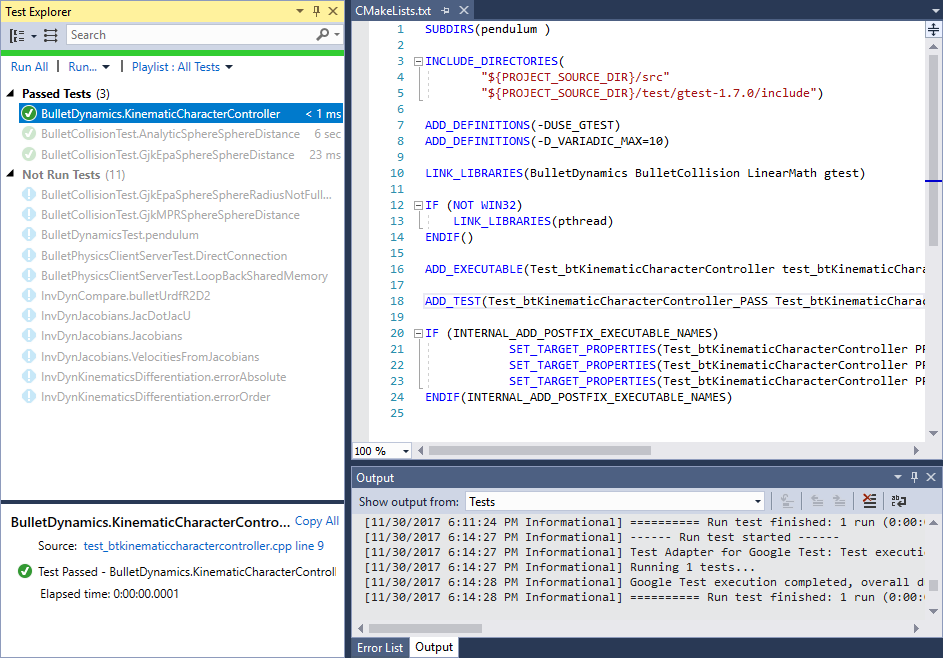
CMake improvements: CTest, Google Test, and Boost.Test tests in CMake projects are automatically discovered and listed in the Test Explorer. If you have the Google Test adapter or the Boost.Test adapter, after you build, you will have an even more granular view of your tests:
Templates: We’ve included Boost.Test item templates and support for the Boost dynamic library.
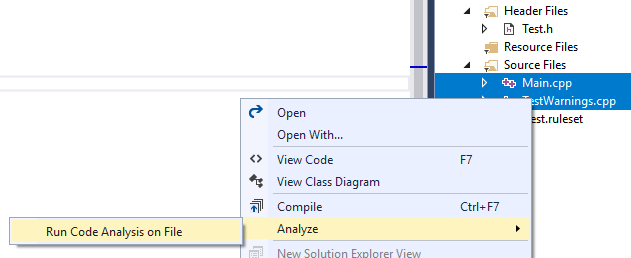
C++ Code Analysis enhancements: We’ve added 5 new checks enforcing rules around integer overflow and additional rules from the C++ Core Guidelines, along with a C++ Core Checker extension to detect use of indirections with a lifetime that is out of scope. Additionally, the “Run Code Analysis” command no longer runs code generation, which speeds up analysis runs. We’ve also added support for running single file Code Analysis (or on your selection of files from the Solution Explorer) and have cleaned up the Build and Analyze menus.
Azure Development
With this Preview, Visual Studio now supports configuring continuous delivery for solutions with ASP.NET Core projects and Docker support targeting Azure Web App for Containers. We also added support for new source control providers. You can now configure Continuous Delivery for your solution if it is under TFVC source control on VSTS or used SSH authentication for Git repositories on GitHub or VSTS. Read more about these features on this post about Continuous Delivery Tools for Visual Studio.
Test Explorer
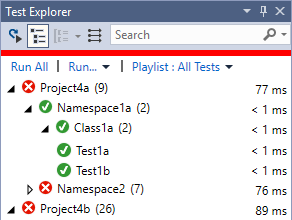
Hierarchy View: The Test Explorer in Visual Studio now has a hierarchy view that organizes your tests by Project, Namespace, and then Class. This feature not only makes navigating through your tests much easier, but also gives better feedback on tests at a glance. Refer to the release notes for details on how to enable this view and what type of test information you’ll now be able to see. Adding a hierarchy view to the Test Explorer has been at the top of many wish lists and we are excited to hear feedback on the design and how it affects your workflow.
Real time test discovery is a new Visual Studio feature that uses a Roslyn analyzer to discover tests and populate the test explorer in real time without requiring you to build your managed project. This feature was introduced in Visual Studio 2017 15.5 behind a feature flag, and in this Preview is now on by default. This feature not only makes test discovery significantly faster, but it also keeps the test explorer in sync with code changes such as adding or removing tests. Note that unlike Hierarchy View feature described above which is available for all types of projects, the automatic test discovery feature is only available for C# and Visual Basic projects.
Xamarin
Xamarin.Android: Android 8.1 Oreo is the latest version of Android available from Google. Android 8.1 Oreo offers many new features of interest to Xamarin.Android developers. These features include Android Go, Neural Networks API, Autofill Framework updates, SharedMemory API, and many more. These APIs are available to Xamarin.Android apps when you use Xamarin.Android 8.2 and later.
Visual Studio Tools for Xamarin:
Building iOS apps with Visual Studio on Windows just got even easier. This release adds a brand-new feature called macOS environment provisioning. Rather than installing and updating a Mac build machine manually, just connect to the Mac and we will handle the heavy lifting of setup, all from Windows.
You can also now deploy your iOS apps over the network with Wi-Fi debugging – no cables required, on both Windows and Mac. Just make sure you pair a wireless device with Xcode first.
The Xamarin Live Player enables developers to continuously deploy, test, and debug their apps using just Visual Studio and an iOS or Android device. Visual Studio 2017 version 15.5 added support to enable developers to preview real-time XAML changes directly in the Android emulator without requiring a recompile or redeploy. This release brings this functionality to the Remoted iOS Simulator for Windows.
Try it out today!
If you’re not familiar with Visual Studio Previews, take a moment to read the Visual Studio 2017 Release Rhythm. Remember that Visual Studio 2017 Previews can be installed side-by-side with other versions of Visual Studio and other installs of Visual Studio 2017 without adversely affecting either your machine or your productivity. Previews provide an opportunity for you to receive fixes faster and try out upcoming functionality before it becomes mainstream. Similarly, the Previews enable the Visual Studio Engineering team to validate usage, incorporate suggestions, and detect flaws earlier in the development process. We are highly responsive to feedback coming in through the Previews and look forward to hearing from you.
Please install the Visual Studio Preview today, exercise your favorite workloads, and tell us what you think. If you’re on a Mac, switch to the Visual Studio for Mac Beta updater channel to try out the new preview features. You can report issues to us via the Report a Problem tool in Visual Studio or you can share a suggestion on UserVoice. You’ll be able to track your issues in the Visual Studio Developer Community where you can ask questions and find answers. You can also engage with us and other Visual Studio developers through our Visual Studio conversation in the Gitter community (requires GitHub account).


0 comments