

Introduction
For our recent engagement, we needed to execute a series of performance tests with a varied set of queries against Azure Data Manager for Energy (ADME). ADME is a managed OSDU™ Data Platform and it exposes HTTP REST endpoints which clients can make calls into. We have crafted specific schemas and related queries that would satisfy our customer’s use-cases. The performance tests would help us determine if our approach is viable for the use-cases under load. Given that the performance tests were HTTP based, it means we would look at the related latency and throughput metrics for validation of our approach.
For capturing performance metrics, we instrumented the golang performance tool with Application insights SDK which will push performance metrics to Application Insights. The reason we chose Application insights was because it provides powerful analytics and querying tools and customizable dashboards out-of-the-box. The Application Insights performance panel is where we would go for reviewing performance. We can make use of the built-in time-filter dropdown to review performance in the last 30 minutes, last hour or customize the timeframe with a start and end date-times. We can add additional custom filter options such as specific queries we are interested to zoom in on. For example, we have a custom Request that tracks how long a series of HTTP requests are executed in batches (parallel) and some in sequence. In the custom Request, we provide a name and we are able to use a custom filter to filter out HTTP requests to just that name. Once this is done, we have a dashboard that shows the latency numbers such as the Average, 50th percentile, 95th percentile and 99th percentile in seconds. It also shows the count of Requests made which represents the throughput for that period of time.
We have a series of scenarios we need to run with. We have different replica counts to test for concurrent requests against a single tenant as well multi-tenancy, from different Azure zones and with varying data loads in the system. We were able to write a script that can automate the execution of the performance tests over a period of time against the series of scenarios but we also needed a way to collect the latency numbers which includes a 90th percentile that is missing from the default performance panel dashboard, the throughput and the error counts. The error count is available in the Failures panel. We have the option of performing the steps to go to both panels and filter each time a performance test is completed manually, or a better way is to automate the process and collect the metrics automatically. We can then determine the output such such a CSV file. Fortunately, this is a relatively straight forward process which we can make use of both Application Insights and Azure CLI commands to do this. We will cover the steps you can take to automate the capturing of your own performance tests.
Step 1: Creating a KQL file
First, we should note that the raw test metrics are stored in Log Analytics workspace and are surfaced via Application Insights. As such, most panels would contain a View in Logs option that is linked with Log Analytics.
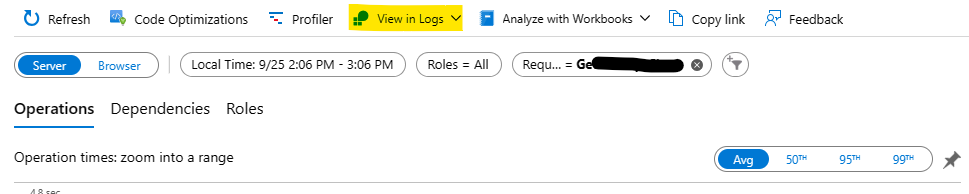
Once you have configured the right filters, you can then click on this option, select Request, and be brought to Log Analytics with a query that represents what you have filtered on. This query is written in Kusto Query Language or KQL.
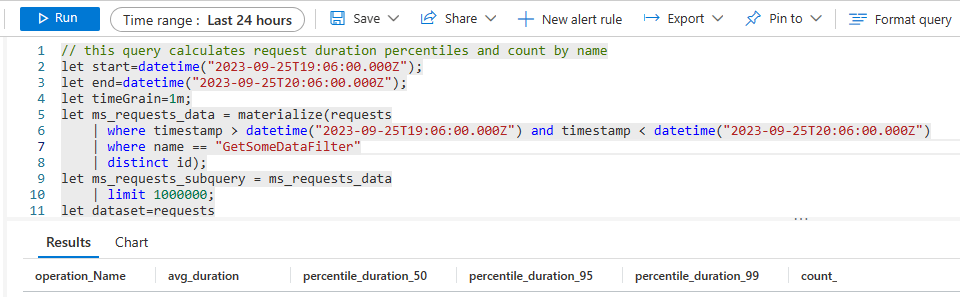
We can then parameterize this query as needed and, in our case, the only thing we needed to parameterize was the start and end times which are conveniently located at the start of the script as variables. It can be as simple as just replacing the hardcoded datetime values with a value that can be string replaced later. See the example below:
let start=datetime("2023-09-25T19:06:00.000Z");
let end=datetime("2023-09-26T20:06:00.000Z");
...
let start=datetime("%START%");
let end=datetime("%END%");
...There are also likely other locations within the script which do not make use of the start and end variables that need to be refactored.
As noted previously, we also have a requirement to capture the 90th percentile. Looking at the query, we just needed to add 90 in the percentiles function as well as other related header locations.
...
    percentiles(duration, 50, 90, 95, 99),
...
Once this is done, we should have a KQL script we can save as a file that we can execute against later.
Step 2: Creating the Automation Script
The second step is to write the automation script that can read a CSV file for the time periods that the performance tests are executed and then read them line-by-line as inputs to the parametrized KQL query. We will need 2 values, one is the start date-time and the other is the duration in minutes. Here, we can give an example of what the CSV file can look at.
2023-09-22 10:38:00,60
2023-09-22 12:39:00,60
...
Our script can read the CSV file and loop through each line and run it with the KQL query against Log Analytics workspace. Here is a PowerShell code snippet of what it can look like.
# Add extension if it is missing
az extension add --name application-insights -y
...
# Reading the KQL file.
$query = ""
foreach ($line in [System.IO.File]::ReadLines("query.kql")) {
    # Remove extra spaces
    $line = $line.Trim()

    # Build up the query in a single line which will be needed when we run it as a command.
    $query += $line + " "
}

# Updating all double quotes in KQL query to use single quote.
$query = $query.Replace('"', "'")
...
foreach ($line in [System.IO.File]::ReadLines($InputFile)) {

    $start = $line.Split(",")[0]
    $mins = $line.Split(",")[1]

    $end = ([DateTime]$start).AddMinutes($mins).ToUniversalTime().ToString("yyyy-MM-ddTHH:mm:ss.fffZ")
    $start = ([DateTime]$start).ToUniversalTime().ToString("yyyy-MM-ddTHH:mm:ss.fffZ")

    # Replace the parameters with the actual start and end times in UTC.
    $query2 = $query.Replace("%START%", $start).Replace("%END%", $end)
    $tables = (az monitor app-insights query --apps $appId -g $groupName --offset "P30D" --analytics-query $query2 | ConvertFrom-Json).tables
We should note the following in the script:
- The datetime we provide can be in local time and we can use the ToUniversalTime function in PowerShell to convert them to utc time and format out a UTC timestamp.
- The
az monitor app-insightsrequires the use of the application insights extension which is installed if missing using theaz extension addcommand. The-yflag means the script requires no human intervention to say yes to installing the extension if it is not yet installed. - There is an offset that is used in the
az monitor app-insightscommand. This is the look-back period for the command. We should note that the Log Analytics workspace has a default retention period of 30 days which means this is the maximum window we can set. If this is higher, we can increase this value. - The query is converted to strip out double quotes and push everything into a single line and pass into the
analytics-queryparameter.
Depending on the query, we may get one or more sets of result in the form of “tables” which we can cycle through and loop through each row to find corresponding values. The following is an KQL code snippet of what fields will be in the output of each row. We had added a 90th percentile and hence we have added it as an additional output field here.
project
    operation_Name="Overall",
    avg_duration,
    percentile_duration_50,
    percentile_duration_90,
    percentile_duration_95,
    percentile_duration_99,
    count_
As we are navigating each colum of the row, we should note some of the row-column value may be not-a-number or NaN. We should assert for this.
Although we are using PowerShell, the same can be accomplished with any scripting language including bash or Python.
Conclusion
The result would be a script that we can reuse for the performance tests and the only file we need to manage is the CSV file that contains the start date-time and the duration which we already know from running our performance tests. This also means we minimize the chances of mistakes (no manual filtering each time in Application Insights for each panel for each test) and produce a result which we can output to any format or destination we like as we control the script.