
Streamlining Azure DevOps extension development
Azure DevOps has an incredibly deep set of functionality to allow you to build extensions for your team. You can add and modify elements in the UI as well as build back-end tasks. While the majority of features your team needs on a day-to-day basis are built in, extensions allow you to modify Azure DevOps to meet your needs. In this blog post, we’re going to highlight some tips and tricks to accelerate development of your own extension.
What’s the problem we’re trying to solve?
Most modern IDEs have built-in debugging tools that you can use to inspect code, insert breakpoints, manipulate values, etc. The problem is that when you’re writing extensions to Azure DevOps, they need to run in the context of Azure DevOps. The official Azure DevOps extension documentation includes a guide on how to debug, but the approach it describes is to redeploy the extension to the marketplace each time you make a change and then use the browser’s built-in debugging tools. That process requires you to switch context to the browser’s dev tools every time you need to debug. Ideally, you would want to work directly inside your IDE or editor and debug immediately without having to publish to the marketplace.
The following steps describe how to convert an existing extension to use an alternate approach to development that loads the code directly from your dev machine rather than from a deployed bundle from the marketplace. This takes advantage of the capability in Azure DevOps to load content from localhost, which will enable us to hot reload and debug in Visual Studio Code.
Step 1: Reconfigure your vss-extension.json
- Create a new configs folder, and place the following files in there, replacing [extension-id] with your extension’s ID: configs/dev.json
{
    "id": "[extension-id]-dev",
    "public": false,
    "baseUri": "https://localhost:3000"
}
configs/release.json
{
    "id": "[extension-id]",
    "public": true
}
Step 2: Update your webpack.config.json
-
Enable source map and point your dev server to https://localhost:3000.
module.exports = { devtool: "inline-source-map", devServer: { https: true, port: 3000 } // ... }; -
Configure the dev server to serve files from the correct path.
module.exports = {
    output: {
    publicPath: "/dist/"
        // ...
    }
    // ...
};
Step 3: Enable Firefox debugging in your Visual Studio Code launch.json file
- Install Firefox.
We use Firefox because the Visual Studio Code – Debugger for Chrome extension doesn’t yet support iframes. If you would prefer to debug your extension in Chrome, please add your support to this feature request.
- Install the Debugger for Firefox extension for Visual Studio Code.
- Add the following configuration to your launch.json file:
{
    "version": "0.2.0",
    "configurations": [
        {
            "name": "Launch Firefox",
            "type": "firefox",
            "request": "launch",
            "url": "https://localhost:3000/",
            "reAttach": true,
            "pathMappings": [
                {
                    "url": "webpack:///",
                    "path": "${workspaceFolder}/"
                }
            ]
        }
    ]
}
Step 4: Configure and run your debug server
- Install the webpack-dev-server package in your app.
npm install --global webpack-dev-server- Launch your dev server.
webpack-dev-server --mode developmentStep 5: Deploy your debug extension
- If you haven’t already installed it, you’ll need to install the tfx-cli in order to publish your extension.
npm install --global tfx-cli- Run the following command to deploy a dev version of your extension.
tfx extension publish --manifest-globs vss-extension.json --overrides-file configs/dev.json --token [token]This will have a different ID from your release version (see the dev.json above), so you will need to install this new extension in your respective Azure DevOps project to see it running.
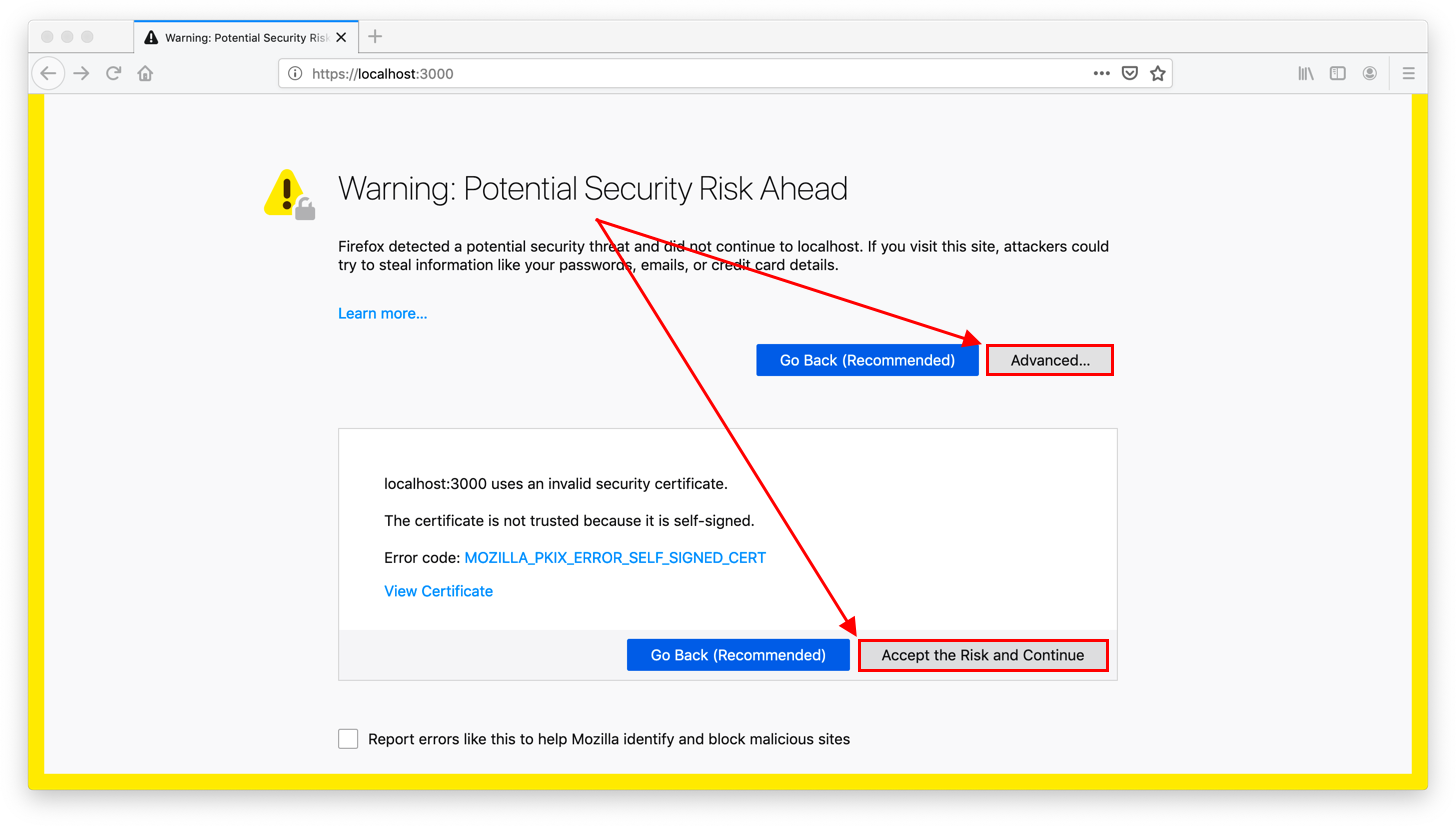
Step 6: Launch Firefox and debug
- Accept the HTTPS certificate warning.

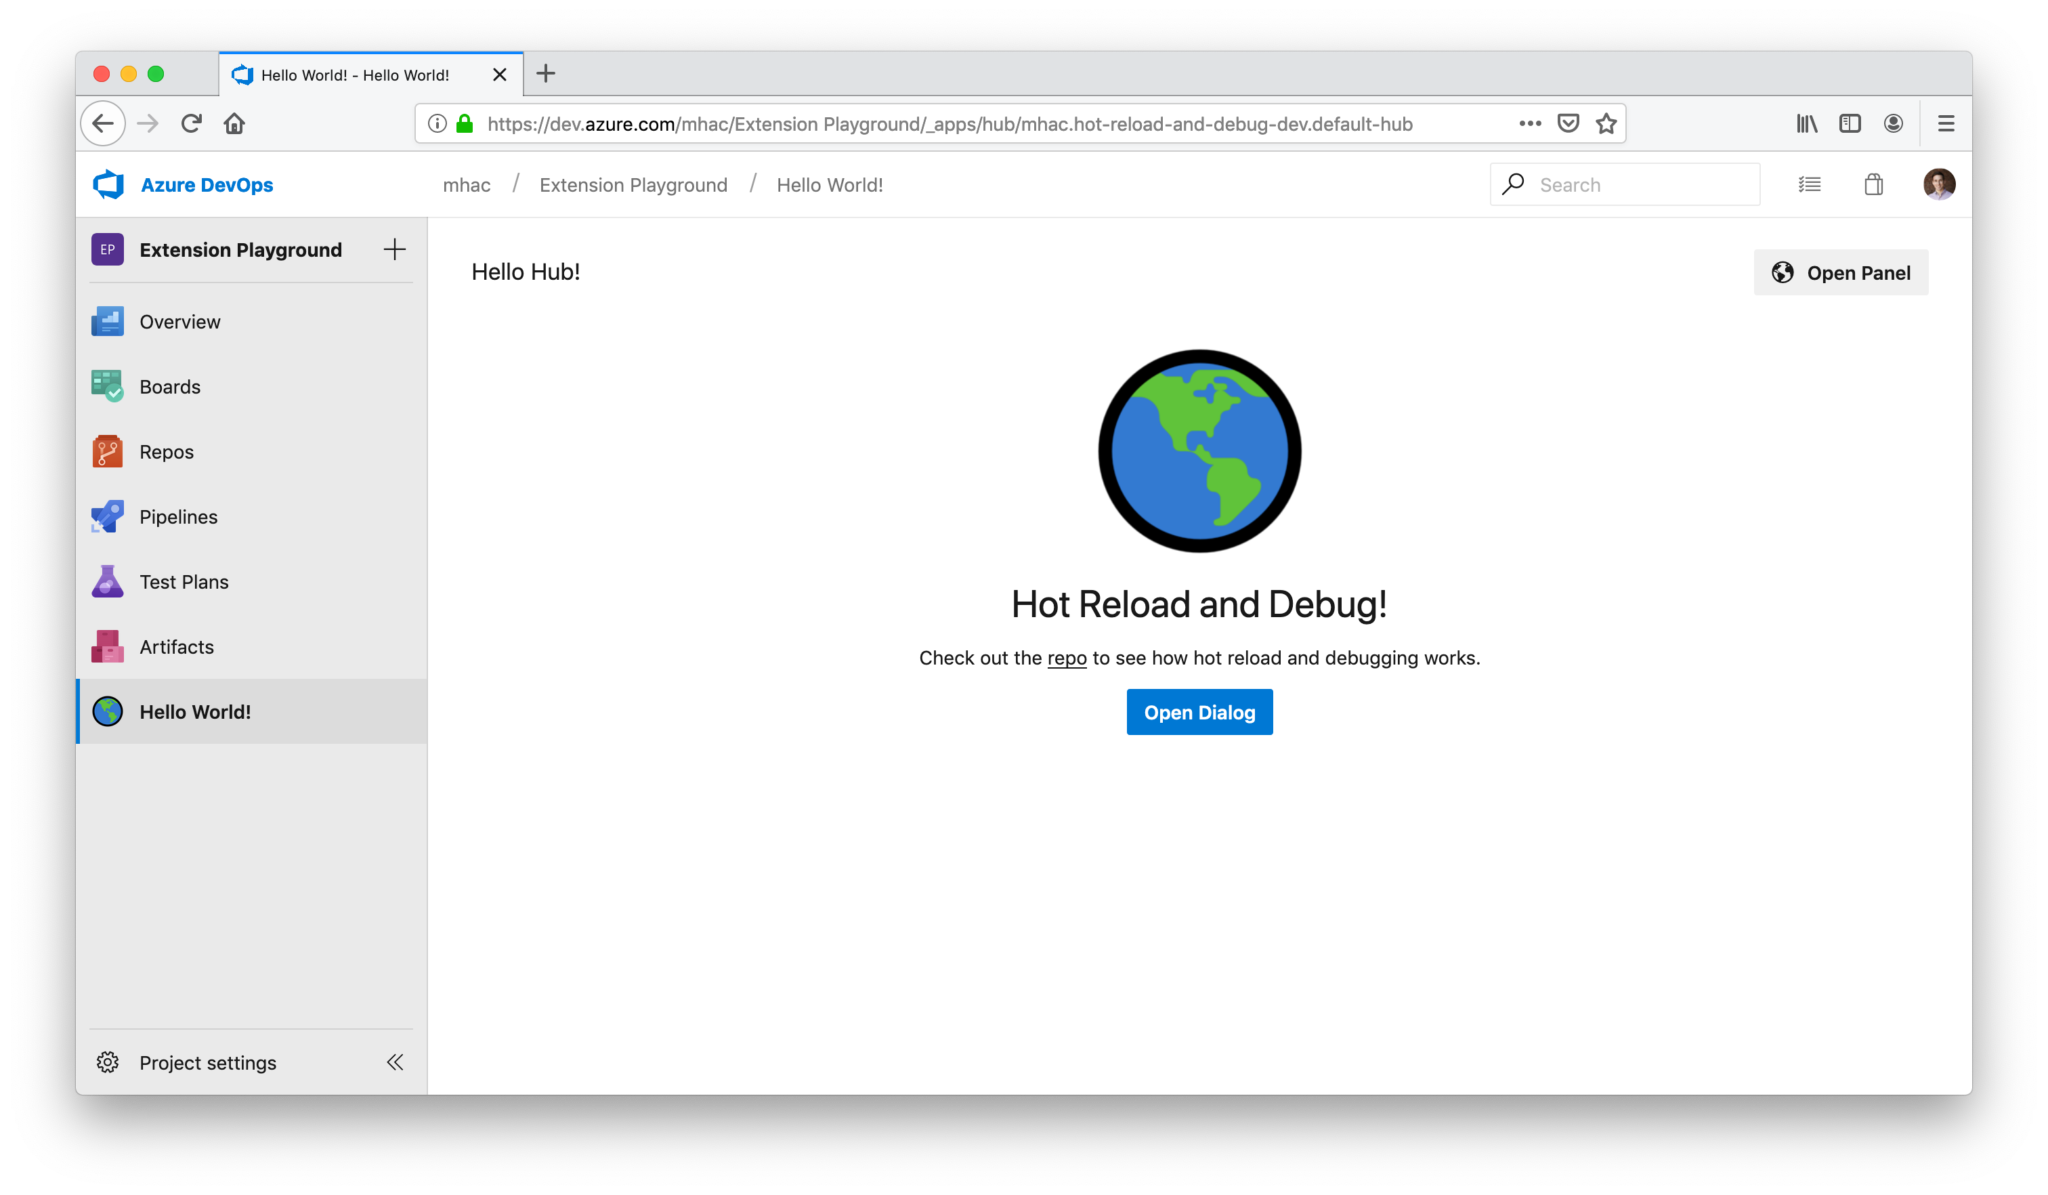
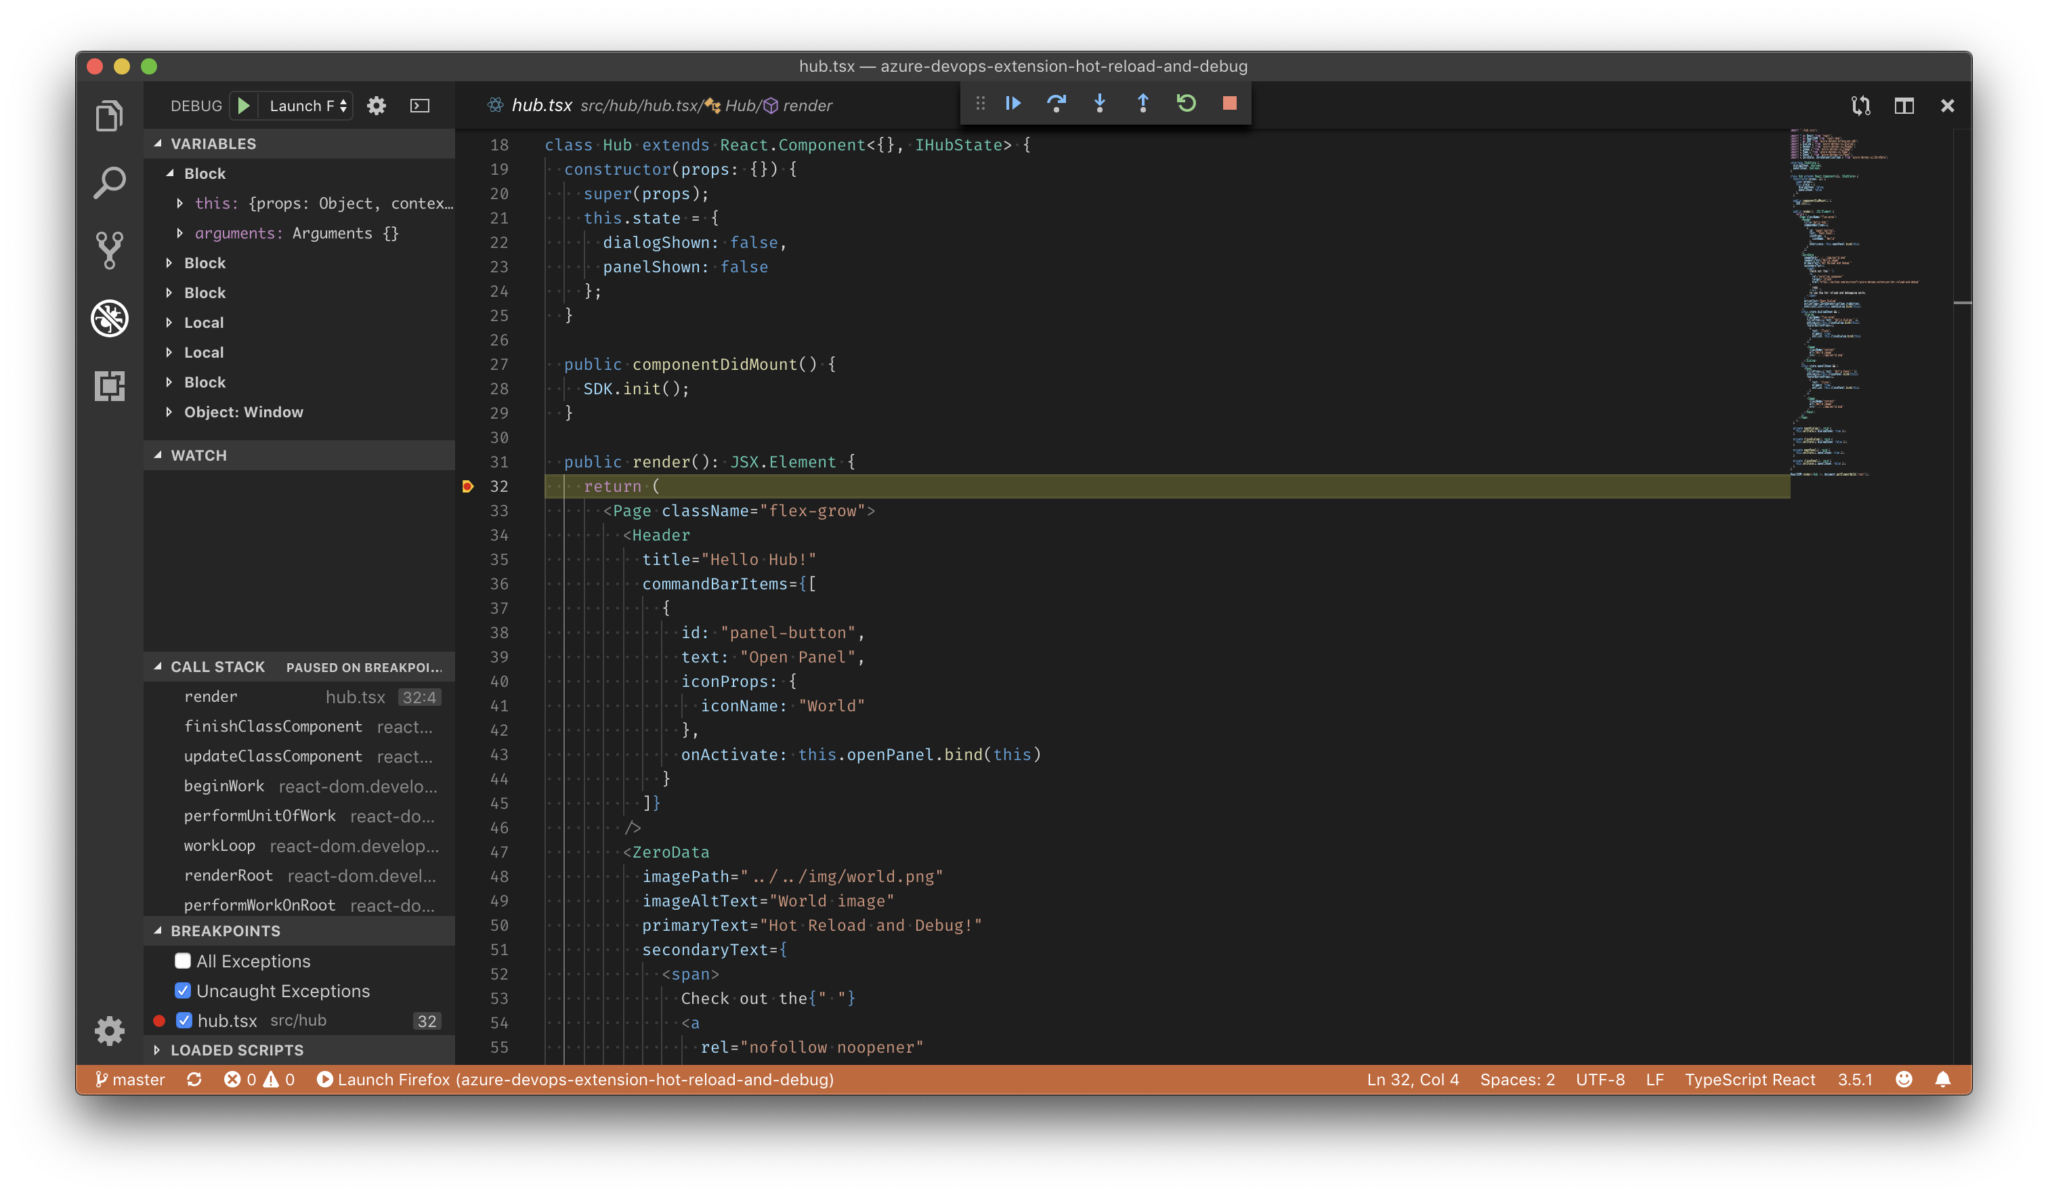
- Put a breakpoint in Visual Studio Code and then browse to your extension.

- You should see your breakpoint hit in Visual Studio Code.
Conclusion
For more detailed, step-by-step instructions, see this repo and if you want to start a new extension project, check out the Yeoman generator our team built to get everything set up faster.
 Light
Light Dark
Dark
4 comments
So cool! thanks!
The issue you adressed here was a major problem which im sure a lot of other people faced as well, it did turn out be to be very time consuming and required unnecessary effort. This was really helpful !
Very cool featue. Also the new SDK with the re-usable UI components is what I always wanted. But please extend that extension development model to dashboard widgets. I assume it is not there, yet, since the azure-devops-extension-sample repo does not contain samples dealing with widgets.
I want to modernize my widgets to have the same look and feel like the built-in ones. When can we expect to create widgets with the new modern API?
Can you tell me why I don’t get any picture on the link in the right site and when I press on the Hello World i get an 404 page?