A few weeks ago, we announced the SonarQube scanner for MSBuild 2.0 supports 3rd party Roslyn analyzers. This has been working for the continuous integration build. In this blog post we are announcing that we have extended this experience to the IDE. You can now bind a Visual Studio solution to a SonarQube project and see Roslyn analyzers automatically provisioned as NuGet packages, and rulesets configured, using the SonarQube Quality Profile for the project.
Let’s see what problem we are solving here, and how to use this new feature.
Analysis issues reported by build can be different from the ones in Visual Studio
Non-Dev build results can be different from warnings in the IDE
In previous posts we have explained how you could setup a SonarQube analysis part of the non-dev builds (i.e. Continuous Integration builds or automated builds). We got the feedback that this is great, because you can measure your technical debt and its evolution. But we also heard that this can be very frustrating for developers, as sometimes, they get notified during the build that they introduced new issues, whereas they would really like to be notified right when they develop in the IDE (in Visual Studio). This situation happens because the definition of the quality in SonarQube is different from the configuration of the static analysis rules which run when building or editing in Visual Studio. Let’s understand this better.
This is frustrating!
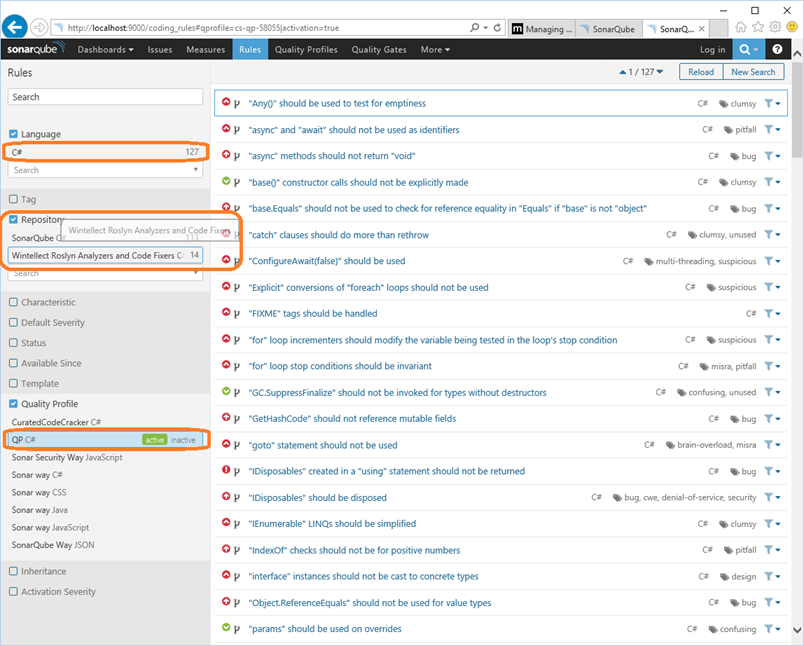
Let’s imagine that I’m a developer in a team who has enabled the SonarQube analysis build in the continuous integration. In SonarQube, we have installed the C# plug-in (version 5.0 or more recent). We have used the SonarQube Roslyn SDK to build a SonarQube plugin that wraps the Wintellect Roslyn Analyzers. Then we have set a Quality profile which enables rules from the C# plug-in (really “Sonar Analyzers for C# and VB”) and from the Wintellect Roslyn Analyzers. The picture below shows these rules and the two “Rule repositories”.
I work on a project, and commit my changes. There is only one warning in Visual Studio. I believe that I’m good to go.
When the continuous integration build has completed and the SonarQube analysis is done, I click on the “analysis results” link in the build summary to navigate to the SonarQube project dashboard where I get a sense of the quality of my project. I decide to dig into the issues and I notice that there are many errors, and in particular severe errors (15 critical, in C#). I dig into these errors, to understand more about them, and in particular who introduced them, and … I discover that it was me.
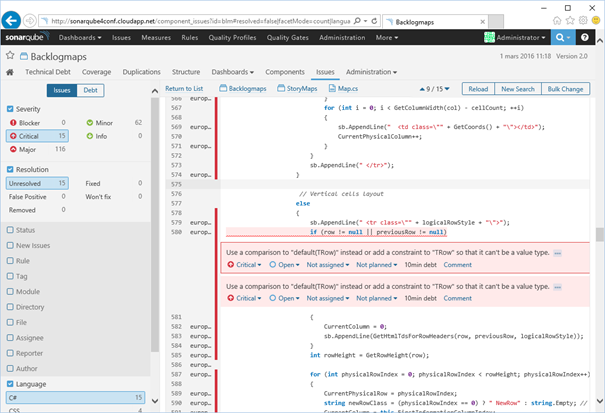
That’s annoying! I really don’t want to have my name here, in particular because the whole team is watching the dashboard. Now you can imagine my frustration since in Visual Studio, I could only see one warning. I know that this is possible in VS 2015 to be notified of issues as I type them, as there is just-in-time static analysis provided by Roslyn analyzers. That’s what I want: be notified of the issues that matter for my team or organization, as I introduce them, in the IDE
Why do we get different results?
There are two causes to these differences between the issues reported in the build and in the IDE.
-
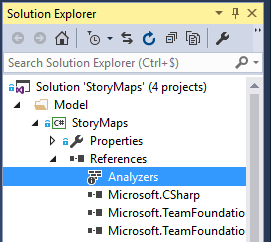
the Roslyn analyzers which are ran are not the same: if I look under the References | Analyzers node of each project in the Visual Studio solution, I see that they are empty.

Whereas in SonarQube, we have seen that our team had installed several plug-ins for Roslyn analyzers and we have activated rules in the quality profile.
Note that most analyzers also come as a VSIX, but to get consistent results every team member must install the right versions of the right VSIXes on their machine.
- Even if the right analyzers or the right VSIXes had been added, that would not solve the consistency problem. Indeed, the rulesets would need to be configured to match the rules that are activated in the SonarQube quality profile.

The solution would be for my team to add the right Roslyn analyzers to every project in the solution, and configure the rulesets for these so that they match the Quality profile. But this is tedious, error prone, and needs to be done on each project. Also when the quality profile changes in SonarQube, we would need to update each project of each solution that should match this quality profile.
We really need some automation here!
The “SonarQube connected mode”
Released part of SonarLint for Visual Studio 2.0 and above
Fortunately, we added a new “Visual Studio connected mode for SonarQube” part of SonarLint for Visual Studio 2.0.
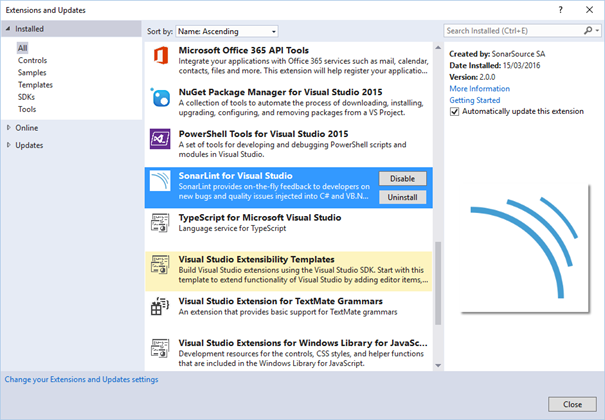
SonarLint for Visual Studio has been releasing regularly both as a VSIX, and a NuGet package. So far it only contained SonarSource’s analyzers, which were recently renamed “Sonar Analyzers for C# and VB”. From SonarLint for Visual Studio 2.0, the Visual Studio extension (VSIX) now also offers an experience in Visual Studio which reconciles the developer live experience with the SonarQube quality profile. The NuGet package still only contains the analyzer.
How to bind your Visual Studio solution to a SonarQube project?
This connected mode brings two new commands, and a new Tab in Team Explorer.
To bind your Visual Studio solution to a SonarQube go to the Solution context menu, and in the Analysis sub menu, use the new command “Manage SonarQube Connections”. The same command is also available from the Analyze top-level menu.
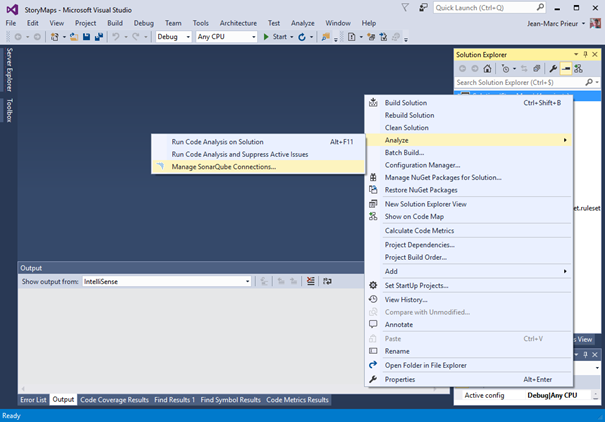
Clicking on one or the other of these commands, opens the “SonarQube” tab in the Team explorer
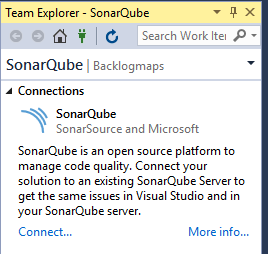
By clicking on the Connect … link, you get a dialog where you can enter the URL for your SonarQube server. Then you enter the credentials to do an analysis. On the picture below, my SonarQube server is a SonarQube 5.4, so I created an analysis token, which I’m using as my login, leaving the password empty (This is the recommended way as this avoids password to be sent through the network, also these tokens are revocable). I could also have used a login/password.
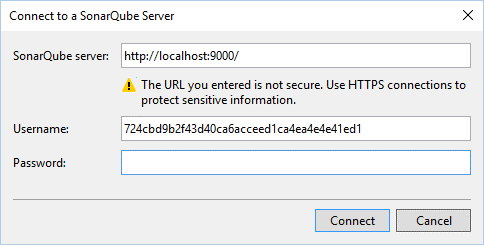
As you press Ok, Visual Studio connects to the SonarQube server with the provided credentials, and it retrieves the list of SonarQube projects on this server. You can then double-click on one of these projects, or Right click and use the “bind” button, to bind your Visual Studio solution to this SonarQube project
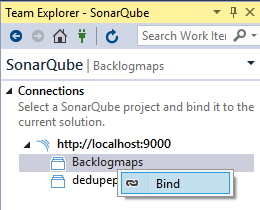
If there are outstanding changes in your solution you will be prompted to save them first. You might want to check that there are no local changes that haven’t been committed to source control before binding, as this will make it easier to see the changes that are made by the binding process
As you’ve done that and observe the progress bar you will notice that 2 things happen:
- NuGet packages are installed on each project. These are the Roslyn analyzers which have active rules in the quality profile of the bound SonarQube project.
- Rulesets are synthetized from this quality profile and applied to each project
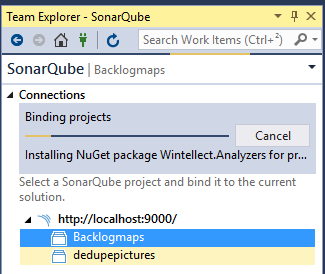
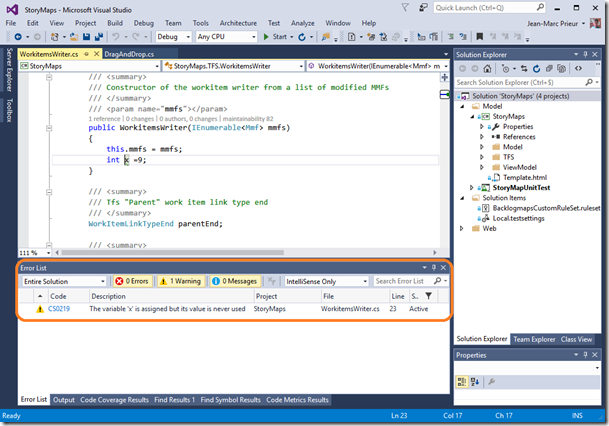
Immediately you start seeing new warnings appearing in the Error List. You now have, in the Visual Studio solution, the same issues as the ones which are reported in SonarQube. At least for C#.

How is your solution affected?
You notice that some things have changed in your Visual Studio solution:
- A common ruleset was created and added a solution item. It’s named from the identifier of the SonarQube project and the language (blmCSharp.ruleset in that case). It contains the same issues as the quality profile.
- An empty ruleset was generated for each project that references the common ruleset. If your project already specifies a ruleset then the existing ruleset will be updated to include the common ruleset (that’s my case here)
We have made the choice of not having the project directly reference the common ruleset, so that you are able to edit the project’s ruleset in the case you want to strengthen it. This won’t change the common generated ruleset, but will add entries in the project’s ruleset to override it.

The required Roslyn analyzers were also provisioned on each project.
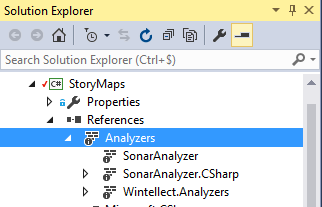
If you close Visual Studio, and then reopen the solution, the binding will still be here (going to the “SonarQube” tab in the Team Explorer will show you the same thing).
You can now commit the changes, and all the members of you team will now benefit from the exact experience, without having to install any VSIX. Everybody will share the same definition of the quality, and that’s the same as what is defined in SonarQube.
What if the SonarQube quality profile changes later?
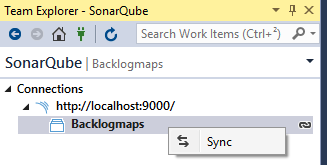
If someone in the organization changes the quality profile in SonarQube, you can go to the Team Explorer and use the contextual command on the SonarQube project to re-sync the definition of the quality. Roslyn analyzers will be provisioned as needed, and rulesets updated. That’s still a manual process for the moment, but we’ll improve this (see “Current limitations” below)
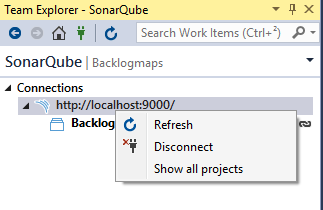
If you wish, you can also right click on the SonarQube server in the Team explorer to remove the binding (disconnect), and possibly to bind the solution to a different SonarQube project.
Current limitations
The connected mode in SonarLint for Visual Studio 2.0 is a first iteration, and there are still a few rough edges. In future versions of SonarLint for Visual Studio, we will solve the following:
- The Roslyn analyzers NuGet packages are currently applied on every project, including those which were excluded from the SonarQube analysis, and the test projects.
-
If you are using TfVC and are working with a server workspace, the experience will fail. To work around this, you will need to:
- Check out the files in your solution
- Bind your solution to a SonarQube project as explained
- Add the extra files which were added.
- You are free to change the rulesets for each project manually, and we don’t warn you yet if you loosen the quality by removing rules. In a future release, we’ll warn you if that’s the case
- It’s up to you to re-sync the SonarQube project. In a future release, we’ll warn you if the solution is no longer in sync with the SonarQube quality profile.
In closing
We look forward to hearing from you. Please send us your feedback by asking some questions on StackOverflow or directly by reporting any bugs you find on the SonarQube Google Group. You can also submit suggestions for new features, for example, on User Voice.


0 comments