
Today we released PIX version 2101.27, which can be downloaded here. This release adds support for new GPUs and counters to AMD’s PIX plugin, improves the DXIL debugging experience, contains several enhancements to the CPU sampling profiler, and adds many other smaller improvements.
AMD plugin improvements
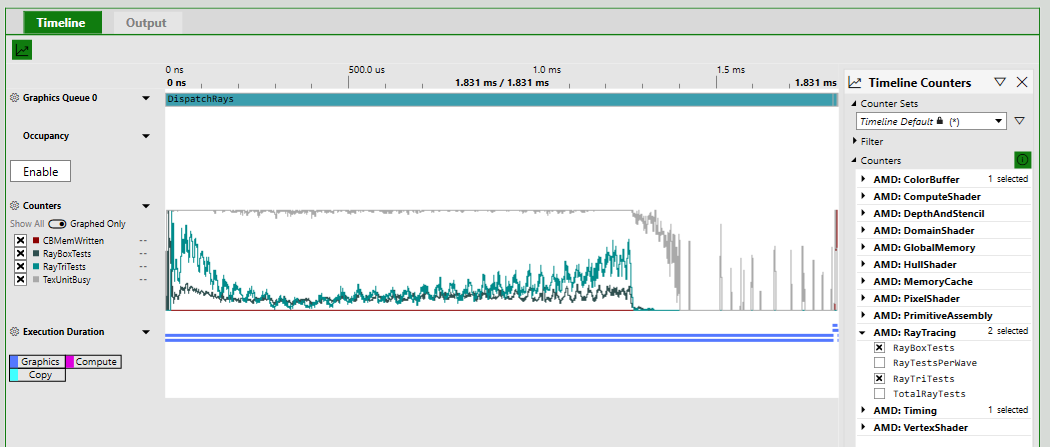
This release includes a new AMD plugin. This plugin adds support for AMD RDNA™ 2 Radeon™ RX 6000 series GPUs, which means that PIX features such as Event List Counters and High Frequency Counters are now available on these GPUs.
The plugin also adds support for new raytracing counters on RX 6000 series GPUs. This means that PIX now offers deep insight into raytracing workloads on recent GPUs from AMD and NVIDIA. Many thanks to our IHV partners for making this possible!
On AMD RDNA™ Radeon™ RX 5000 series GPUs, the plugin adds support for new memory cache counters for scalar cache and instruction cache.
DXIL debugging improvements
We have made several improvements to PIX if you’re using DXIL:
- Shader Edit and Continue: fixed many issues while editing the compiler options to reduce the optimization level
- Shader Debugger: improved the accuracy of HLSL variables and HLSL line numbers when external PDBs are used
- Shader Debugger: added support for member methods in structs
New grouping and filtering capabilities in the CPU sampling profiler
The sampling profiler built into Timing Captures now includes the ability to organize the stack tree by threads, cores, or by cores followed by threads. In addition, the set of samples displayed in the stack tree or flat function list can be restricted to those samples that were collected during the period of time in which the instances of one or more PIX events were running. The stack tree can also be organized based on a “focused function”. Selecting a function as a “focus function” rebuilds the stack tree based on all calls to that function. The focused function becomes the top node in the tree with its entire calltree displayed as children.
New Active Metrics panel in Timing Captures
The Metrics view in Timing Captures now contains a panel that displays all currently active metrics. The table of graphed metrics includes a checkbox that can be used to toggle whether a given metric is currently graphed, along with dropdowns to customize various aspects of how individual Metrics are graphed. A metric’s line style, color, and the aggregation mode (minimum, maximum, average) can all be customized. The ability to remove a metric from the active list is also provided.
Function Summary and Callgraph Captures are now deprecated
PIX Function Summary and Callgraph Captures are deprecated starting with the January 2021 release of PIX. The ability to take Function Summary and Callgraph Captures will be removed in an upcoming release. The primary profiling workflows previously provided by these captures are now provided by the Sampling Profiler that is part of Timing Captures. See the documentation pages for Function Summary and Callgraph captures for more information on the replacement workflows.
Other improvements
- Add capture/replay support for OpenExistingHeapFromAddress/FileMapping
- Fix capture/replay of 11On12 applications using the discrete GPU on a hybrid device
- Fix capture/replay of copy queue timestamps
- Fix issue capturing applications that quickly recycle placed acceleration structure resources
- Fix issue capturing some large raytracing PSO descs
- Fix/improve “High ExecuteIndirect MaxCommandCount” warning
- Shader Table Viewer: Add new viewer for “raw” mode, with better perf
- Mesh Viewer and Acceleration Structure Viewer: Misc improvements to speed, usability
- Texture Viewer: Prevent potential clipboard crash while copying content
- Texture Viewer: Fix alpha-only rendering
- Texture Viewer: Show “Mip/Slice # only” when texture is single mip
- Texture Viewer and Gold Image: Fix 9995 render for gold image, fix pixel details for 9995
- Gold Image: Fix rendering of RGBA8
- Pipeline View: Add link from Info Panel to the Descriptor Heap Viewer
- Pipeline View: Misc fixes to avoid disappearing sizers, etc
- Buffer Viewer: improve selection perf (table mode)
- Fix bugs with maximizing/maximized PIX (wrong size, blocking popups, etc.)
- Allow multi-select in file open dialog
- Fix display of various D3D12 flag enums in UI
- Remoting: Fix potential race condition during file transfer
- Fix potential crash if you close PC connection while it’s connecting
- Fix potential race condition between engine finalizing GPU Capture file + UI opening the file
0 comments