
Function Summary and Callgraph captures are deprecated starting with the 2102.27 release of PIX on Windows.
The workflows supported by these legacy capture types have been replaced with enhancements we’re recently made to the Sampling Profiler that is part of Timing Captures. These enhancements include the ability to group the tree of aggregated CPU samples by thread or core, and the ability to designate a function as a focus function. In addition, the integration of function data into Timing Captures enables some profiling scenarios that weren’t possible before, such as the ability to restrict the set of CPU samples you’re analyzing to be those that were collected during the time when one or more PIX events was executing.
To access the Sampling Profiler, choose a sampling interval and select the CPU Samples checkbox when starting a capture.

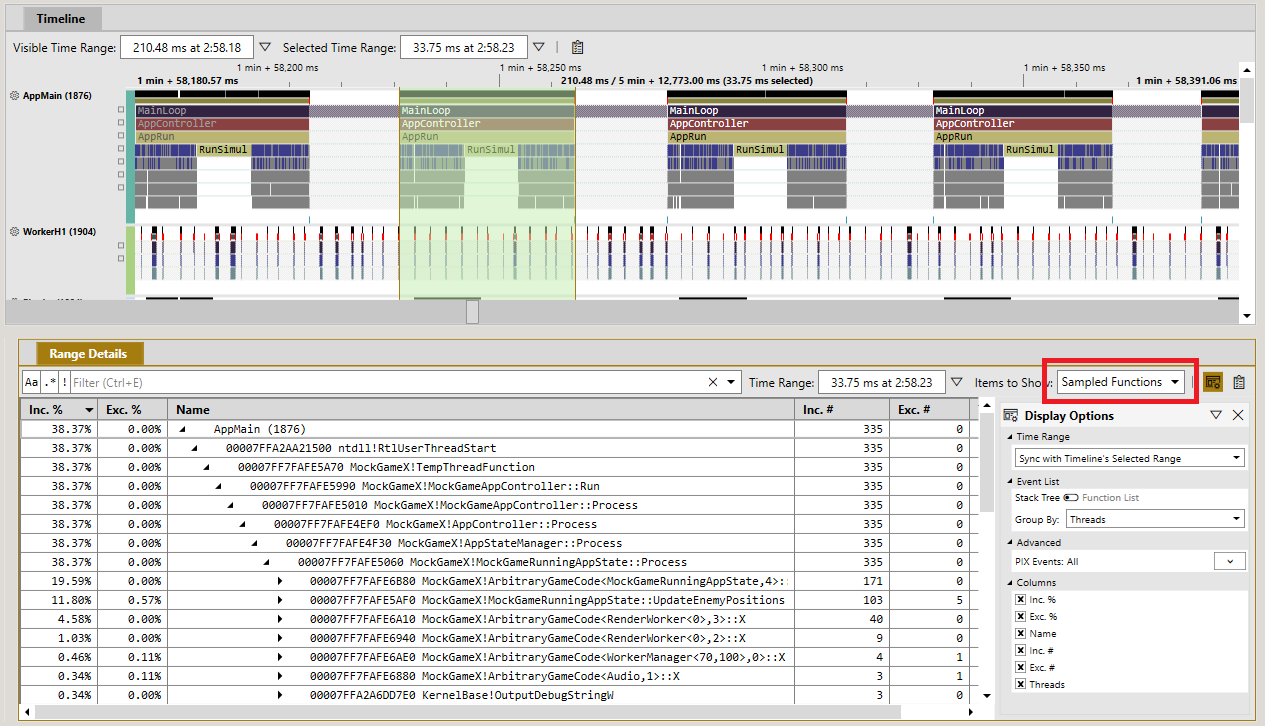
After the capture opens, an aggregated tree of the collected samples can be accessed by selecting Sampled Functions from the Items to show dropdown in the Range Details view.
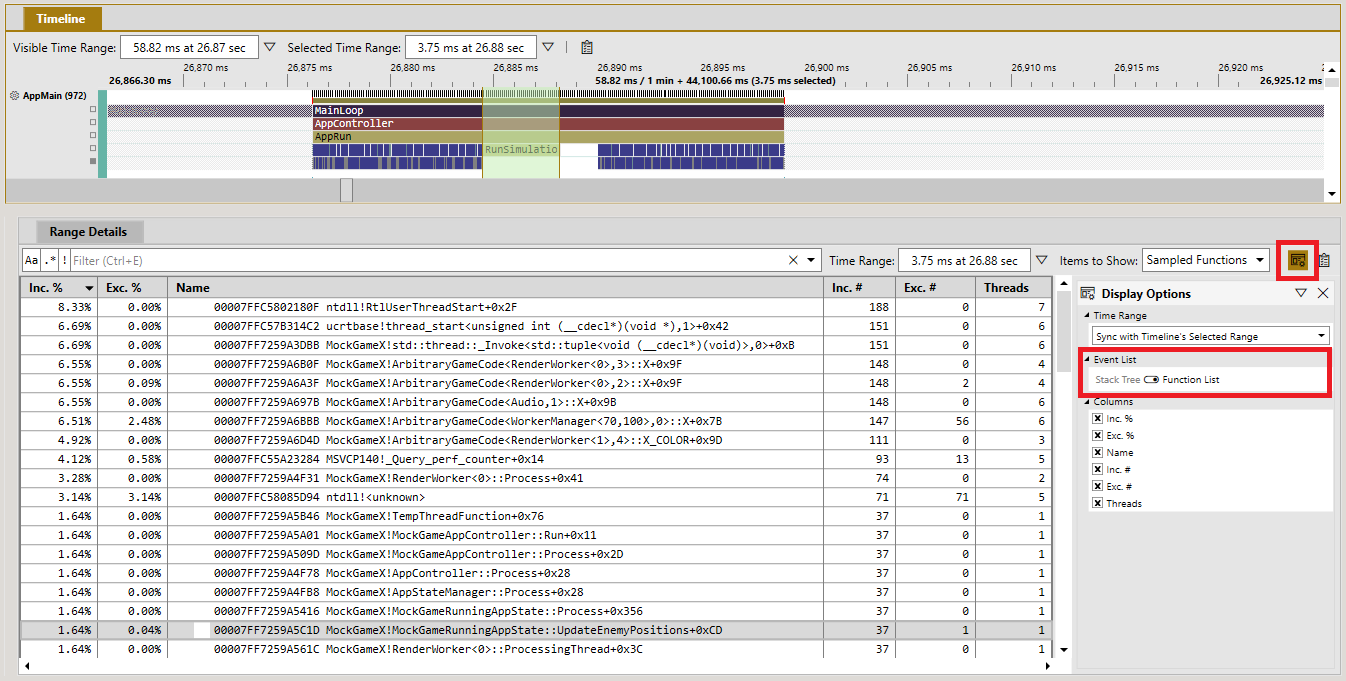
Function Summary Captures were commonly used to find a title’s most expensive functions in terms of Inclusive and Exclusive duration. The Sampling Profiler now provides this capability via a flat function list that is created by aggregating the CPU samples collected while a Timing Capture is running. The function list can be accessed by selecting Function List in the Display Options panel while viewing Sampling Functions.
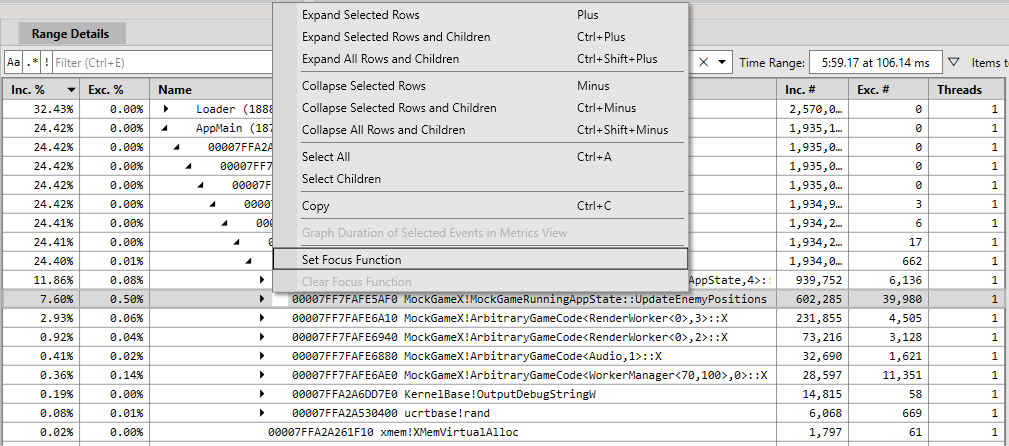
Callgraph Captures were commonly used to analyze the full callgraph of a specified function to find the call path called most frequently, the path that took the longest to execute and so on. This capability is provided in the Sampling Profiler by allowing you to view the calltree based on a focused function. Selecting a function as a focus function rebuilds the stack tree based on all calls to that function. The focused function becomes the top node in the tree with its entire calltree displayed as children. To select a function to focus on, right click on a function in the Range Details view and choose the Set Focus Function from the context menu.
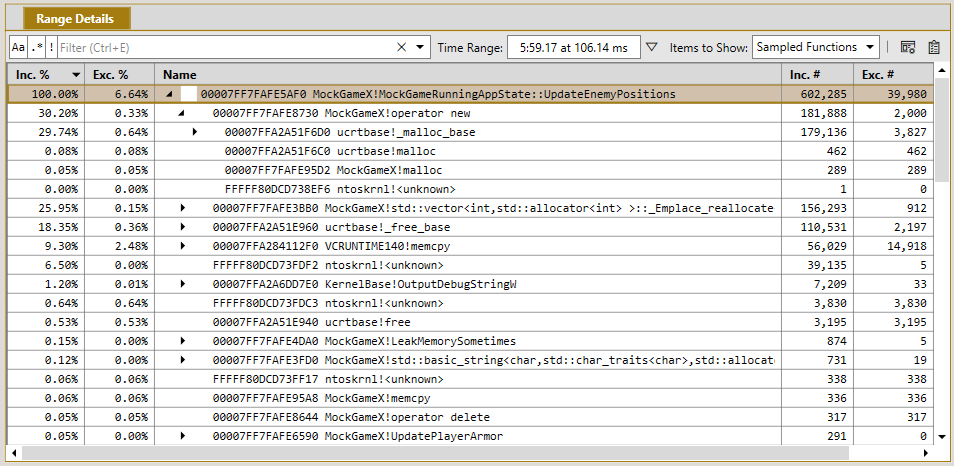
The stack tree will be rebuilt with the selected function as the focus. The options to group by thread and core, and to restrict the set of samples based on one or more PIX events can be used to further customize how the data is displayed. The following figure shows a stack tree with the function UpdateEnemyPositions as the focus function.
If you should need to access the deprecated Function Summary or Callgraph Captures for any reason, you can do so by selecting the Enable legacy Callgraph and Function Summary capture types checkbox on PIX’s Settings page.

Finally, if you used Function Summary or Callgraph captures for workflows that aren’t covered by the Sampling Profiler, be sure to let us know. Send us an email using the PIX Feedback button in the upper left corner of the PIX UI.
Steven.
0 comments