
PIX includes a CPU sampling profiler that can optionally be run when taking a Timing Capture. Collecting CPU samples allows you to analyze how functions within your title are impacting performance.
Viewing CPU samples is useful in several scenarios. For example, CPU samples can help you determine what code is running on a thread or core for portions of your title that either have sparse or no instrumentation with PIX events. Diagnosing performance issues using CPU samples in this scenario is more efficient than having to add additional instrumentation to your title, rebuild and redeploy.
In addition, looking at an aggregated view of the CPU samples taken over a relatively long capture can be used to find which functions are executed the most frequently and which take the longest to execute.
PIX’s sampling profiler also includes a C++ source code view. The source view uses coloring to attribute the collected CPU samples with source lines, thereby identifying the hot spots within a function.
Collecting CPU Samples
Before collecting samples, PIX must be configured to find your title’s PDBs. Symbol information in the PDBs is used to display function names for the CPU samples PIX collects. See Configuring PIX to access CPU PDBs for more information.
To collect CPU samples, select the CPU Samples checkbox in the CPU section of the Timing Capture options pane. A sampling interval also must be specified using the Sampling Rate dropdown. The three built in options for sampling interval allow you to find a balance between the increased resolution you’ll get with more CPU samples and the additional overhead a higher sampling rate will incur.

When a Timing Capture is opened, PIX displays information about the samples collected in the Timeline, Element Details and Range Details views.
CPU samples in the Timeline and Element Details view
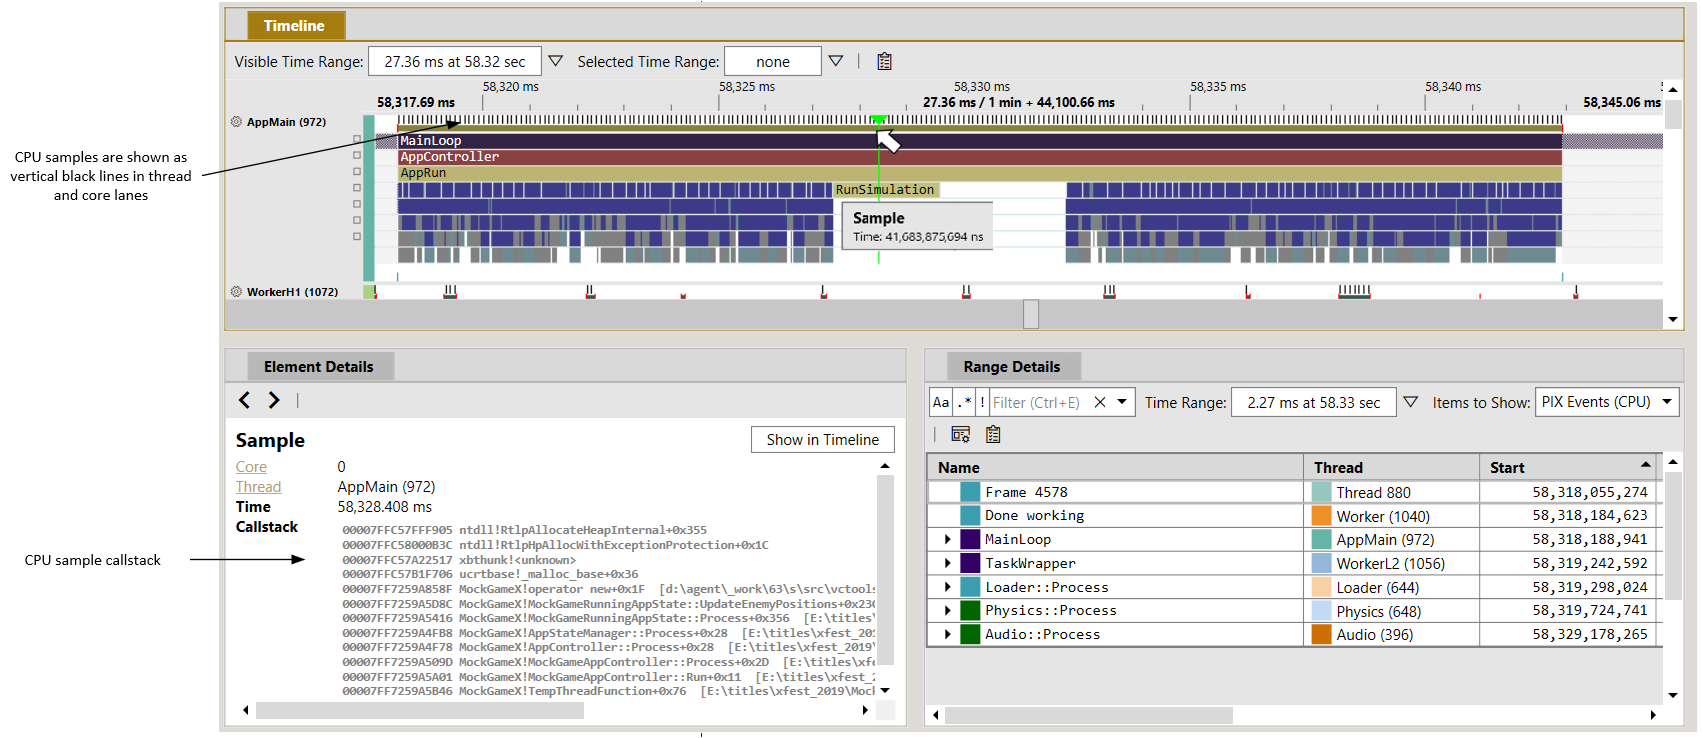
Individual CPU samples are shown on the Thread and Core lanes in the Timeline as vertical black lines just above the thread or core indicator bar. Selecting a sample populates the Element Details view with the sample’s callstack.
The following figure shows a PIX event named RunSimulation that takes several milliseconds to complete and has no child PIX events. Selecting individual samples gives you more detail about what code is running during this period of time in which the title hasn’t been instrumented with more granular PIX events. For example, looking at the callstack for the selected sample in the following figure shows that a function named UpdateEnemyPositions is running and that it is allocating memory using the new operator.
Customizing the display of CPU Samples
The display of CPU samples can be customized using either the gear icon next to a thread or core lane, or by using the Lane Configuration panel. The height of the vertical black line that represents a sample can be customized, as well as whether samples should be shown in the lane at all as shown in the following figure.

Analyzing aggregated CPU samples
When a range of time is selected in the Timeline, the Range Details view can be used to see an aggregation of all samples that occurred in the selected time range. The samples are aggregated across all threads and cores and can be viewed either as a stack tree or a flat function list.
Several options exist to change the set of samples that are displayed and to customize how those samples are organized in the stack tree. See the following topics for more information.
- Grouping by threads or cores
- Restricting the set of displayed samples by one or more PIX events
- Specifying a function as the focus function
Select Sampled Functions from the Items to show dropdown in Range Details to view the aggregated samples.
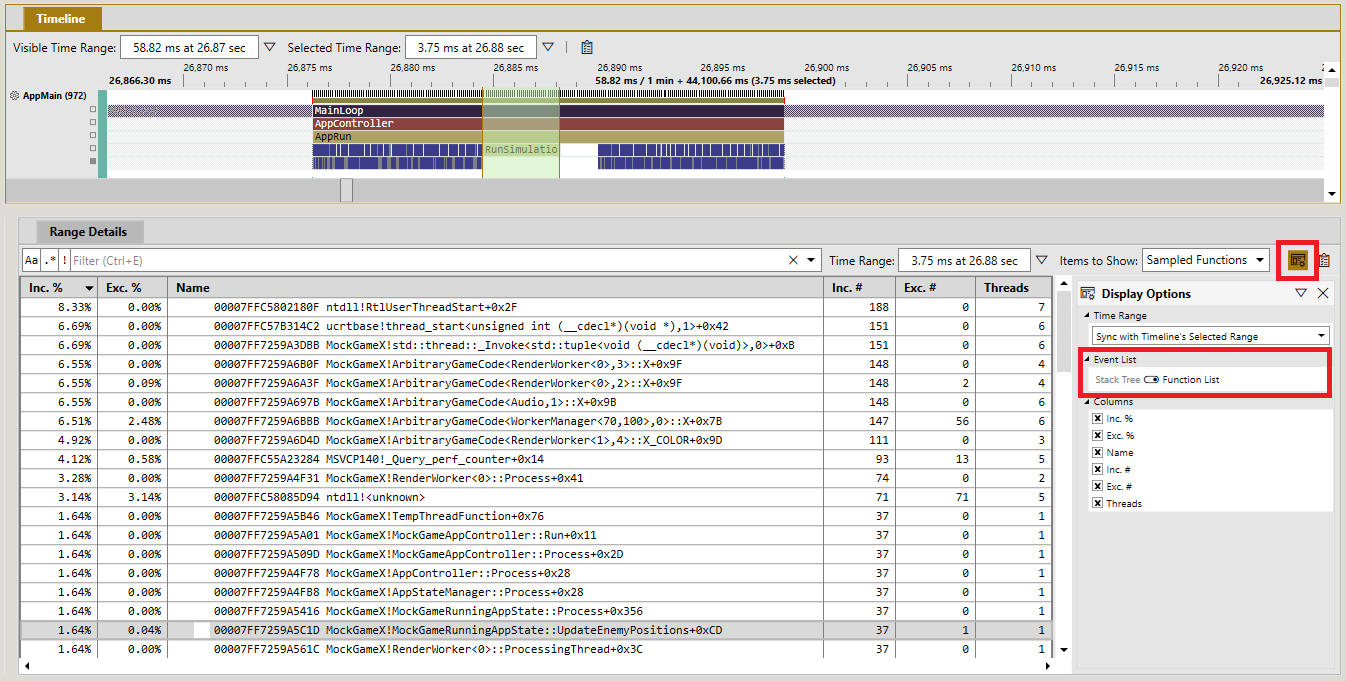
Viewing the aggregated samples as a stack tree allows you to see which callstacks occurred most frequently in the selected time range. The number of times a sample landed in a given function, both inclusive and exclusive, along with the inclusive and exclusive percentages are shown as columns for each function in the stack tree.
The following figure shows the aggregated stack tree for a selected range of time. The Inc % column in the stack tree shows that 33.33% of the samples occurred in the UpdateEnemyPositions function or it’s children.

To view the aggregated samples as a flat list, open the Display Options panel and switch the slider from Stack Tree to Function List. The Display Options panel can also be used to customize which columns appear in the events list.
Grouping the stack tree by threads or cores
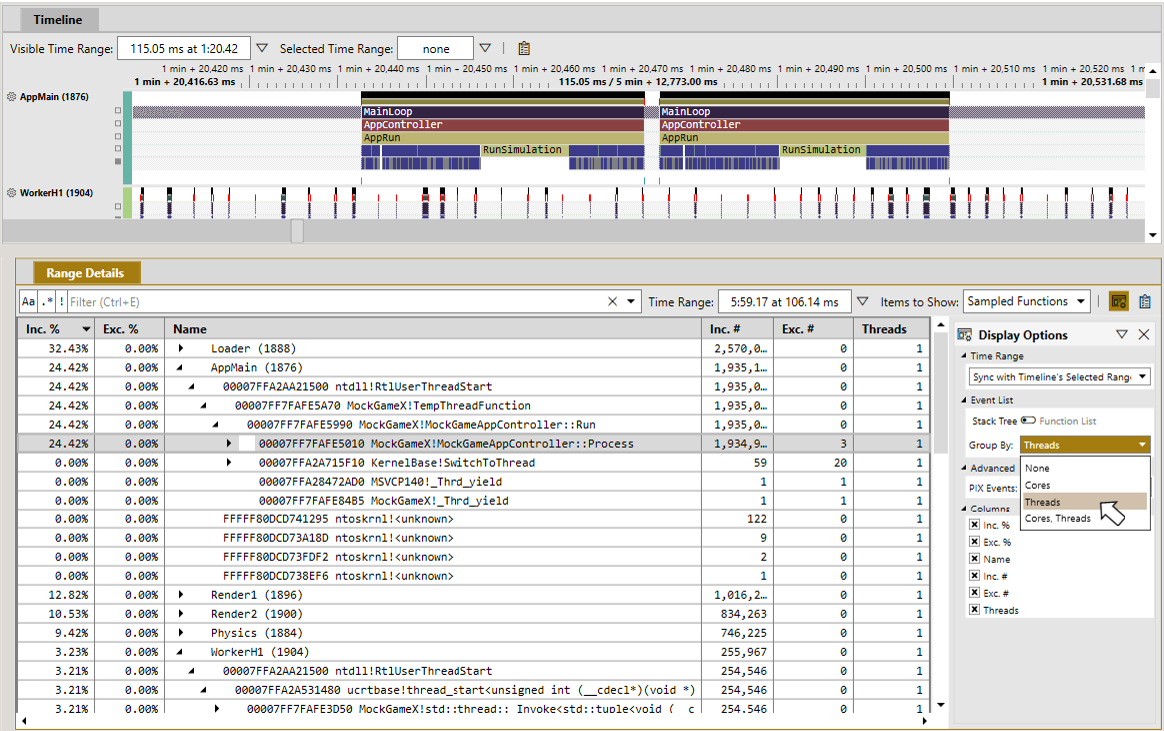
By default, the CPU samples from all threads and cores are grouped together in the stack tree. However, there are scenarios in which you may want to focus your analysis on the samples that were collected on only a subset of the threads and cores. The Group by dropdown in the Display Options panel provides options to group the tree by threads, cores, or cores followed by threads.
When a grouping option is selected, the stack tree is reorganized such that there is one root note per thread or core, depending on the grouping option selected. The following figure shows a stack tree grouped by thread. Each root node in the tree contains the samples collected for a single thread.
Restricting the set of displayed samples using PIX events
The set of samples displayed in the stack tree or flat function list can be restricted to those samples that were collected during the period of time in which the instances of one or more PIX events were running. Restricting the samples in this way allows you to analyze the functions that were running between calls to PIXBeginEvent and PIXEndEvent.
Use the PIX Events filter control in the Display Options tab to select one or more PIX events. Depending on how many events your title emits, the filter control may initially indicate that there are too many events to display.
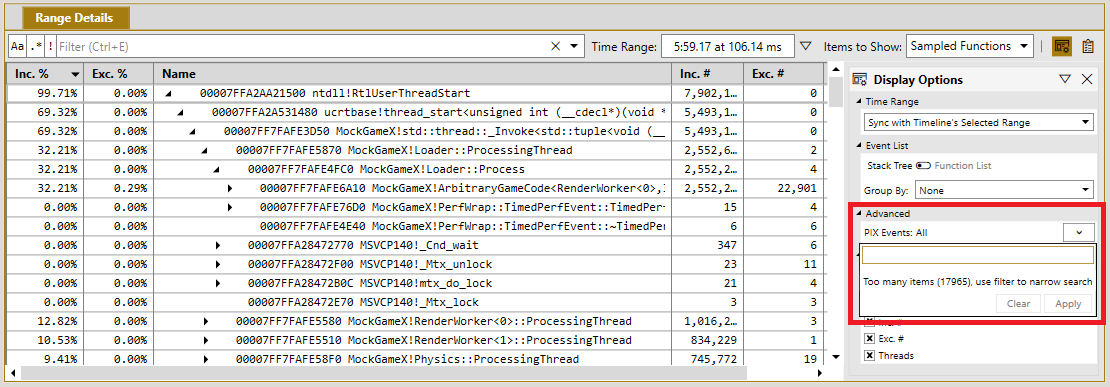
Enter a string in the dropdown to filter the set of PIX events. The following figure shows the list of PIX events filtered to those that contain the string Update.
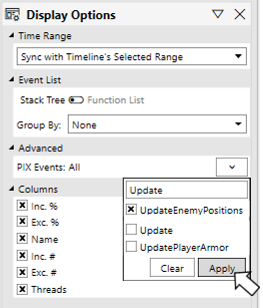
Selecting one or more PIX events will cause the stack tree or function list to be recomputed using the samples that were collected when all instances of the specified event(s) were executing. Click the Apply button to rebuild the stack tree or function list.
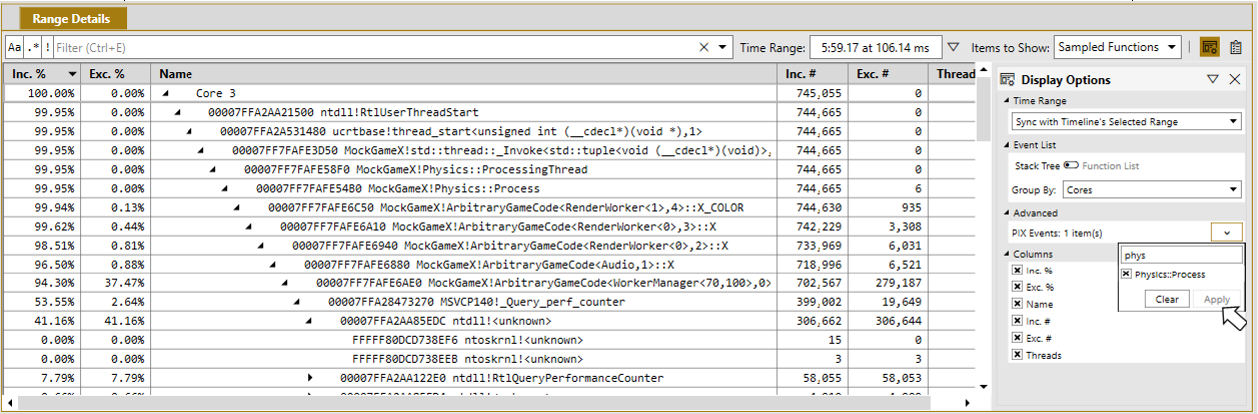
The following figure shows the stack tree for the CPU samples that were collected when instances of the PIX event Physics::Process were running. The grouping options can be used to organize the tree by core or thread.
Focusing on a function
Selecting a function as a focus function rebuilds the stack tree based on all calls to that function. The focused function becomes the top node in the tree with its entire calltree displayed as children. Viewing samples in this way allows you to analyze a function’s calltree to find the call paths that are called most frequently, take the longest time to execute and so on.
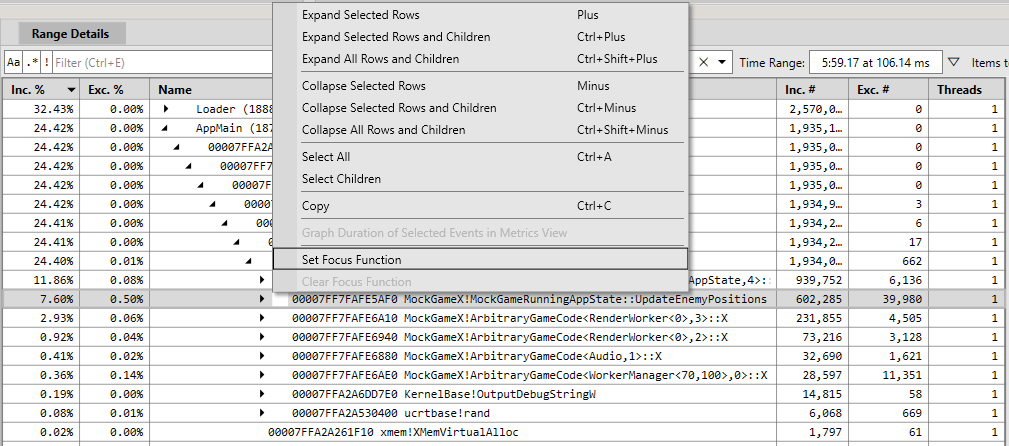
To select a function to focus on, right click on a function in the Range Details view and choose Set Focus Function from the context menu as shown in the following figure.
The stack tree will be rebuilt with the selected function as the focus. The options to group by thread and core, and to restrict the set of samples based on one or more PIX events can be used to further customize how the data is displayed. The following figure shows a stack tree with the function UpdateEnemyPositions as the focus function.

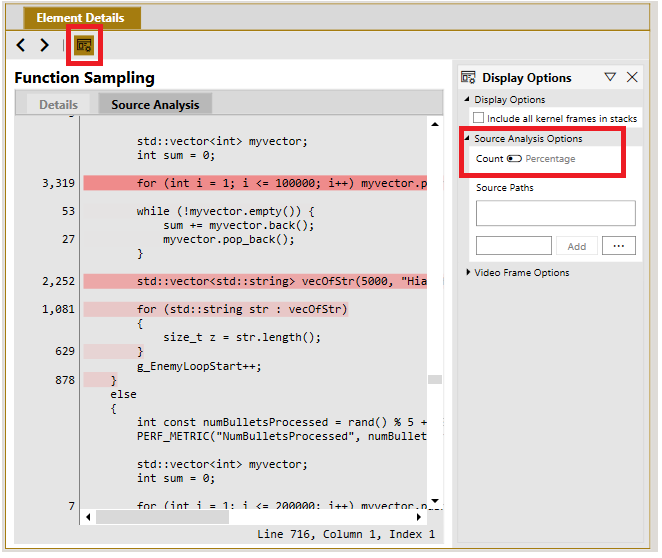
The sampling profiler C++ source view
The sampling profiler source view is used to identify the hot spots, or the lines of code on which the majority of samples landed, for a given function.
To view the annotated source for a function, select the function in the Range Details view and toggle the Element Details view from Details to Source Analysis as shown in the following figure.
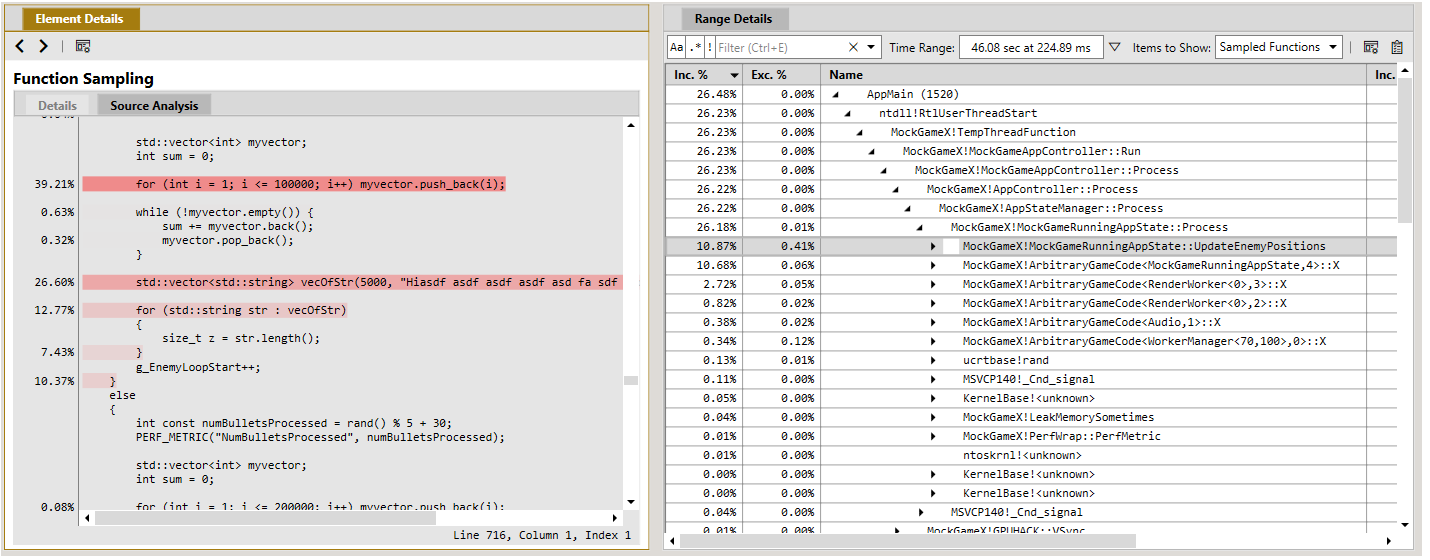
The boldness of the highlight on a given source line is relative the percentage of samples that occurred while that line was executed. The bolder the line the more frequently that line was executed. By default, the source view shows sample frequency in terms of percentages. Use the Display Options panel on the view to switch the display to sample counts, if desired.
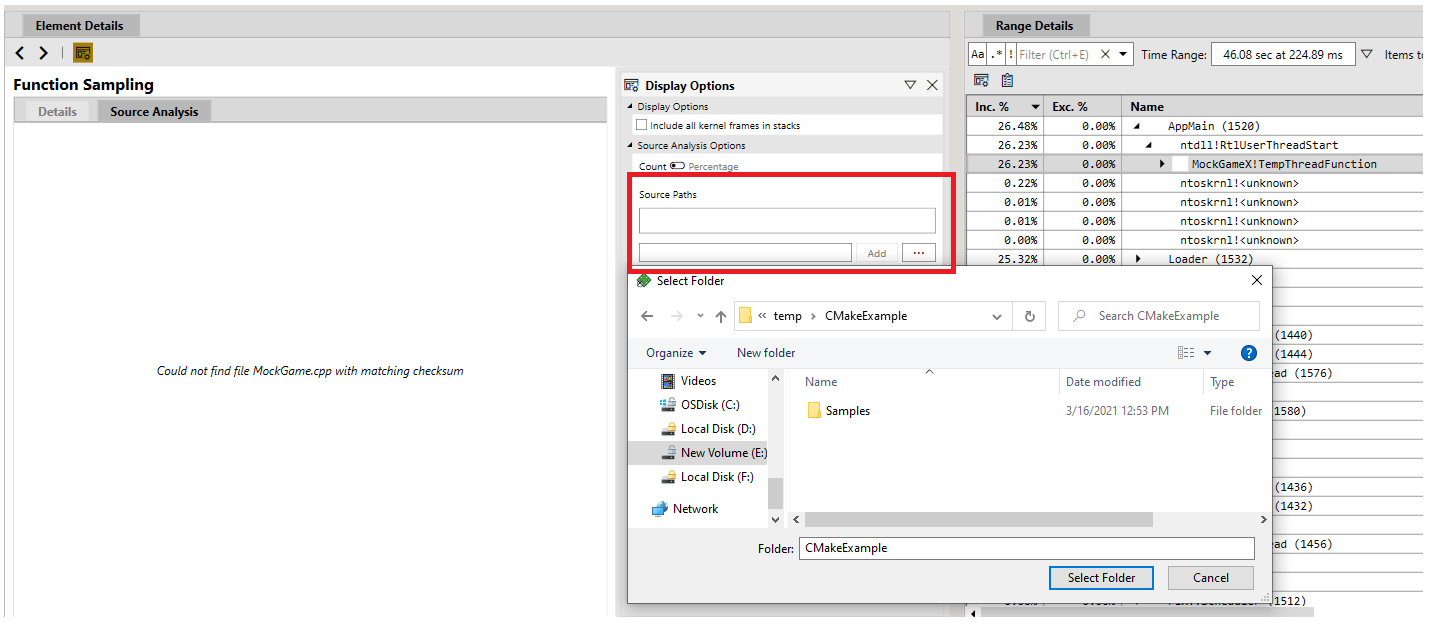
The sampling profiler uses the source file paths stored in your title’s PDBs to locate the matching source file. If that file can’t be found, the source analysis view will contain text stating:
Could not find “filename”.cpp with a matching checksum
Use the Source Paths control in either the Display Options panel or the main Settings page to specify one or more directories that PIX should search for source files if they can’t be found at the default location.
0 comments