
The Sampling Profiler included in the 2101.27 release of PIX on Windows includes a novel new feature that allows you to filter the analysis of CPU samples down to just those samples that were collected during the time when one or more PIX events was running. This capability is particularly useful for seeing which functions ran the most frequently, or took the most time, in places where your title is only sparsely instrumented with PIX events.
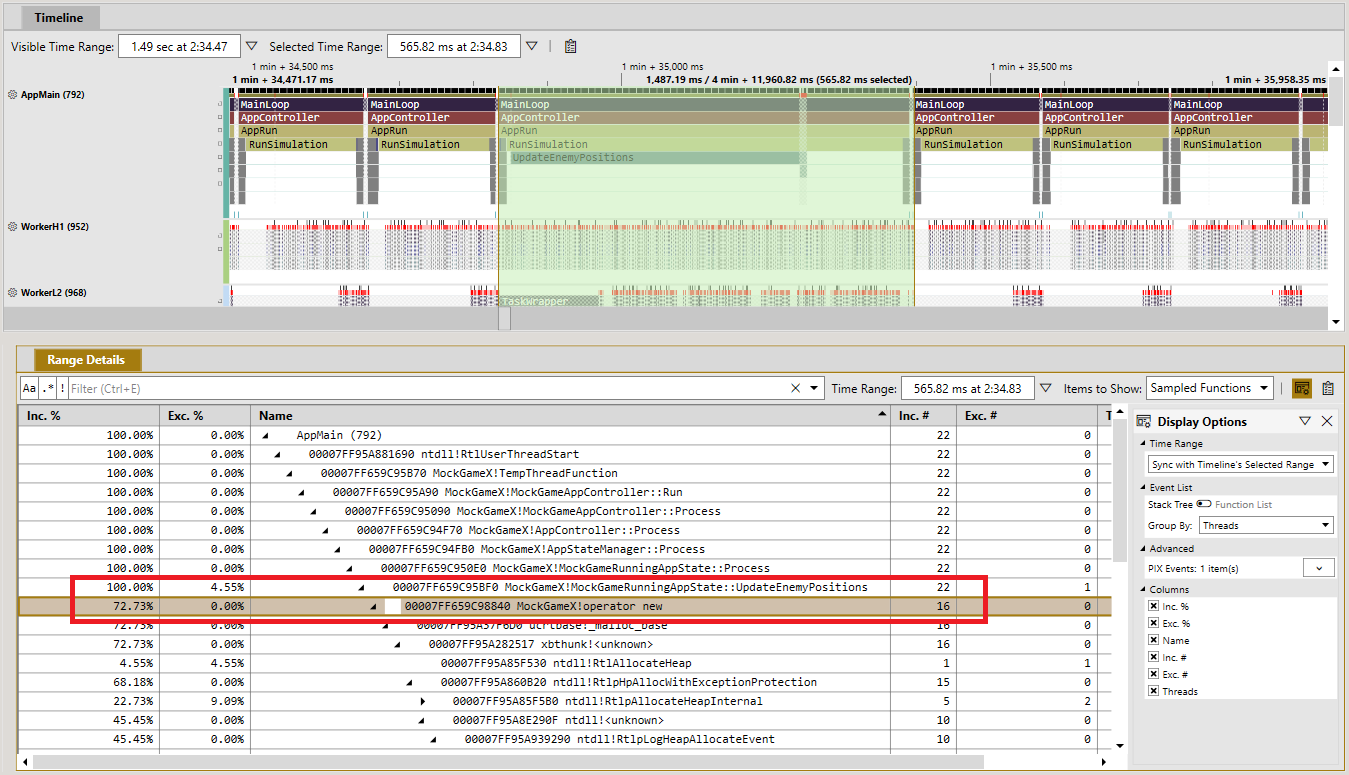
For example, the following picture shows several CPU frames in the Timeline view of a Timing Capture. The top-most frame event is called MainLoop. It’s clear that the frame encircled in red took substantially longer the execute than the frames around it. To begin to understand why, I’ve selected a range of time roughly equivalent to my long frame and have populated the Range Details view with an aggregated tree of the CPU samples that were collected during that time range.

The characteristic of my long frame that stands out is the exceptionally long duration of the UpdateEnemyPositions event. The “normal” frames either don’t have an instance of this event at all, or the event’s duration is so small that it doesn’t appear at my current zoom level. Unfortunately, there is no further PIX event instrumentation underneath UpdateEnemyPositions to help diagnose what’s going on.
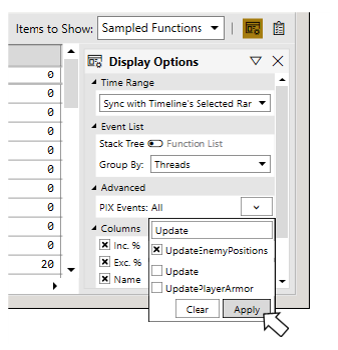
This is where the ability to filter the Sampled Functions tree using a particular PIX event comes in handy. Start by selecting the down arrow next to PIX events: All in the Display Options panel. Depending on how heavily your title is instrumented, the filter control may initially indicate that there are too many events to display.

Use the filter bar to find the UpdateEnemyPositions event and select Apply.
The tree of aggregated samples is rebuilt to include only those samples that were collected during the period of time while UpdateEnemyPositions was running. Drilling into the tree shows that memory allocation is the culprit here. As can be seen in the following picture, the vast majority of the time spent in UpdateEnemyPositions is a callpath that goes through operator new.
While viewing the sampled functions tree filtered by one or more PIX events, keep in mind that the set of samples displayed are all samples collected during the time specified PIX event(s) was running across all threads and cores. If the PIX event(s) you selected as your filter criteria runs on several threads or cores, consider organizing the tree by using the Group By dropdown in the Display Options panel if needed.
Steven.
0 comments