
Our customer develops connected blood glucose meters to provide innovative diabetes solutions to its patients. Using this meter, they’re able to store and archive patients’ data for further analysis. Furthermore, their connected device allows them to provide real-time analysis of the measured glucose values and make predictions about an upcoming hypoglycemic (hypo) event. Considering the traumatic experience of a diabetes hypo and its associated cost, being able to alert patients about a possible upcoming hypo can be of a tremendous value to them.
This case study describes the approach we took to create a Microsoft Azure Machine Learning (MAML) model which predicts diabetes hypos based on blood glucose measurements only.
Overview of the Solution
Figure 1 shows an overview of our approach:
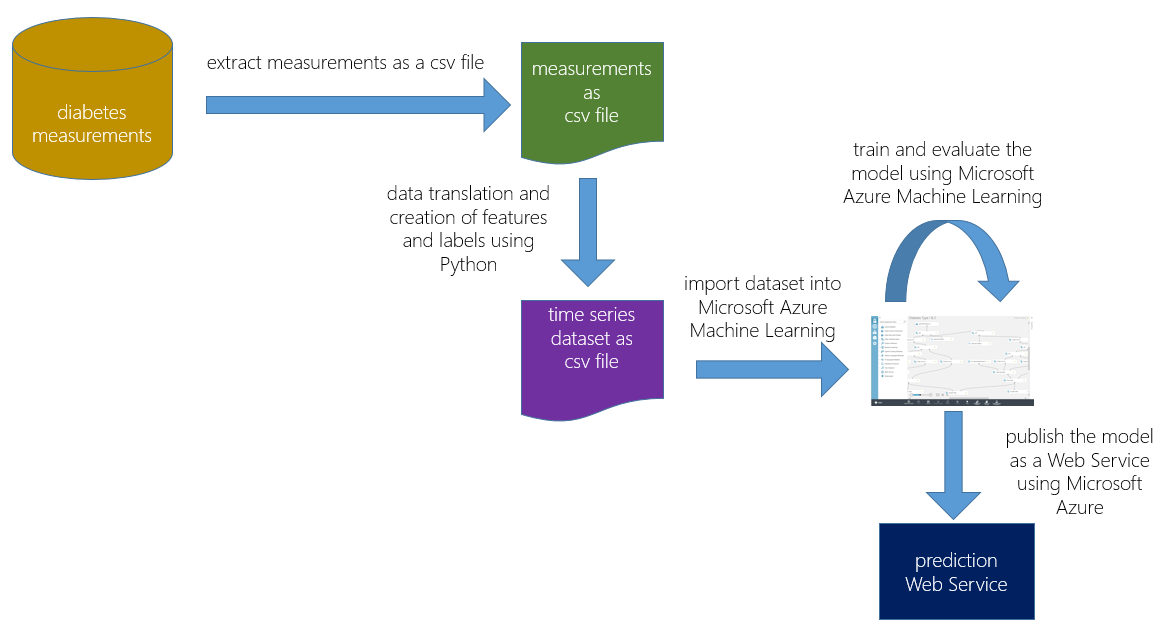
Figure 1: overview of the approach
- We extracted the relevant information from the operational system and stored it as a comma-separated values (csv) file.
- We used Python to transform the data and create the dataset containing the needed features and labels.
- After uploading the dataset to MAML, we started to build experiments and evaluate their results.
Development was comprised of multiple iterations; in each iteration, we refined the Python script for feature and label creation, then rebuilt and re-evaluated the MAML model.
Once the model was sufficiently accurate, we published it as a Web Service, which was then integrated into the real-time data pipeline.
Implementation
The first step was to extract the historical measurements and store them in a csv file. This file contains the following four columns:
anonymized patient id, diabetes type, timestamp, glucose value
Our initial idea was to predict a hypo event based on previous measurements. To do so, we translated the data into a time series of measurements and used this to train our machine learning algorithm to predict the glucose value for a specific hour. Not surprisingly, this approach didn’t yield useful results, mainly because we were lacking critical data: To predict the actual glucose value for a specific hour/timeslot, we would require additional details only available from other data such as information about insulin injections and food/drink intake.
While analyzing the data, we also realized that it is better to separate the different diabetes types: While we have an average of 2-3 daily measurements for patients of diabetes type 2, many patients of diabetes type 1 measure their glucose value more frequently – which led to a dataset where type 1 measurements made of 90% of the data.
We also decided to do a binary classification to predict whether a hypo event might occur within the next 24 hours (instead of the initial approach of using linear regression to predict the glucose value for a specific hour). Such a prediction is especially useful to patients of diabetes type 2, who measure their glucose value only a few times a day, so knowing they’re at risk might help them to closer manage their blood glucose values over the following 24 hours.
We translated the raw, extracted csv file into a new dataset, formatted to make predictions based on a time series of historical data. In our case, the final dataset contained the following information:
- patient id, diabetes type, measured glucose value
- sequence number of measurement starting at 1 for each patient; this is used to split the dataset into a training and validation set without “destroying” the time series (e.g. use 1-2000 for training and 2001-3000 for validation)
- the label: did a hypo occur within the next 24 hours? (a hypo is defined as glucose value < 4.0)
- the high, low, and average glucose values across the last 3 measurements
- the time between the current and the 3rd last measurement in minutes
- the high, low, and average glucose value each day for the last 7 days
- the number of measurements within the last 7 days
A reusable python script for creating such time series datasets has been published to GitHub:
https://github.com/cloudbeatsch/CreateTimeSeriesData
The CreateTimeSeriesData.py script provides the following inputs to control the generation of the time series dataset:
usage: CreateTimeSeriesData.py [-h] [-i ID] [-t TIMESTAMP] [-v VALUE]
                               [-a [ADDITIONAL_COLS [ADDITIONAL_COLS ...]]]
                               inputCSV outputCSV threshold
                               trigger_window_size datapoints slots slot_size

positional arguments:
  inputCSV              path to input csv file
  outputCSV             path to output csv file
  threshold             threshold of positive event
  trigger_window_size   trigger window size in seconds
  datapoints            nr of latest datapoints
  slots                 nr of slots in time series
  slot_size             slot size in seconds
Figure 2 visualizes the core concepts of the script: The trigger window, last data points and slots:
- trigger_window_size defines how many seconds we search forward to find values which are below the threshold value. If we find a value that is below the threshold, we set the value of the output column IsTriggered to 2; in all other cases we set it to 1. Note: IsTriggered will become our label for training the machine learning algorithm.
- datapoints defines how many of the latest data points will be added to the output dataset.
- slots defines the number of slots we aggregate and add to the output dataset. The length of a slot is defined by the slot_size in seconds.
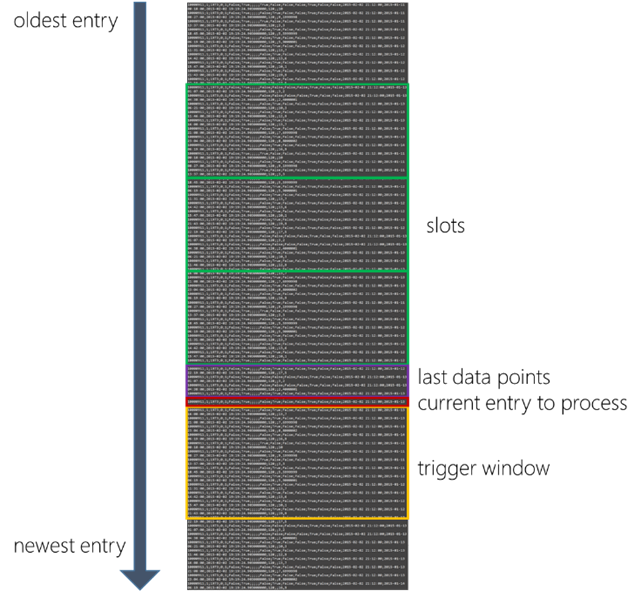
Figure 2: the concepts of trigger window, last data points and slots
To create our required format, we run the script using the following arguments:
- input.csv and output.csv filenames
- a threshold of 4 with a trigger window size of 24 hours (86400 seconds)
- adding the 3 last data points
- adding 7 slots of 24 hours each (86400 seconds)
- using the column called ID as the entity key (patient id)
- use the column called ValueMmol as the measurement value
- add one additional column (DiabetesTypeValue) from the input dataset to the output dataset
python CreateTimeSeriesData.py
    input.csv output.csv 4 86400 3 7 86400 --id=ID --value=ValueMmol
    -a DiabetesTypeValue
We uploaded the created dataset to MAML and created the experiment shown in Figure 3.
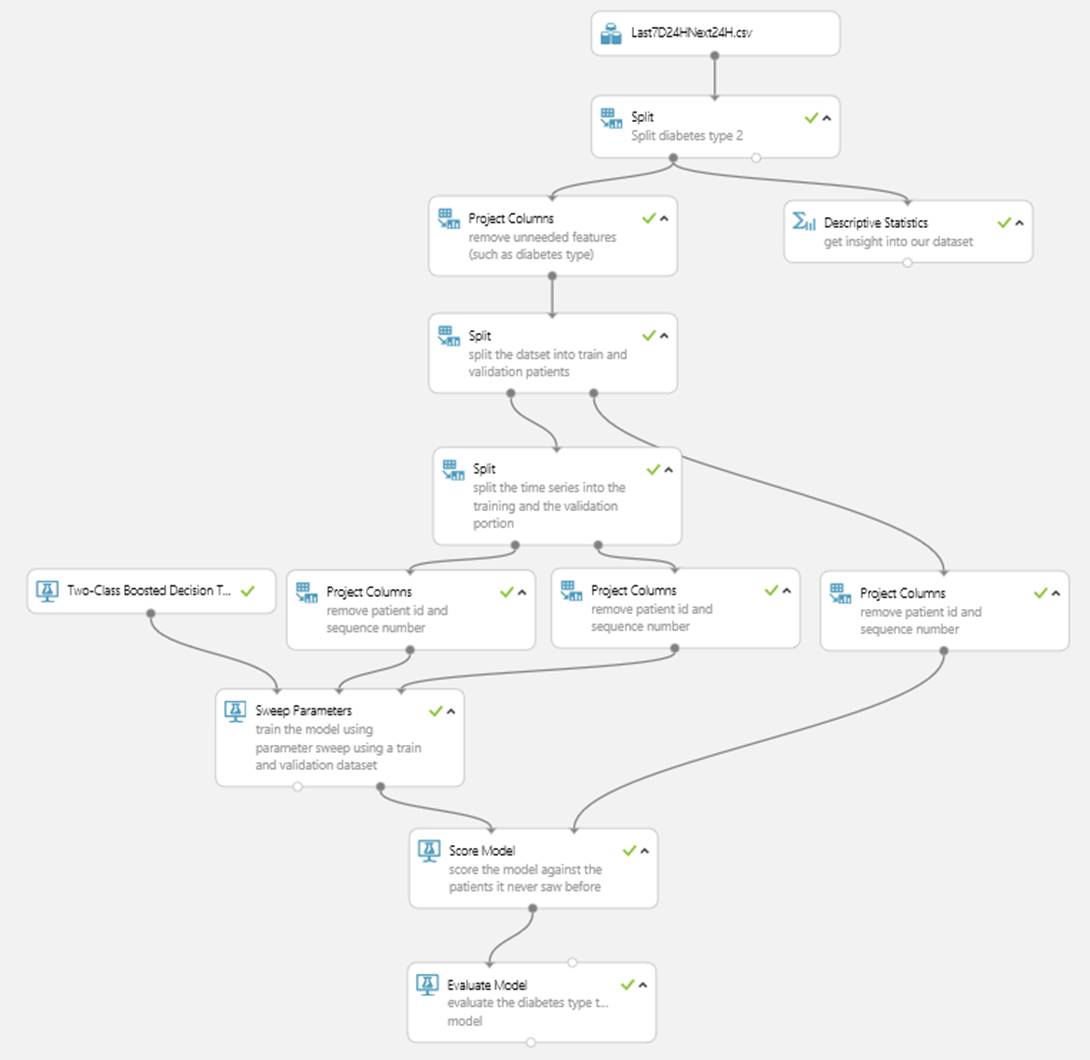
Figure 3: Experiment predicting hypo using MAML
The actual experiment contains two models; one for diabetes type 1 and one for diabetes type 2. We split the patients into a set for training and another set for model evaluation. This will guarantee that we evaluate the model against data it hasn’t seen before (in this case, patients which were not part of the training dataset). We’re also using a parameter sweep to find the best model parameters. To do so, we split the training dataset into a sweep training and a sweep validation set, using the sequence numbers. This ensures that the algorithm can learn about sequence patterns in the data. While experimenting and evaluating different algorithms, it was the Two-Class Boosted Decision Tree which yielded the best results.
We’re able to correctly predict ~35% of all hypos with only ~3% of our hypo predictions being a “false alarm” (see Figure 4). This makes it a useful tool to help the patients avoid more than 1/3 of hypos.
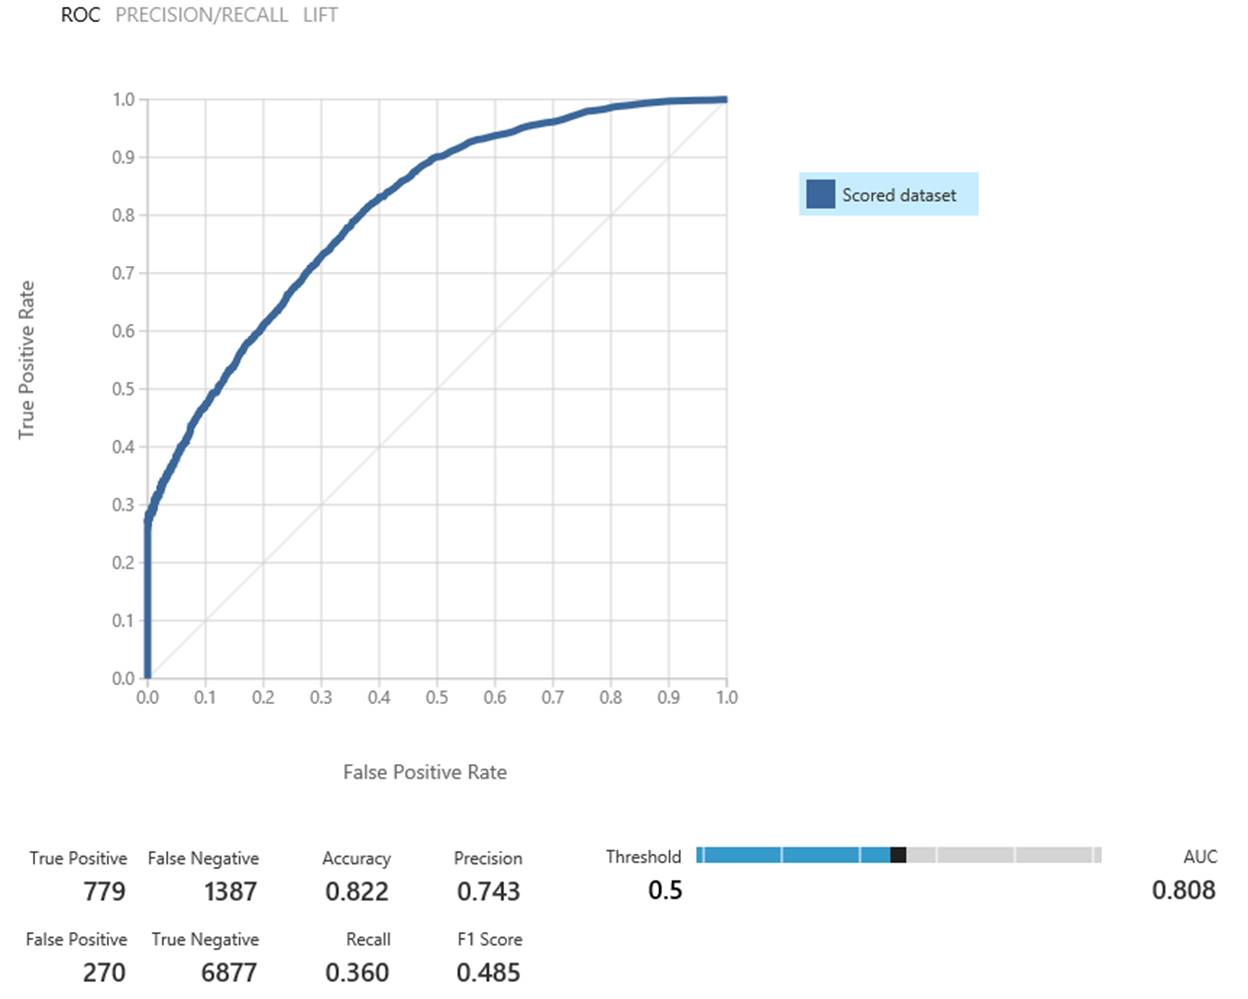
Figure 4: Model evaluation using MAML
While 35% isn’t an amazing result yet, it’s a great start to helping people with diabetes manage their care.
Because the model is not tied to a specific patient, its benefit can be made available to existing and new patients, without going through a lengthy learning phase.
Challenges
Given the data at hand, it took some time to understand the type of questions we are able to answer:
“What is the chance that a hypo occurs within the next 24 hours” versus “What will the glucose value be in 3 hours”
While creating the time series data, it was crucial not to leak any information about the label into its features. For instance, we had one dataset that yielded great results; these were a bit too good to be true. Unfortunately, the creation of the dataset had an error, and we leaked the hypo information into one of the features.
We required many cycles to land at a dataset which had the right features and yielded the results we wanted. The described Python script made it quite straightforward to experiment with different datasets and algorithms.
Opportunities for Reuse
The described approach of transforming data into time series for machine learning is widely applicable. The published Python script can be used and adapted to translate csv files containing series of events into a dataset that can be effectively used within MAML. Depending on the quality of data and the available time windows, such data can be used for regression and/or for classifications tasks.