With around 60 new features Visual Studio Update 3 has value through the entire development process from the new SDKs and emulators for Windows Phone and Windows Store development to the ~20 new features for Web developers including updates to ASP.NET Identity and Entity Framework. For team members focused on Application Lifecycle workflows there is a ton of new value for you too! If you are in a rush to get started you can skip directly to: Download Visual Studio 2013 Update 3 (also available on MSDN subscriber downloads).
For an end to end view of Visual Studio Update 3 please see:
http://blogs.msdn.com/b/bharry/archive/2014/08/04/vs-tfs-2013-3-update-3-released.aspx
- Announcing Visual Studio 2013 Update by Brian Harry
- To see the entire list of new features check out: Visual Studio 2013 Update 3 RTM release notes
- To see all the fixes please the KB: http://go.microsoft.com/fwlink/?LinkId=397828
For folks focusing on Application Lifecycle tools below is a list of top ALM Features in Visual Studio Update 3:
- CodeLens for Git improvements
- CodeLens Processing pipeline performance improvements
- Release Management deployments using PowerShell Desired State Configuration
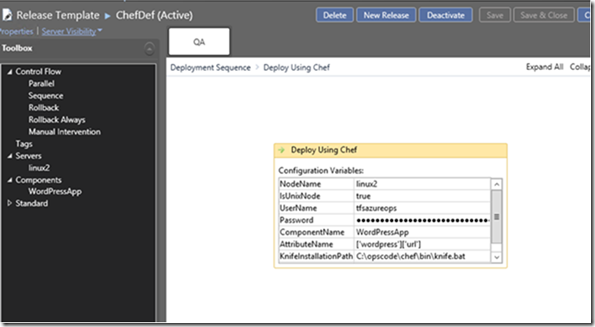
- Trigger deployments to Chef managed environments from Release Management 2013
- Deploy to Standard or Azure environments in Release Management 2013
- Agent-less deployments in Release Management 2013
- View Source in the CPU Usage tool
- Memory Usage Tool for WPF and Win32 Applications
- Diagnosing memory issues with the new Memory Usage Tool in Visual Studio
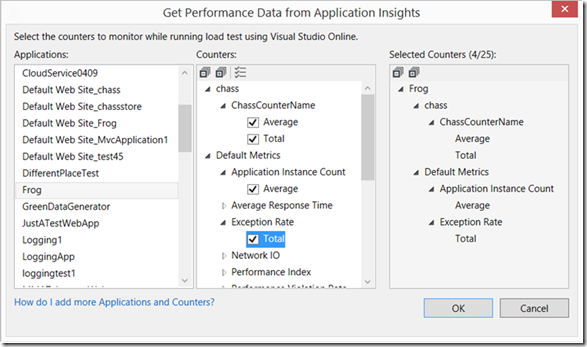
- Get Application Performance Counters of your choice during load runs with Visual Studio Online
- Test Plan and Test Suite Customization
- Application Insights Azure Portal Integration
- Improved diagnostic search across your logs with Application Insights
CodeLens
The Code Lens team has delivered performance optimizations, usability enhancements and a bunch of new features for Git users. For instance when you work with source control in Git and work items in TFS, you can view the CodeLens work items indicators for Git to obtain information about the work items associated with a method, property, or class.

Diagnostics
The diagnostics team have been on fire in terms of shipping enhancements in this Visual Studio Update with 10 new experiences being shipped by this team alone. One of my favorite Application Insights demos is going directly from a performance event to an Intellitrace log and then to the line of code that caused that performance degradation….MAGIC!

- State persistence for debugging which monitor your Windows Store application was last run.
- Now debug x86 applications that are built by .NET native.
- Analyze managed memory dump files, you can go to Definition **and **Find All References for the selected type.
- Debug the dump files from .NET Native applications by using Visual Studio debugger.
- Performance and Diagnostics hub can open profiling sessions (.diagsession files) that were exported from the F12 tools in the latest developer preview of Internet Explorer 11.
- Skip straight to the details of performance events that are exported from Application Insights to IntelliTrace.
- A new IntelliTrace collector is a standalone tool that you can use to collect IntelliTrace data from apps that are running in production environments. The new IntelliTrace Standalone Collector can be found here: IntelliTrace Collector for Visual Studio Update 3
- View Source in the CPU Usage tool
- Memory Usage Tool for WPF and Win32 Applications
- Performance and Diagnostics hub.
- Diagnosing memory issues with the new Memory Usage Tool in Visual Studio
Team Foundation Server
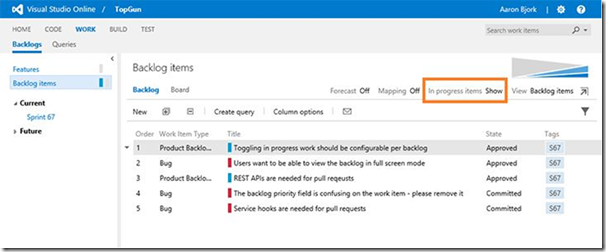
The Team Foundation Server Team has been very busy – but much of their work was delivered through Visual Studio Online and new features like the ability to use Organization IDs and Integration into the new Azure portal. That said they have not forgotten about their on premises sweetheart and have added the ability to traverse the group hierarchy and you can now show or hide the In Progress items in the backlog.

Release Management
Since the RC announcement Release Management has had the most features added. The ability to use PowerShell Desired State Configuration for deployments, be able to trigger Chef environments, agentless deployments and deploy to Azure and On-premises environments.

- Release Management deployments using PowerShell Desired State Configuration
- Trigger deployments to Chef managed environments from Release Management 2013
- Agent-less deployments in Release Management 2013
- Deploy to Standard or Azure environments in Release Management 2013
Test Tools
The Test Tools team continues to deliver test tools, functionality and value online. In the Test hub of Team Foundation Server Web Access you can now add custom fields and custom work flows for test plans and test suites, Manage Test Suites permission for granting access to test suites and track changes to test plans and test suites by using work item history. Cloud-based Load Tests can now deliver both standard and custom performance counters through integration with Application Insights. For more information on this and how to use Cloud Load Test to drive unit tests please see: Driving Unit Tests from Cloud Load Test

- Test Plan and Test Suite Customization
- Get Application Performance Counters of your choice during load runs with Visual Studio Online
Application Insights
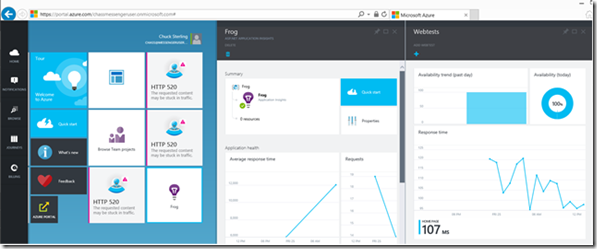
If you haven’t looked at Application Insights in a while you may be shocked to find out Application Insights now uses the Azure Preview portal to display monitoring data. Application Insights now is a 1st class citizen in the new Azure Portal:
https://portal.azure.com. In addition, the team has made searching your diagnostics logs even easier.


0 comments