Perform diagnostic search across your Application Insights telemetry
In Application Insights, we’ve just upgraded Diagnostic Search so that you can search all the raw telemetry such as page views, as well as the trace log calls that you can insert. This makes it a lot easier to find and follow chains of events in your app. So for example, if you inserted some log4Net, NLog or System.Diagnostics trace calls in your app, you can easily see which user requests are triggering them, and tie them up to any custom event calls you’ve set up.
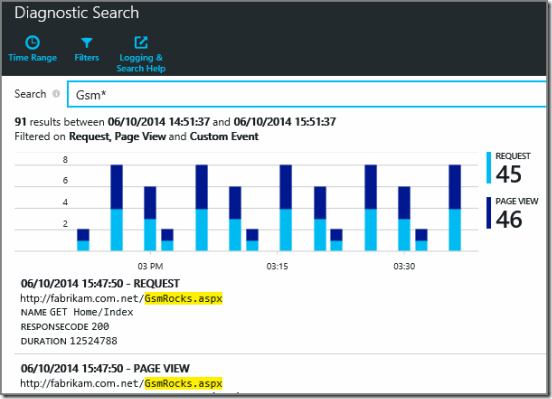
And we added a nice block graph summarizing the search results over recent history.
But please note that on October 9th we’ll be releasing a new SDK – you’ll have to download it and redeploy your apps in order to keep searching diagnostic logs (Trace). Other event types will continue to work as usual.
Searching the new event types
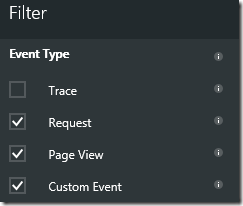
On the Diagnostic Search blade, click Filters to pick the types of events you want to see.
· Trace – Search diagnostic logs that you’ve captured from your web server. This includes log4Net, NLog, System.Diagnostic.Trace, and ApplicationInsights TrackTrace calls.
· Request – Search HTTP requests received by the server component of your web app, including page requests, data requests, images, and so on. The events you’ll see are the telemetry sent by the Application Insights server SDK, which are used to create the request count report.
· Page View – Search page view events. These events are sent by the web client and are used to create page view reports. (If you don’t see anything here, set up web client monitoring.)
· Custom Event – If you inserted calls to TrackEvent() monitor usage, you can search them here.
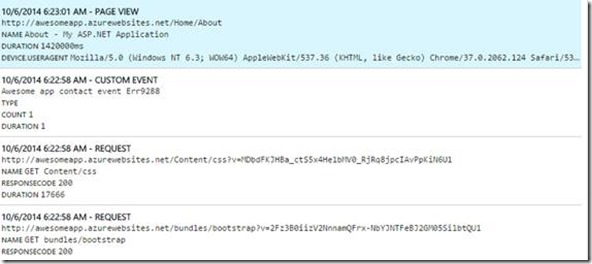
If you’ve already used diagnostic search, you’ll know how you can insert trace calls in your app, using the log4Net, NLog, or System.Diagnostics frameworks. The resulting logs are sent back to Application Insights, where you can perform full-text searches on them to pinpoint problems. Previously, it wasn’t always obvious which HTTP requests gave rise to the different trace events. But now, you can follow individual calls through from the page view on the web browser through the request on the server, and any resulting trace calls that you’ve inserted.
Time-ordered results
When diagnosing a livesite issue, it’s usually the case of needle in the haystack. And most times there are cues everywhere leading up to the root cause. By filtering on event types and searching on relevant terms, you can find the sequences that show you what’s happening in your app.
Timeline Chart
Based on the search query, we built the entire search result page which includes a visual way of looking at the search results. The chart below the search bar displays the count of each type of an event as timeline of events that happened in your app. And this helps in understanding the trend of events resulting from the search query.
Getting started
To use this functionality, you’ll need the Azure version of Application Insights, which comes as an SDK preloaded in Visual Studio 2013 Upgrade 3. However, after October 9th, you’ll need to upgrade to the 0.11.0-prerelease version, to get diagnostic search. Yes, that’s a chore, but it’s part of our continuous improvement cycle. It’s a top priority with us to help you detect, triage and diagnose issues in your web applications. These changes help you get to the root cause of your issues.
To find out more information about the different versions of Application Insights please see the documentation here.
Breaking change ****this week: Update your SDK to keep using diagnostic search
If you are an existing Application Insights user and using any one of the pre-release SDKs for sending logging events, we have a breaking change coming this week. On 9th October, we are planning to release the new Application Insights SDK (0.11.0-prerelease). Download this SDK and redeploy your application to continue sending your logging events to Application Insights. We will have a new blog post once we release this SDK with more details.
As usual, we are awaiting to hear your feedback here as comments or in the Application Insights forum.


 Light
Light Dark
Dark
0 comments