If you are developing a Windows Store App using XAML (whether it’s C++, C#, or VB), there is a good chance there will be areas of your app where you would like to improve the performance. To assist with this, we’ve included the Visual Studio CPU profiler in all SKUs of Visual Studio capable of developing Windows Store Apps (this means we’ve moved the CPU profiler from being a Visual Studio Premium feature, to including it Visual Studio 2012 Professional and Visual Studio 2012 Express for Windows 8). In this post I’ll walk you through how to use the CPU profiler to identify areas of your code that are being executed most frequently to improve the performance.
For this post, I’ll be evaluating a simple game I’ve written in C# and XAML I called BubblePopper. This game has bubbles that drift left and right as they float towards the top of the screen and clicking or pressing on them will result in them popping.

Unfortunately, whenever a bubble changes direction I notice that it seems to pause for a brief period of time resulting in a jittery experience in the game. So I’m going to use the profiler to investigate this behavior.
Collecting data
Once I have the Bubble Popper solution open in Visual Studio, I use “Debug -> Start Performance Analysis” to launch the profiler.
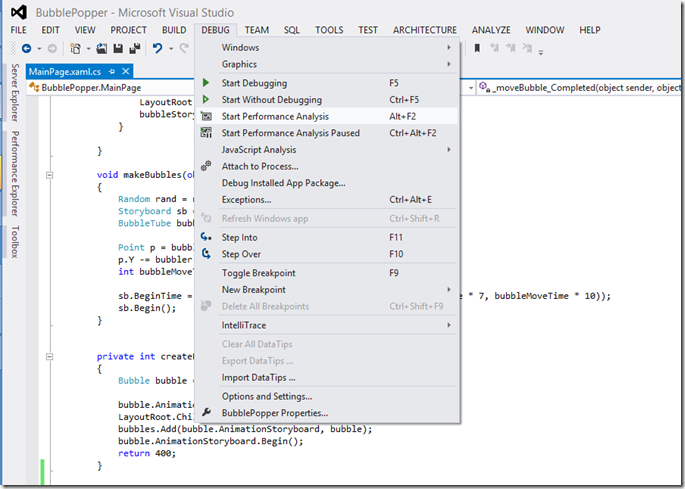
This will build and deploy my application then launch it with the profiler attached. If this is the first time I’ve used the profiler since I launched Visual Studio I will need to accept the elevation prompt for vsperf.exe
Once my application is up and running, in Visual Studio I see the “Profiling in Progress” page that lets me know data collection is in progress. From here I can pause data collection as well as stop profiling when I am done.
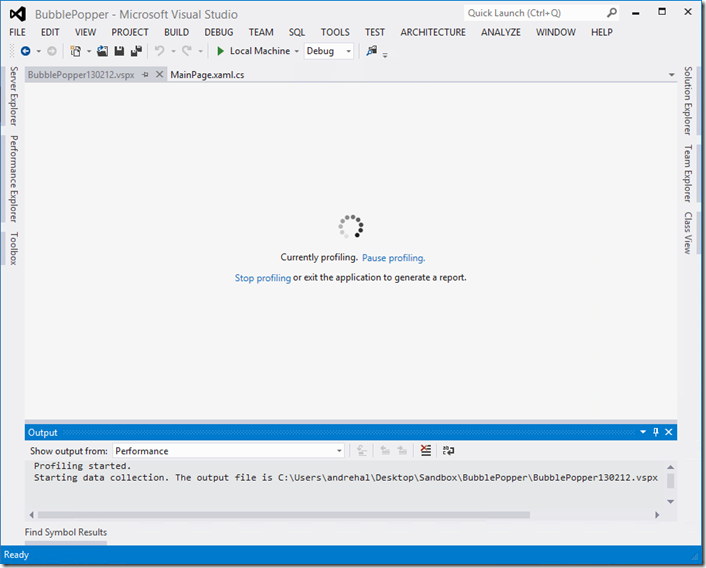
Now it’s time to exercise the scenario that I want to improve the performance for in my app. In the case of the Bubble Popper application I simply play the game for about a minute, letting the bubbles drift upwards while clicking on a few to pop them.
After about a minute, I’m confident that I have collected enough data to get an accurate picture of my applications performance, so I return to Visual Studio and click “Stop Profiling”.
Brief overview of CPU sampling
Before continuing I’ll briefly explain CPU sampling as understanding how it works is key to making use of it when investigating performance problems. CPU sampling collects a call stack once every millisecond from the CPU (one call stack per core, so on a quad core machine for example there could be four stacks collected every millisecond).
Once profiling is stopped a report is built that is the summary of all the aggregated call stacks. The report will then show which methods were on the call stack most frequently (inclusive samples) and which methods were actually executing most frequently (exclusive samples) when the stacks were taken.
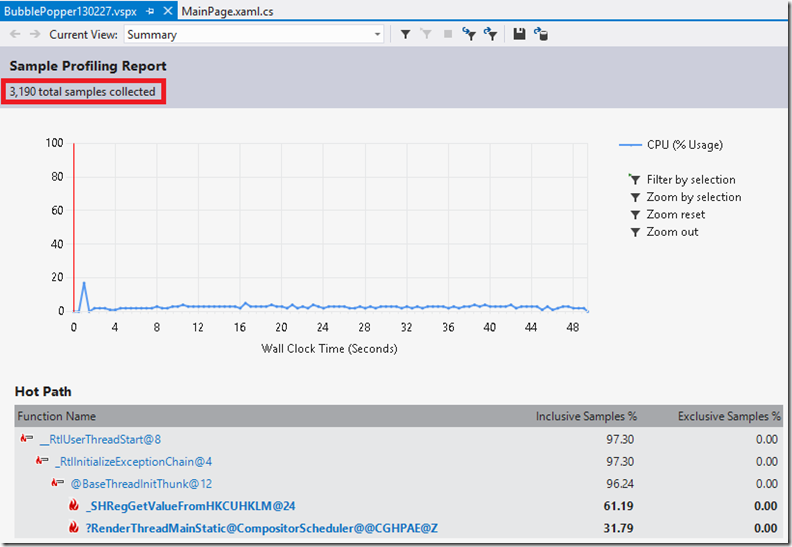
This means that when collecting data, the longer I can collect for, the more accurate my percentages are going to be. It also means that when analyzing the report generally the percentage values are more interesting data points than actual counts. However it is useful to note the total number of samples (displayed in the top left of the summary page), as a small number of samples will indicate that you need to collect more data in order to have confidence that the report contains enough to make the data statistically significant.
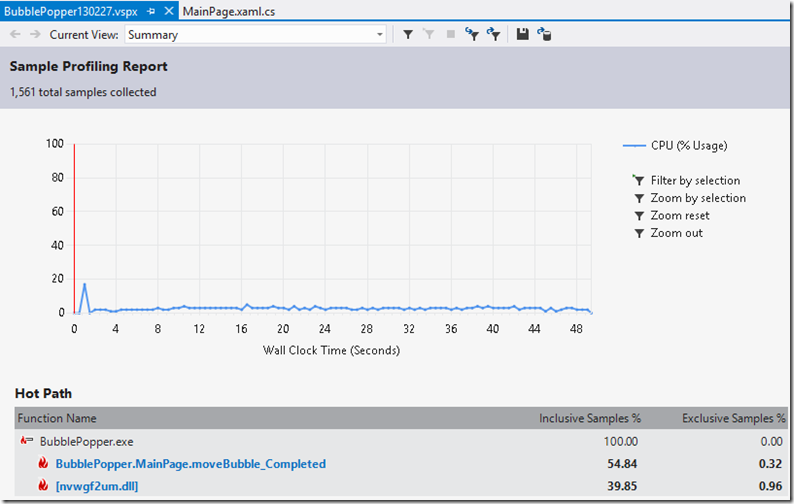
One thing to note is that that Just My Code (JMC) will not count samples that do not contain “your code” anywhere on the call stack. We consider this to be a good thing in most cases because it filters out code you likely can’t do anything about so the report stays more focused on code you likely control (which is why we have turned on by default). It is however something to be aware of. For example the two screen shots below are from the exact same report, but the first has JMC enabled, where the second has it disabled. Notice how the hot path with JMC disabled no longer contains any of the BubblePopper code.
Analyzing the report
After I click stop profiling, data collection will be stopped, the target application will be terminated, and the report will begin to be analyzed. During this process, the profiler will attempt to load symbols using your Visual Studio symbol settings
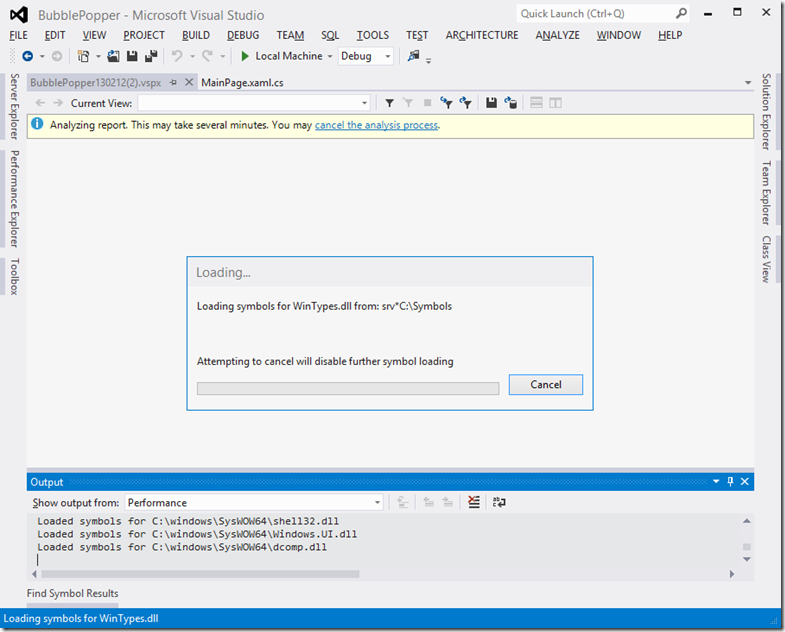
[Note: We improved the symbol loading experience in Visual Studio 2012 Update #2 by changing the profiler to use the debugger’s symbol loading functionality. For more please read this blog post on symbol loading improvements.]
Summary Page
After analysis is finished the first page you will see is the Summary Page. The summary page contains three main areas of information:
- CPU chart: shows the CPU use of your application over time. You can filter the report using this chart to investigate interesting spikes. Note: the chart is the percentage of CPU based on the total number of cores on your machine. Meaning if your application was using 50% of a single core on a dual core machine, the chart will show 25%. The chart does not distinguish between cores.
- Hot path: this is the call stack that your application spent the most time in during the profiling session (based on inclusive samples)
- Functions doing the most individual work: are the individual functions that the most CPU time was spent in (based on exclusive samples)
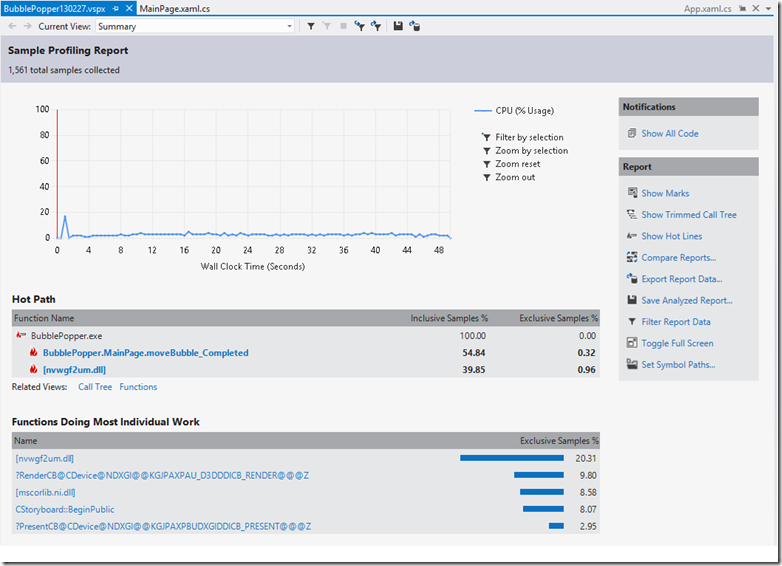
Here I want to point out that the CPU profiler is going to help me improve the performance of my application even though my application is not using a high percentage of CPU. That’s because even if the application is not CPU bound, frequently problems can be found with sampling because applications spend the most time in the expensive code paths resulting in the hot path pointing to the problem area.
A quick note on symbols. If you notice in the screenshot above [mscorlib.ni.dll] appears in the functions doing the most work. When a module name appears in square brackets it means that symbols were not loaded for that module. When the module name has “.ni” in it, this indicates that it is an NGENd managed module. For instructions on symbols for NGENd modules see creating NGEN PDBs for profiling reports.
From the summary page I’m going to click on the “MainPage.moveBubble_Completed” on the hot path since I see that ~55% of the inclusive samples were in that method and only ~39% were in the next method down on the call stack.
Function Details
When I click on a function name in the summary page (as I did above), it will open the Function Details view for that function. The top section shows me the percentage of samples captured in:
- The functions (if any) that called the current function
- The current function, including the percentage of samples collected while executing the function body (meaning not in a child method)
- The distribution of samples among the various functions called by the current function
The bottom section hosts a read only view of the editor that overlays the sample distribution on the individual lines of code, so I can quickly see which lines are the most expensive

<p>Looking at this view shows me that my app is spending ~27.5% of the work being done creating a new storyboard every time, and another 5.9% just to add the event handler for the method I’m currently in. I can also see that I’m spending work to retrieve the x and y DoubleAnimation objects and properties.</p> <p>To improve this, I’m going to try:</p> <ul> <li>Re-using the existing storyboard that just ended only updating the x and y DoubleAnimation properties</li> <li>Storing the DoubleAnimation objects as properties in the Bubble class so they don’t need to be retrieved from the TimelineCollection</li> <li>Storing the destination x and y coordinates as properties in the Bubble class so they don’t need to be retrieved from the DoubleAnimation objects</li> </ul> <p>This results in the following moveBubble_Completed implementation (I’ve left most of the original code commented out to help highlight the changes).</p> <p><a href="https://devblogs.microsoft.com/00/00/00/45/92/metablogapi/1273.image_4F26F994.png"><img title="image" border="0" alt="image" src="https://devblogs.microsoft.com/devops/wp-content/uploads/sites/6/2013/02/0601.image_thumb_5CF93F8F-1.png" width="560" height="734" /></a></p> <h4>Call Tree View</h4> <p>Now that I think I’ve improved the performance of that method, I want to double check to see if any other code paths look like they would be interesting to optimize before I test the performance of my application again. To do this, choose “Call Tree” from the “Current View” dropdown in the toolbar of the report</p> <p><a href="https://devblogs.microsoft.com/00/00/00/45/92/metablogapi/4885.image_35BEF65A.png"><img title="image" border="0" alt="image" src="https://devblogs.microsoft.com/devops/wp-content/uploads/sites/6/2013/02/8080.image_thumb_43913C55-1.png" width="571" height="262" /></a></p> <p>This will change to the call tree view of the profiler that shows me the complete distribution of the samples in my application. Looking at the call tree, I see that the only other call path that seems to have any significant number of samples in it is in nvwgf2um.dll which is ~40% of the CPU samples.</p> <p><a href="https://devblogs.microsoft.com/00/00/00/45/92/metablogapi/2474.image_17B8B6CB.png"><img title="image" border="0" alt="image" src="https://devblogs.microsoft.com/devops/wp-content/uploads/sites/6/2013/02/5826.image_thumb_62AC279A-1.png" width="817" height="169" /></a></p> <p>This isn’t part of my application, but a quick search for the .dll tells me that it is my display driver. There isn’t much I am going do about the display driver using CPU at this point, and the next place where I see my code is the “makeBubbles” function that is using ~2.25% of my samples so I’m ready to run my application again and see how it performs.</p> <p>Launching the application shows that the bubbles change direction much smoother, so it looks like I have achieved my goal of improving the performance of this scenario in my app.</p> <h3>In Closing</h3> <p>While this was a simple example focused on a Windows Store App, hopefully it helps you to see how you can use the CPU profiler to improve the performance in any managed or native application.</p> <p>This was a brief introduction to the profiler where I only covered three of the views in the profiler, you may be interested in exploring the <a href="http://msdn.microsoft.com/en-us/library/dd255394.aspx">other views included in the sampling report</a>, or experimenting with the views I covered in more depth (including the <a href="http://msdn.microsoft.com/en-us/library/ms182391.aspx">other available columns</a> that are not shown by default).</p> <p>If you have any comments/question I’d love to hear them in the comments below or in our <a href="http://social.msdn.microsoft.com/Forums/en-US/vsdebug/threads">MSDN forum</a>.</p>

0 comments